SlideShare a Scribd company logo
1 of 7
Download to read offline
The International Journal Of Engineering And Science (IJES)
|| Volume || 3 || Issue || 7 || Pages || 48-54 || 2014 ||
ISSN (e): 2319 – 1813 ISSN (p): 2319 – 1805
www.theijes.com The IJES Page 48
Theory and Simulation of EPR Orthorhombic Jahn-Teller Spectra of Cu2+
in Cd2 (NH4)2(SO4)3 Single Crystals at Different Temperatures
J B Yerima1
, A B Dikko1
and D K De2
*1
Department of Physics, Modibbo Adama University of Technology Yola, Nigeria
2
Department of Physics, Kaduna State University, Kaduna State, Nigeria
-------------------------------------------------------------ABSTRACT--------------------------------------------------------
This paper presents the theory and simulation of the derivative line shape function of the EPR orthorhombic
Jahn-Teller spectra of Cu2+
in Cd2(NH4)2(SO4)3 single crystals. Computer simulation of the Cu2+
EPR spectra
using the spectrum fitting technique has been carried out in the temperature range of 15-180 K. The results
show excellent fit between the simulated and observed spectra. The insufficient resolution of the spectra at 15 K
is attributed to the coupling of copper isotopes and its orthorhombicity to phonon-induced reorientation rate or
quantum tunnelling of Cu2+
ions among the three JT potential wells. The splitting processes in the 3d9
orbital
states of Cu2+
has been explained and in conjunction with the demands of the criterion of pure static JT systems,
the random strain splitting is found to be 0.0176 cm-1
and 0.0342 cm-1
at 15 K and 180 K respectively.
Keywords: Simulation, EPR orthorhombic Jahn-Teller spectra, temperature
---------------------------------------------------------------------------------------------------------------------------------------
Date of Submission: 25 June 2014 Date of Publication: 20 July 2014
---------------------------------------------------------------------------------------------------------------------------------------
I. INTRODUCTION
Jona and Pepinsky (1956) discovered the Langbeinite family of compounds with general chemical
formula (X+
)2(Y2+
)2(SO4)3 where X+
is ammonia or monovalent metal and Y2+
is a divalent metal. According to
Babu et al (1984), many authors have carried out a number of investigations on the microscopic properties of the
langbeinite family of crystals. The compound cadmium ammonium sulphate, Cd2(NH4)2(SO4)3 abbreviated as
CAS is isomorphous to potassium magnesium sulphate, K2Mg2(SO4)3 abbreviated as PMS and both are
members of the langbeinite family of crystals. The detailed x-ray data regarding the atomic positions in CAS
does not seem to be available in the literature but that of PMS have been reported by Zemann and Zemann
(Babu et al, 1984). Also they stated that some authors have shown that the langbeinite family of compounds in
cubic space group P2/3 with a=10.35 have four molecules per unit cell. The structure consists of a group of
(SO4)2-
tetrahedral and Cd2+
metal ions. There are two each crystallographically non-equivalent Cd2+
and (NH4)+
sites. Each Cd2+
is surrounded by six oxygen atoms which form a slightly distorted octahedron. Yerima (2005,
2007) stated that EPR studies of Misra and Korezak in 1986 using Mn2+
as a probe revealed a phase transition at
94.5 K whose mechanism was attributed to the freezing out of the rotation of the (SO4)2-
ion. Also he stated that
EPR studies of Mouli and Sastry in 1962 using Cu2+
probe at room temperature and 77 K yielded eight poorly
resolved hyperfine lines in a general direction and a set of four unresolved hyperfine lines in any
crystallographic plane. Their computed values of the g-factor showed that g//>gᗮ and that the Amax is falling
along gmin. They concluded that Cu2+
ions in this system may be in a compressed octahedral position or entered
into the system interstitially rather than substitutionally. The shortcomings of the study of Mouli and Sastry
include its limitation to 77 K and its failure to focus on JT effect that could be associated with Cu2+
in this
crystal as earlier hinted by Babu et al in 1984. Raman spectroscopy performed by Rabkin et al (1981) provided
substantial information on the structural phase transition in this crystal. They observed that CAS exhibits a
structural phase transition on lowering the temperature from space group p2/3 to p21 at about 95 K, the lower the
temperature phase being ferroelectric. Babu et al (1984) in their summary stated that Bhat et al (1973) EPR
spectra of Mn2+
in the two phase groups of CAS observed at room temperature and at liquid nitrogen were
slightly different, particularly in the magnitudes of their zero-field splitting, as a result of small orthorhombic
component in the low temperature phase. The differences in the spectra indicated a phase transition from high
temperature phase p2/3 to a low temperature phase p21. In another outlook, Yerima (2005) stated that Ng and
Calvo in 1975 observed in their EPR studies using Mn2+
in the temperature range 300-77 K observed definite
change in the spectral pattern from that of room temperature to that of liquid nitrogen temperature due to a phase
transition from p2/3 to a space group of lower symmetry at low temperature. They did not analyze the spectra nor
determine the phase transition temperature due to the complexity of the spectra at liquid nitrogen temperature.
Theory and Simulation of EPR Orthorhombic Jahn-Teller Spectra...
www.theijes.com The IJES Page 49
The study of phase transition in CAS using VO2-
as a probe in the temperature range of 573-77 K
showed a complex spectrum, in which Babu et al (1984) were unable to identify the phase transition temperature
and they suggested that the lower temperature phase stabilizes at temperatures higher than 95 K. This was due to
a local stabilization of the low symmetry phase by vandyl ions. They also found that the data of their experiment
contained Cu2+
ion as contaminant and thus concluded that the complication in their results could have been due
to a possible JT effect associated with Cu2+
ion in this crystal. Unfortunately, they did not carry out further
investigation to establish or rule out the possibility of JT effect due to Cu2+
ion in this system.
De (2010) said in order to ascertain JT effect of Cu2+
in CAS Oguama carried out detailed EPR study
of Cu2+
doped in CAS at various temperatures in the range of 300-15 K with angular variations usually at steps
of 5o
and 0.5o
near JT extrema points in three mutually perpendicular planes of CAS single crystals. The
Cu2+
:CAS spectra consists of finely resolved hyperfine lines in the low magnetic field region at all temperatures
except 15 K while those in the high magnetic field region are poorly resolved at high temperatures. The complex
or insufficient resolved splitting patterns of the spectra constitute a major problem in the extraction of the
relevant spectroscopic parameters (resonance frequency, coupling constants, linewidths) from the spectra as
starting points in the computer simulation of the spectra. Therefore, a straightforward analysis is not possible in
general (neither for the human expert nor for a conceivable computer expert system (kirste, 1992)). It is against
this background, several methods (spectrum contraction or elimination hyperfine splitting constants, extraction
of hyperfine splitting constants, correlation method, maximum method, significance plots and ‘’roll-up’’
transformation) have been employed in the analysis of high resolution EPR spectra (Kirste, 1992; Wu, 2006).
These methods may be more or less useful in providing estimates for the hyperfine coupling constants. On the
other hand, the set of relevant spectroscopic parameters extracted from the spectra can be verified by spectrum
simulation and comparison with the experimental spectrum which is the method adapted in this paper. We have
adapted the spectrum fitting because it is considered an indispensable component in any scheme automated
spectrum analysis.
Theory and Method of Computer Simulation of the Line Shape Function of Cu2+
in CAS
The detailed procedure of the experiment for determining Cu2+
spectra in CAS is available in Oguama
(1997) and De (2010). The Oguama (1997) spectra of Cu2+
in this system at various temperatures were acquired
for the computer simulation. The expression for the line shape function required for the computer simulation of
the EPR spectra is derived from the spin Hamiltonian as follows: Thus, if the magnetic field is oriented along z-
direction (100) of one of the orthorhombic JT distortions of the Cu2+
in CAS, the field Hz sees the gz as well as
gx, gy tensor axes simultaneously unlike non-JT ions, and the spin Hamiltonian Hs becomes for H along z, i.e.
Hx=Hy=0.
1
The expectation values of the Zeeman interaction for Cu2+
can be deduced taking into consideration the tunnel
splitting equations of d9
ions given by (Boatner and Reynolds, 1977)
2
where the terms with subscripts x or y in equation (1) vanishes i.e. Hx=Hy=0, etc. The effective Hamiltonian for
Cu2+
is obtained by adding equations (2) bearing in mind the orthorhombic g and A tensors leading to
3
where 3 is the tunnel splitting. The knowledge of the ratio of the random strain splitting, , to the tunnel
splitting, 3, tells us the type of JT effect present in the system in question.
Considering the hyperfine interactions as perturbations up to second-order instead of a single transition between
the non-JT Kramer’s doublet, we have three transitions for magnetic field parallel z direction (in the case of a
single Cu2+
per unit cell in the static JT regime) for JT Kramer’s doublet as follows (assuming that the principal
axis of the g-tensor ellipsoid coincides, in orientation, with the principal axes of the hyperfine terms):
Theory and Simulation of EPR Orthorhombic Jahn-Teller Spectra...
www.theijes.com The IJES Page 50
4
5
6
Now considering only the first order terms in equations 4-6 the function describing line shapes in a non-JT
complex for H along any g direction may be given by V . Thus, following the theory of the
orthorhombic JT complex and considering transitions in equations 4-6, the resultant line shape function will be
simultaneously governed by three functions given by
7
8
9
Thus the expression for the derivative EPR line shape can be written as
10
where ,
, ,
with ωT(=1,2,3) being the peak-to-peak linewidth (ΔHpp). Finally integrating equation (10), the derivative line
shape function of EPR spectra of Cu2+
manifesting static JT effect with orthorhombic g and A tensors in CAS is
given by
11
where , α is the fractional
relative abundance of copper isotopes α(Cu63
) = 0.69 and α(Cu65
) = 0.31 ; gx, gy, gz are g-factors along the x-, y-
, and z-axes respectively; H is the applied magnetic field; Ax, Ay, Az are the hyperfine constants in the x-, y-,
and z-axes respectively; R1, R2, R3 are the linewidth parameters in the x-, y-, and z-axes respectively; MI=-3/2, -
1/2, 1/2, 3/2 and β is the Bohr magneton. The terms in the curly brackets represent the magnification factor of
the line shape while the terms in square brackets determine the shape of the EPR line. The spectra of Cu2+
in
CAS at low temperatures consists of three sets of four resolved hyperfine lines in both the g// and gᗮ directions.
This implies that at the point of inflection the derivative line shape function is zero or cuts the H-axis four times
in each of the three sets of four resolved lines. Thus the values of H corresponding to the points of inflection or
zero F(H) can be determined. This means that the terms in square brackets must be zero i.e. .
Using two values of H(H1 and H2) and corresponding to inflection points where F(H)=0, the
corresponding expression for hyperfine constants is given by where n is the
number of complete resolved hyperfine lines and n-1 gives the number of hyperfine constants. For example, for
Cu63
and so that which is equivalent to n = 4.
Theory and Simulation of EPR Orthorhombic Jahn-Teller Spectra...
www.theijes.com The IJES Page 51
On the other hand, generally the g values are obtained by noting the middle field point Hmf of the
hyperfine lines corresponding to and and using the relation . The
calculated A and g values and estimated value of peak-to-peak linewidths (i=x,y,z) were used as starting
points in the computer simulation process. These values of g, A and were substituted in the expression of
F(H) and the resulting line shape was compared or matched with observed EPR line. The values of g, A and
were varied by small amounts in the ranges ±0.005-0.01, ±0.5-1 G, and ±5-10 G respectively around the
initial values until the line that best fits the observed EPR line was obtained. The presence of M-shape at the
first crest and W-shape at the last trough corresponding to g// lines are assumed to be due to coupling between
Cu63
and Cu65
isotopes at low temperatures (Yerima, 2007). Now, if Cu63
was the only one present in the sample
of CAS we would expect only one set of four finely resolved hyperfine g// lines corresponding to MI=-3/2, -1/2,
1/2, 3/2 as opposed to six lines for only Cu65
(MI = -5/2, -3/2, -1/2, 1/2, 3/2, 5/2) present. If the two copper
isotopes coexist, they couple with one another giving rise to poor resolution in the form of M-shape and W-
shapes as observed at the beginning and end of the g// lines. In this case, the isotope effect is taken into account
in search for the best line of fit using computer simulation. The effective values of g, A and corresponding
to the simulated EPR lines of Cu2+
in CAS at different temperatures were recorded. However, the effect of
isotope is neglected by setting α=1 where there are no M-and W-shapes present in the EPR spectra.
Results and discussion
Theory and Simulation of EPR Orthorhombic Jahn-Teller Spectra...
www.theijes.com The IJES Page 52
Fig. 1 Observed (solid lines) and simulated (dashed lines) spectra of Cu2+
:CAS at different
temperatures
The EPR spectra of Cu2+
in CAS (Fig. 1), in an ac plane, show three groups of four resolved hyperfine
lines in such a way that one set appeared at the low magnetic field and the remaining two at high magnetic field.
The high resolution of the spectra in the high magnetic field region at 15 K results to reduction in broadening
due to spin lattice relaxation time. The solid lines represent the observed spectra while the dashed lines are the
simulated spectra. The complete anisotropic spectra of the hyperfine lines in the temperature range (15≤T≤180
K) has been attributed to phonon-induced reorientation rate or quantum tunnelling of the Cu2+
ions among the
three JT
Table 1 Observed and simulated g, A and ΔHpp values
T (K) gz gx gy g<111> Az (G) Ax(G) Ay(G) A<111> (G) ΔHpp (G)
15 2.415
2.416
2.144
2.136
2.094
2.093
2.222
2.214
104
102
20
20
17
16
62
62
12.0
12.0
80 2.401
2.397
2.150
2.148
2.101
2.101
2.221
2.220
96
95
12
**
*
**
56
**
12.0
12.0
100 2.393
2.393
2.151
2.149
2.103
2.105
2.219
2.219
94
93
*
**
*
**
*
**
14.0
14.2
120 2.384
2.380
*
**
*
**
*
**
91
92
*
**
*
**
*
**
16.0
16.3
140 2.370
2.367
*
**
*
**
*
**
88
88
*
**
*
**
*
**
20.0
19.8
180 2.353
2.348
*
**
*
**
*
**
80
80
*
**
*
**
*
**
24.0
24.8
where bold face values represent simulated values, * and ** represent missing observed and simulated values
respectively.
(a)
Theory and Simulation of EPR Orthorhombic Jahn-Teller Spectra...
www.theijes.com The IJES Page 53
(b)
Fig. 2 Variation of observed and simulated (a) g-values and (b) A-values with temperature
potential wells and Cu2+
ions would then stabilize statistically among the three JT wells (Yerima and De, 2014).
The observed and simulated values of the hyperfine coupling constant (A), g-factor (g) and peak-to-peak
linewidth (ΔHpp) at various temperatures are recorded in Table 1. The results show that Az and gz measured in
the parallel direction of the magnetic field decrease with temperature while g⊥(gx,gy) and A⊥(Ax,Ay) increase
with temperature.
The main difficulty in computer assisted structure elucidation consists in the extraction of the relevant
spectroscopic parameters such as resonance frequency, coupling constants and linewidths from the spectra. In
this study, this problem has not been solved in totality because of highly complex or insufficiently resolved
splitting of the g⊥ lines of Cu2+
:CAS EPR spectra at high temperatures. However, the complete resolution of the
hyperfine lines has provided reliable information that the number of equivalent nuclei in this system is three
resulting to the four hyperfine lines of intensity ratios 1:3:3:1 in each of the three groups of four hyperfine lines.
Free ion ground Crystal field Vibronic Strain’s Zeeman
Term splitting coupling splitting splittimg
Fig. 3 Various splitting processes of 2
D ground state of cu2+
Fig. 3 shows the representation of the effects of the cubic crystal field, vibronic coupling, strain
splitting, and Zeeman interaction on a 2
D electronic state. Allowed ΔMs=±1, ΔMI=0 EPR transitions are
indicated by straight arrows at the right hand side of the Figure. Curved arrows correspond to vibronic
relaxation effects which can produce an isotropic spectrum by averaging a portion of the strained-broadened
resonance pattern. A host of authors (Reynolds and Boatner, 1975; Boatner and Reynolds, 1977) have shown
that for pure static JT systems like Cu2+
:CAS, the ratio of the random strain splitting to the tunnel splitting
is greater than 5 i.e. . Thus, for the residual linewidth, ΔHpp=12 G and g=2.415 at 15 K,
Theory and Simulation of EPR Orthorhombic Jahn-Teller Spectra...
www.theijes.com The IJES Page 54
and similarly at 180 K, ΔHPP=24 G and g=2.353, we
have Thus increases with temperature and is far less than the average crystal splitting
Δ=289.6 cm-1
(Yerima and De, 2014) computed from intensity and linewidth measurements.
In the case of Cu2+
:CAS, the presence of M- and W-shapes at the beginning and end of the g// lines at low
temperatures is attributed to the coupling of copper isotopes (copper 63(69%) and 65(31%)) (Yerima, 2007).
The copper 63 ion has 3 equivalent protons while copper 65 ion has 4 which are expected to give 4 and 5
respectively resolved g⊥ or g// lines. At low temperatures, say 15 K, coupling of copper 65 ions becomes
significant interacting with that of copper 63 ions giving rise to the M- and W-shapes. At high temperatures,
copper 63 ions dominates giving rise to the four resolved g// lines and the g⊥ lines are insufficiently resolved
(Fig. 1).
CONCLUSION
In this paper, the theoretical expression for the line shape function of the orthorhombic JT spectra of
Cu2+
in CAS system have been reported. The spectra of Cu2+
:CAS were simulated by the aid of computer using
spectrum fitting technique at various temperatures. The results show that the simulated spectra match excellently
well with the observed spectra especially at the low field region where the hyperfine lines are sufficiently
resolved. The splitting processes in the 3d9
orbital states of Cu2+
have been discussed. The criterion of pure
static JT systems demands that the condition 5 must be satisfied, where and the
random strain splitting was found to be about 0.0176 cm-1
at 15 K and 0.0342 cm-1
at 180 K. The insufficient
resolution of the spectra especially at the high magnetic field side and temperatures is attributed to the rate of
coupling of copper ions in this system.
REFERENCES
[1]. Babu D. S, Sastry G. S, Sastry M. D and Dalvi A. G. I (1984) Structural phase transition in Langbeinites an
[2]. EPR study, j. Phys. C. Solid state Phys. 17, 4245
[3]. Boatner L. A, Reynolds R. W, Chen Y and Abraham M. M (1977) Static, quasistatic and quasidynamic Jahn Teller effect in EPR
spectra of Ag+
SrO, CAO and MgO. Phys. Rev. B16, 1, 86
[4]. De D K (2010) First observation of orthorhombic Jahn-Teller EPR spectra in Cu II doped
[5]. (NH4)2Cd2(SO4)3.6H2O single crystals, Paper I, African Physical review$:0011, 87
[6]. Jona F and Pepinsky R (1956) In low energy electron diffraction (LEED) spectra. Al. IBMJ. Res. Center, York Town
[7]. Kirste B (1992) Methods of automated analysis and simulation of EPR spectra. Anal. Chim. Acta. 191-200, 265
[8]. Oguama F A (1997) EPR studies on the effect of magnetic Jahn-Teller and Jahn-Teller impurities on solid state
[9]. phase transitions. Doc. Dessert. Wake Forest Uni. USA.
[10]. Rabkin L. M, Torgashov V. I and Brezina B (1981) Ferroelectrics 36, 476
[11]. Reynolds R. W and Boatner L. A (1975) Dynamic, intermediate and static Jahn-Teller in the EPR spectra of 2
E
[12]. orbital states. Phys. Rev B12, 4735
[13]. Wu H (2006) EPR spectra simulation of anisotropic ½ spin. Hanqing@csd.uwIII.edu.
[14]. Yerima J. B (2005) EPR studies in the effect of paramagnetic impurities in phase transition and Jahn-Teller effect in crystalline
solids: A review. Tech and Dev Journal,9
[15]. Yerima J. B (2007) EPR studies of the effect of paramagnetic impurity concentrations in phase transition and
[16]. Jahn-Teller effect in crystalline solids. Doc. Dissert. FUTY, Nigeria
[17]. Yerima J B and De D K (2014) Temperature Dependence of EPR Linewidth and Intensity in
[18]. Cd2(NH4)2(SO4)3 single crystals, Vonuklang Multidisplinary Journal of Science and Technology, Vol 1, No.1

More Related Content

What's hot

Thermoelectric Power Studies of Ni-Co Nano Ferrites Synthesized By Citrate-Ge...
Thermoelectric Power Studies of Ni-Co Nano Ferrites Synthesized By Citrate-Ge...Thermoelectric Power Studies of Ni-Co Nano Ferrites Synthesized By Citrate-Ge...
Thermoelectric Power Studies of Ni-Co Nano Ferrites Synthesized By Citrate-Ge...IOSR Journals
 
Fac/Mer Isomerism in Fe(II) Complexes
Fac/Mer Isomerism in Fe(II) ComplexesFac/Mer Isomerism in Fe(II) Complexes
Fac/Mer Isomerism in Fe(II) ComplexesRafia Aslam
 
Harcourt-Essen Reaction
Harcourt-Essen ReactionHarcourt-Essen Reaction
Harcourt-Essen ReactionRafia Aslam
 
Theoretical and Applied Phase-Field: Glimpses of the activities in India
Theoretical and Applied Phase-Field: Glimpses of the activities in IndiaTheoretical and Applied Phase-Field: Glimpses of the activities in India
Theoretical and Applied Phase-Field: Glimpses of the activities in IndiaDaniel Wheeler
 
Dielectric Constant Measurement on Calcium and Lanthanum Doped Triglycine Sul...
Dielectric Constant Measurement on Calcium and Lanthanum Doped Triglycine Sul...Dielectric Constant Measurement on Calcium and Lanthanum Doped Triglycine Sul...
Dielectric Constant Measurement on Calcium and Lanthanum Doped Triglycine Sul...IOSR Journals
 
Lattice Parameters and Debye Temperature of Naclx Nabry-X Kcl1-Y Ternary Mixe...
Lattice Parameters and Debye Temperature of Naclx Nabry-X Kcl1-Y Ternary Mixe...Lattice Parameters and Debye Temperature of Naclx Nabry-X Kcl1-Y Ternary Mixe...
Lattice Parameters and Debye Temperature of Naclx Nabry-X Kcl1-Y Ternary Mixe...IOSR Journals
 
Phase-field modeling of crystal nucleation: Comparison with simulations and e...
Phase-field modeling of crystal nucleation: Comparison with simulations and e...Phase-field modeling of crystal nucleation: Comparison with simulations and e...
Phase-field modeling of crystal nucleation: Comparison with simulations and e...PFHub PFHub
 
RSC ADV Prashant 6th paper (1)
RSC ADV Prashant 6th paper (1)RSC ADV Prashant 6th paper (1)
RSC ADV Prashant 6th paper (1)Prashant Sharma
 
Nucleation III: Phase-field crystal modeling of nucleation process
Nucleation III: Phase-field crystal modeling of nucleation processNucleation III: Phase-field crystal modeling of nucleation process
Nucleation III: Phase-field crystal modeling of nucleation processDaniel Wheeler
 
Growth and characterization of some ternary chalcopyrite from the group AlBll...
Growth and characterization of some ternary chalcopyrite from the group AlBll...Growth and characterization of some ternary chalcopyrite from the group AlBll...
Growth and characterization of some ternary chalcopyrite from the group AlBll...IRJET Journal
 
2000 guerman-pyrochemistry technetium
2000 guerman-pyrochemistry technetium2000 guerman-pyrochemistry technetium
2000 guerman-pyrochemistry technetiumKonstantin German
 
Study on Ni 0.5-X Znx Cu0.5 Fe2 O4 Sintered Ferrite System Using Xrd & High F...
Study on Ni 0.5-X Znx Cu0.5 Fe2 O4 Sintered Ferrite System Using Xrd & High F...Study on Ni 0.5-X Znx Cu0.5 Fe2 O4 Sintered Ferrite System Using Xrd & High F...
Study on Ni 0.5-X Znx Cu0.5 Fe2 O4 Sintered Ferrite System Using Xrd & High F...paperpublications3
 
Phase-field modeling of crystal nucleation I: Fundamentals and methods
Phase-field modeling of crystal nucleation I: Fundamentals and methodsPhase-field modeling of crystal nucleation I: Fundamentals and methods
Phase-field modeling of crystal nucleation I: Fundamentals and methodsDaniel Wheeler
 
Phase transformation and volume collapse of sm bi under high pressure
Phase transformation and volume collapse of sm bi under high pressurePhase transformation and volume collapse of sm bi under high pressure
Phase transformation and volume collapse of sm bi under high pressureAlexander Decker
 

What's hot (20)

capp4
capp4capp4
capp4
 
Thermoelectric Power Studies of Ni-Co Nano Ferrites Synthesized By Citrate-Ge...
Thermoelectric Power Studies of Ni-Co Nano Ferrites Synthesized By Citrate-Ge...Thermoelectric Power Studies of Ni-Co Nano Ferrites Synthesized By Citrate-Ge...
Thermoelectric Power Studies of Ni-Co Nano Ferrites Synthesized By Citrate-Ge...
 
Kinetics of Chain reaction
Kinetics of Chain reactionKinetics of Chain reaction
Kinetics of Chain reaction
 
Fac/Mer Isomerism in Fe(II) Complexes
Fac/Mer Isomerism in Fe(II) ComplexesFac/Mer Isomerism in Fe(II) Complexes
Fac/Mer Isomerism in Fe(II) Complexes
 
Harcourt-Essen Reaction
Harcourt-Essen ReactionHarcourt-Essen Reaction
Harcourt-Essen Reaction
 
2005 tc c-tc-met-jn6316
2005 tc c-tc-met-jn63162005 tc c-tc-met-jn6316
2005 tc c-tc-met-jn6316
 
Theoretical and Applied Phase-Field: Glimpses of the activities in India
Theoretical and Applied Phase-Field: Glimpses of the activities in IndiaTheoretical and Applied Phase-Field: Glimpses of the activities in India
Theoretical and Applied Phase-Field: Glimpses of the activities in India
 
Dielectric Constant Measurement on Calcium and Lanthanum Doped Triglycine Sul...
Dielectric Constant Measurement on Calcium and Lanthanum Doped Triglycine Sul...Dielectric Constant Measurement on Calcium and Lanthanum Doped Triglycine Sul...
Dielectric Constant Measurement on Calcium and Lanthanum Doped Triglycine Sul...
 
Lattice Parameters and Debye Temperature of Naclx Nabry-X Kcl1-Y Ternary Mixe...
Lattice Parameters and Debye Temperature of Naclx Nabry-X Kcl1-Y Ternary Mixe...Lattice Parameters and Debye Temperature of Naclx Nabry-X Kcl1-Y Ternary Mixe...
Lattice Parameters and Debye Temperature of Naclx Nabry-X Kcl1-Y Ternary Mixe...
 
Phase-field modeling of crystal nucleation: Comparison with simulations and e...
Phase-field modeling of crystal nucleation: Comparison with simulations and e...Phase-field modeling of crystal nucleation: Comparison with simulations and e...
Phase-field modeling of crystal nucleation: Comparison with simulations and e...
 
RSC ADV Prashant 6th paper (1)
RSC ADV Prashant 6th paper (1)RSC ADV Prashant 6th paper (1)
RSC ADV Prashant 6th paper (1)
 
Nucleation III: Phase-field crystal modeling of nucleation process
Nucleation III: Phase-field crystal modeling of nucleation processNucleation III: Phase-field crystal modeling of nucleation process
Nucleation III: Phase-field crystal modeling of nucleation process
 
Global-12
Global-12Global-12
Global-12
 
Diopside hu y_pd
Diopside hu y_pdDiopside hu y_pd
Diopside hu y_pd
 
Growth and characterization of some ternary chalcopyrite from the group AlBll...
Growth and characterization of some ternary chalcopyrite from the group AlBll...Growth and characterization of some ternary chalcopyrite from the group AlBll...
Growth and characterization of some ternary chalcopyrite from the group AlBll...
 
2000 guerman-pyrochemistry technetium
2000 guerman-pyrochemistry technetium2000 guerman-pyrochemistry technetium
2000 guerman-pyrochemistry technetium
 
Study on Ni 0.5-X Znx Cu0.5 Fe2 O4 Sintered Ferrite System Using Xrd & High F...
Study on Ni 0.5-X Znx Cu0.5 Fe2 O4 Sintered Ferrite System Using Xrd & High F...Study on Ni 0.5-X Znx Cu0.5 Fe2 O4 Sintered Ferrite System Using Xrd & High F...
Study on Ni 0.5-X Znx Cu0.5 Fe2 O4 Sintered Ferrite System Using Xrd & High F...
 
Phase-field modeling of crystal nucleation I: Fundamentals and methods
Phase-field modeling of crystal nucleation I: Fundamentals and methodsPhase-field modeling of crystal nucleation I: Fundamentals and methods
Phase-field modeling of crystal nucleation I: Fundamentals and methods
 
Dalton large MCE
Dalton large MCEDalton large MCE
Dalton large MCE
 
Phase transformation and volume collapse of sm bi under high pressure
Phase transformation and volume collapse of sm bi under high pressurePhase transformation and volume collapse of sm bi under high pressure
Phase transformation and volume collapse of sm bi under high pressure
 

Viewers also liked

F0373040048
F0373040048F0373040048
F0373040048theijes
 
B03710609
B03710609B03710609
B03710609theijes
 
Development of a Modified Rational Model for Flood Risk Assessment of Imo Sta...
Development of a Modified Rational Model for Flood Risk Assessment of Imo Sta...Development of a Modified Rational Model for Flood Risk Assessment of Imo Sta...
Development of a Modified Rational Model for Flood Risk Assessment of Imo Sta...theijes
 
Development of Aluminium Metal Matrix Composite Using Stir Casting Method
Development of Aluminium Metal Matrix Composite Using Stir Casting MethodDevelopment of Aluminium Metal Matrix Composite Using Stir Casting Method
Development of Aluminium Metal Matrix Composite Using Stir Casting Methodtheijes
 
Propulsion Selection and Analysis for Unmanned Aerial Vehicles for SAE Aero D...
Propulsion Selection and Analysis for Unmanned Aerial Vehicles for SAE Aero D...Propulsion Selection and Analysis for Unmanned Aerial Vehicles for SAE Aero D...
Propulsion Selection and Analysis for Unmanned Aerial Vehicles for SAE Aero D...theijes
 
A03720107
A03720107A03720107
A03720107theijes
 
H0366051058
H0366051058H0366051058
H0366051058theijes
 
A03660105
A03660105A03660105
A03660105theijes
 
Development of Fire Risk Assessment Procedure For The University Students' H...
	Development of Fire Risk Assessment Procedure For The University Students' H...	Development of Fire Risk Assessment Procedure For The University Students' H...
Development of Fire Risk Assessment Procedure For The University Students' H...theijes
 
The Status of Agricultural Equipment Fabrication Industry in Ekiti and Ondo S...
The Status of Agricultural Equipment Fabrication Industry in Ekiti and Ondo S...The Status of Agricultural Equipment Fabrication Industry in Ekiti and Ondo S...
The Status of Agricultural Equipment Fabrication Industry in Ekiti and Ondo S...theijes
 
Design Construction, Simulation and Testing of A 300W Wind-Powered Battery Ch...
Design Construction, Simulation and Testing of A 300W Wind-Powered Battery Ch...Design Construction, Simulation and Testing of A 300W Wind-Powered Battery Ch...
Design Construction, Simulation and Testing of A 300W Wind-Powered Battery Ch...theijes
 
G0365055060
G0365055060G0365055060
G0365055060theijes
 
F03702046053
F03702046053F03702046053
F03702046053theijes
 
K0366079085
K0366079085K0366079085
K0366079085theijes
 
Single Channel Speech De-noising Using Kernel Independent Component Analysis...
	Single Channel Speech De-noising Using Kernel Independent Component Analysis...	Single Channel Speech De-noising Using Kernel Independent Component Analysis...
Single Channel Speech De-noising Using Kernel Independent Component Analysis...theijes
 
Multidimensional Analysis Of The External Environment In The Strategic Netwo...
	Multidimensional Analysis Of The External Environment In The Strategic Netwo...	Multidimensional Analysis Of The External Environment In The Strategic Netwo...
Multidimensional Analysis Of The External Environment In The Strategic Netwo...theijes
 
Poverty Implications on Natural Disasters Occurrence in Nigeria
	Poverty Implications on Natural Disasters Occurrence in Nigeria	Poverty Implications on Natural Disasters Occurrence in Nigeria
Poverty Implications on Natural Disasters Occurrence in Nigeriatheijes
 
B0365015024
B0365015024B0365015024
B0365015024theijes
 
B037309012
B037309012B037309012
B037309012theijes
 

Viewers also liked (19)

F0373040048
F0373040048F0373040048
F0373040048
 
B03710609
B03710609B03710609
B03710609
 
Development of a Modified Rational Model for Flood Risk Assessment of Imo Sta...
Development of a Modified Rational Model for Flood Risk Assessment of Imo Sta...Development of a Modified Rational Model for Flood Risk Assessment of Imo Sta...
Development of a Modified Rational Model for Flood Risk Assessment of Imo Sta...
 
Development of Aluminium Metal Matrix Composite Using Stir Casting Method
Development of Aluminium Metal Matrix Composite Using Stir Casting MethodDevelopment of Aluminium Metal Matrix Composite Using Stir Casting Method
Development of Aluminium Metal Matrix Composite Using Stir Casting Method
 
Propulsion Selection and Analysis for Unmanned Aerial Vehicles for SAE Aero D...
Propulsion Selection and Analysis for Unmanned Aerial Vehicles for SAE Aero D...Propulsion Selection and Analysis for Unmanned Aerial Vehicles for SAE Aero D...
Propulsion Selection and Analysis for Unmanned Aerial Vehicles for SAE Aero D...
 
A03720107
A03720107A03720107
A03720107
 
H0366051058
H0366051058H0366051058
H0366051058
 
A03660105
A03660105A03660105
A03660105
 
Development of Fire Risk Assessment Procedure For The University Students' H...
	Development of Fire Risk Assessment Procedure For The University Students' H...	Development of Fire Risk Assessment Procedure For The University Students' H...
Development of Fire Risk Assessment Procedure For The University Students' H...
 
The Status of Agricultural Equipment Fabrication Industry in Ekiti and Ondo S...
The Status of Agricultural Equipment Fabrication Industry in Ekiti and Ondo S...The Status of Agricultural Equipment Fabrication Industry in Ekiti and Ondo S...
The Status of Agricultural Equipment Fabrication Industry in Ekiti and Ondo S...
 
Design Construction, Simulation and Testing of A 300W Wind-Powered Battery Ch...
Design Construction, Simulation and Testing of A 300W Wind-Powered Battery Ch...Design Construction, Simulation and Testing of A 300W Wind-Powered Battery Ch...
Design Construction, Simulation and Testing of A 300W Wind-Powered Battery Ch...
 
G0365055060
G0365055060G0365055060
G0365055060
 
F03702046053
F03702046053F03702046053
F03702046053
 
K0366079085
K0366079085K0366079085
K0366079085
 
Single Channel Speech De-noising Using Kernel Independent Component Analysis...
	Single Channel Speech De-noising Using Kernel Independent Component Analysis...	Single Channel Speech De-noising Using Kernel Independent Component Analysis...
Single Channel Speech De-noising Using Kernel Independent Component Analysis...
 
Multidimensional Analysis Of The External Environment In The Strategic Netwo...
	Multidimensional Analysis Of The External Environment In The Strategic Netwo...	Multidimensional Analysis Of The External Environment In The Strategic Netwo...
Multidimensional Analysis Of The External Environment In The Strategic Netwo...
 
Poverty Implications on Natural Disasters Occurrence in Nigeria
	Poverty Implications on Natural Disasters Occurrence in Nigeria	Poverty Implications on Natural Disasters Occurrence in Nigeria
Poverty Implications on Natural Disasters Occurrence in Nigeria
 
B0365015024
B0365015024B0365015024
B0365015024
 
B037309012
B037309012B037309012
B037309012
 

Similar to I0371048054

Phonon frequency spectrum through lattice dynamics and normal coordinate anal...
Phonon frequency spectrum through lattice dynamics and normal coordinate anal...Phonon frequency spectrum through lattice dynamics and normal coordinate anal...
Phonon frequency spectrum through lattice dynamics and normal coordinate anal...Alexander Decker
 
Microstructural and Dielectric Characterization of Sr doped Ba(Fe0.5Ta0.5)O3 ...
Microstructural and Dielectric Characterization of Sr doped Ba(Fe0.5Ta0.5)O3 ...Microstructural and Dielectric Characterization of Sr doped Ba(Fe0.5Ta0.5)O3 ...
Microstructural and Dielectric Characterization of Sr doped Ba(Fe0.5Ta0.5)O3 ...theijes
 
Ferroelectric domains,tensor pairs and magnetoelectric polarisability propert...
Ferroelectric domains,tensor pairs and magnetoelectric polarisability propert...Ferroelectric domains,tensor pairs and magnetoelectric polarisability propert...
Ferroelectric domains,tensor pairs and magnetoelectric polarisability propert...Alexander Decker
 
Structural and magnetic properties on F-doped LiVO2 with two-dimensional tria...
Structural and magnetic properties on F-doped LiVO2 with two-dimensional tria...Structural and magnetic properties on F-doped LiVO2 with two-dimensional tria...
Structural and magnetic properties on F-doped LiVO2 with two-dimensional tria...Yang Li
 
A study of micro structural, magnetic and electrical properties of La-Co-Sm n...
A study of micro structural, magnetic and electrical properties of La-Co-Sm n...A study of micro structural, magnetic and electrical properties of La-Co-Sm n...
A study of micro structural, magnetic and electrical properties of La-Co-Sm n...IJECEIAES
 
First principles study of electronic, elastic and thermal properties of b2 ty...
First principles study of electronic, elastic and thermal properties of b2 ty...First principles study of electronic, elastic and thermal properties of b2 ty...
First principles study of electronic, elastic and thermal properties of b2 ty...Alexander Decker
 
Ab Initio Study of the Electronic and Phonon Band Structure Of the Mixed Vale...
Ab Initio Study of the Electronic and Phonon Band Structure Of the Mixed Vale...Ab Initio Study of the Electronic and Phonon Band Structure Of the Mixed Vale...
Ab Initio Study of the Electronic and Phonon Band Structure Of the Mixed Vale...IOSR Journals
 
Rotation of transition metal ions under electric fields possible new supercon...
Rotation of transition metal ions under electric fields possible new supercon...Rotation of transition metal ions under electric fields possible new supercon...
Rotation of transition metal ions under electric fields possible new supercon...zhoutiege
 
Structural and magnetic characterization of rhombohedral Ga1.2Fe0.8O3 ceramic...
Structural and magnetic characterization of rhombohedral Ga1.2Fe0.8O3 ceramic...Structural and magnetic characterization of rhombohedral Ga1.2Fe0.8O3 ceramic...
Structural and magnetic characterization of rhombohedral Ga1.2Fe0.8O3 ceramic...Nan Wang
 
Collective modes in the CFL phase - New Journal of Physics 13 (2011) 055002
Collective modes in the CFL phase - New Journal of Physics 13 (2011) 055002Collective modes in the CFL phase - New Journal of Physics 13 (2011) 055002
Collective modes in the CFL phase - New Journal of Physics 13 (2011) 055002Roberto Anglani
 
Study of Boron Based Superconductivity and Effect of High Temperature Cuprate...
Study of Boron Based Superconductivity and Effect of High Temperature Cuprate...Study of Boron Based Superconductivity and Effect of High Temperature Cuprate...
Study of Boron Based Superconductivity and Effect of High Temperature Cuprate...IOSR Journals
 
Temperature characteristics of fiber optic gyroscope sensing coils
Temperature characteristics of fiber  optic gyroscope sensing coilsTemperature characteristics of fiber  optic gyroscope sensing coils
Temperature characteristics of fiber optic gyroscope sensing coilsKurbatov Roman
 
Nonplanar-Ion-acoustic-Waves-in-a-Relativistically-Degenerate-Quantum-Plasma
Nonplanar-Ion-acoustic-Waves-in-a-Relativistically-Degenerate-Quantum-PlasmaNonplanar-Ion-acoustic-Waves-in-a-Relativistically-Degenerate-Quantum-Plasma
Nonplanar-Ion-acoustic-Waves-in-a-Relativistically-Degenerate-Quantum-PlasmaShiv Arjun
 
The Population of the Galactic Center Filaments: Position Angle Distribution ...
The Population of the Galactic Center Filaments: Position Angle Distribution ...The Population of the Galactic Center Filaments: Position Angle Distribution ...
The Population of the Galactic Center Filaments: Position Angle Distribution ...Sérgio Sacani
 
A new universal formula for atoms, planets, and galaxies
A new universal formula for atoms, planets, and galaxiesA new universal formula for atoms, planets, and galaxies
A new universal formula for atoms, planets, and galaxiesIOSR Journals
 

Similar to I0371048054 (20)

gibson2001.pdf
gibson2001.pdfgibson2001.pdf
gibson2001.pdf
 
Phonon frequency spectrum through lattice dynamics and normal coordinate anal...
Phonon frequency spectrum through lattice dynamics and normal coordinate anal...Phonon frequency spectrum through lattice dynamics and normal coordinate anal...
Phonon frequency spectrum through lattice dynamics and normal coordinate anal...
 
Microstructural and Dielectric Characterization of Sr doped Ba(Fe0.5Ta0.5)O3 ...
Microstructural and Dielectric Characterization of Sr doped Ba(Fe0.5Ta0.5)O3 ...Microstructural and Dielectric Characterization of Sr doped Ba(Fe0.5Ta0.5)O3 ...
Microstructural and Dielectric Characterization of Sr doped Ba(Fe0.5Ta0.5)O3 ...
 
Ferroelectric domains,tensor pairs and magnetoelectric polarisability propert...
Ferroelectric domains,tensor pairs and magnetoelectric polarisability propert...Ferroelectric domains,tensor pairs and magnetoelectric polarisability propert...
Ferroelectric domains,tensor pairs and magnetoelectric polarisability propert...
 
Masters Poster Final Draft
Masters Poster Final DraftMasters Poster Final Draft
Masters Poster Final Draft
 
Structural and magnetic properties on F-doped LiVO2 with two-dimensional tria...
Structural and magnetic properties on F-doped LiVO2 with two-dimensional tria...Structural and magnetic properties on F-doped LiVO2 with two-dimensional tria...
Structural and magnetic properties on F-doped LiVO2 with two-dimensional tria...
 
A study of micro structural, magnetic and electrical properties of La-Co-Sm n...
A study of micro structural, magnetic and electrical properties of La-Co-Sm n...A study of micro structural, magnetic and electrical properties of La-Co-Sm n...
A study of micro structural, magnetic and electrical properties of La-Co-Sm n...
 
Global-10
Global-10Global-10
Global-10
 
First principles study of electronic, elastic and thermal properties of b2 ty...
First principles study of electronic, elastic and thermal properties of b2 ty...First principles study of electronic, elastic and thermal properties of b2 ty...
First principles study of electronic, elastic and thermal properties of b2 ty...
 
Ab Initio Study of the Electronic and Phonon Band Structure Of the Mixed Vale...
Ab Initio Study of the Electronic and Phonon Band Structure Of the Mixed Vale...Ab Initio Study of the Electronic and Phonon Band Structure Of the Mixed Vale...
Ab Initio Study of the Electronic and Phonon Band Structure Of the Mixed Vale...
 
Rotation of transition metal ions under electric fields possible new supercon...
Rotation of transition metal ions under electric fields possible new supercon...Rotation of transition metal ions under electric fields possible new supercon...
Rotation of transition metal ions under electric fields possible new supercon...
 
Structural and magnetic characterization of rhombohedral Ga1.2Fe0.8O3 ceramic...
Structural and magnetic characterization of rhombohedral Ga1.2Fe0.8O3 ceramic...Structural and magnetic characterization of rhombohedral Ga1.2Fe0.8O3 ceramic...
Structural and magnetic characterization of rhombohedral Ga1.2Fe0.8O3 ceramic...
 
Collective modes in the CFL phase - New Journal of Physics 13 (2011) 055002
Collective modes in the CFL phase - New Journal of Physics 13 (2011) 055002Collective modes in the CFL phase - New Journal of Physics 13 (2011) 055002
Collective modes in the CFL phase - New Journal of Physics 13 (2011) 055002
 
Study of Boron Based Superconductivity and Effect of High Temperature Cuprate...
Study of Boron Based Superconductivity and Effect of High Temperature Cuprate...Study of Boron Based Superconductivity and Effect of High Temperature Cuprate...
Study of Boron Based Superconductivity and Effect of High Temperature Cuprate...
 
Temperature characteristics of fiber optic gyroscope sensing coils
Temperature characteristics of fiber  optic gyroscope sensing coilsTemperature characteristics of fiber  optic gyroscope sensing coils
Temperature characteristics of fiber optic gyroscope sensing coils
 
Nonplanar-Ion-acoustic-Waves-in-a-Relativistically-Degenerate-Quantum-Plasma
Nonplanar-Ion-acoustic-Waves-in-a-Relativistically-Degenerate-Quantum-PlasmaNonplanar-Ion-acoustic-Waves-in-a-Relativistically-Degenerate-Quantum-Plasma
Nonplanar-Ion-acoustic-Waves-in-a-Relativistically-Degenerate-Quantum-Plasma
 
X26148161
X26148161X26148161
X26148161
 
The Population of the Galactic Center Filaments: Position Angle Distribution ...
The Population of the Galactic Center Filaments: Position Angle Distribution ...The Population of the Galactic Center Filaments: Position Angle Distribution ...
The Population of the Galactic Center Filaments: Position Angle Distribution ...
 
A new universal formula for atoms, planets, and galaxies
A new universal formula for atoms, planets, and galaxiesA new universal formula for atoms, planets, and galaxies
A new universal formula for atoms, planets, and galaxies
 
R4201124128
R4201124128R4201124128
R4201124128
 

Recently uploaded

Kuwait City MTP kit ((+919101817206)) Buy Abortion Pills Kuwait
Kuwait City MTP kit ((+919101817206)) Buy Abortion Pills KuwaitKuwait City MTP kit ((+919101817206)) Buy Abortion Pills Kuwait
Kuwait City MTP kit ((+919101817206)) Buy Abortion Pills Kuwaitjaanualu31
 
HOA1&2 - Module 3 - PREHISTORCI ARCHITECTURE OF KERALA.pptx
HOA1&2 - Module 3 - PREHISTORCI ARCHITECTURE OF KERALA.pptxHOA1&2 - Module 3 - PREHISTORCI ARCHITECTURE OF KERALA.pptx
HOA1&2 - Module 3 - PREHISTORCI ARCHITECTURE OF KERALA.pptxSCMS School of Architecture
 
Moment Distribution Method For Btech Civil
Moment Distribution Method For Btech CivilMoment Distribution Method For Btech Civil
Moment Distribution Method For Btech CivilVinayVitekari
 
Thermal Engineering Unit - I & II . ppt
Thermal Engineering  Unit - I & II . pptThermal Engineering  Unit - I & II . ppt
Thermal Engineering Unit - I & II . pptDineshKumar4165
 
DC MACHINE-Motoring and generation, Armature circuit equation
DC MACHINE-Motoring and generation, Armature circuit equationDC MACHINE-Motoring and generation, Armature circuit equation
DC MACHINE-Motoring and generation, Armature circuit equationBhangaleSonal
 
Computer Lecture 01.pptxIntroduction to Computers
Computer Lecture 01.pptxIntroduction to ComputersComputer Lecture 01.pptxIntroduction to Computers
Computer Lecture 01.pptxIntroduction to ComputersMairaAshraf6
 
Thermal Engineering -unit - III & IV.ppt
Thermal Engineering -unit - III & IV.pptThermal Engineering -unit - III & IV.ppt
Thermal Engineering -unit - III & IV.pptDineshKumar4165
 
Unit 4_Part 1 CSE2001 Exception Handling and Function Template and Class Temp...
Unit 4_Part 1 CSE2001 Exception Handling and Function Template and Class Temp...Unit 4_Part 1 CSE2001 Exception Handling and Function Template and Class Temp...
Unit 4_Part 1 CSE2001 Exception Handling and Function Template and Class Temp...drmkjayanthikannan
 
Hospital management system project report.pdf
Hospital management system project report.pdfHospital management system project report.pdf
Hospital management system project report.pdfKamal Acharya
 
Orlando’s Arnold Palmer Hospital Layout Strategy-1.pptx
Orlando’s Arnold Palmer Hospital Layout Strategy-1.pptxOrlando’s Arnold Palmer Hospital Layout Strategy-1.pptx
Orlando’s Arnold Palmer Hospital Layout Strategy-1.pptxMuhammadAsimMuhammad6
 
Design For Accessibility: Getting it right from the start
Design For Accessibility: Getting it right from the startDesign For Accessibility: Getting it right from the start
Design For Accessibility: Getting it right from the startQuintin Balsdon
 
Wadi Rum luxhotel lodge Analysis case study.pptx
Wadi Rum luxhotel lodge Analysis case study.pptxWadi Rum luxhotel lodge Analysis case study.pptx
Wadi Rum luxhotel lodge Analysis case study.pptxNadaHaitham1
 
COST-EFFETIVE and Energy Efficient BUILDINGS ptx
COST-EFFETIVE  and Energy Efficient BUILDINGS ptxCOST-EFFETIVE  and Energy Efficient BUILDINGS ptx
COST-EFFETIVE and Energy Efficient BUILDINGS ptxJIT KUMAR GUPTA
 
Online electricity billing project report..pdf
Online electricity billing project report..pdfOnline electricity billing project report..pdf
Online electricity billing project report..pdfKamal Acharya
 
Unleashing the Power of the SORA AI lastest leap
Unleashing the Power of the SORA AI lastest leapUnleashing the Power of the SORA AI lastest leap
Unleashing the Power of the SORA AI lastest leapRishantSharmaFr
 
Tamil Call Girls Bhayandar WhatsApp +91-9930687706, Best Service
Tamil Call Girls Bhayandar WhatsApp +91-9930687706, Best ServiceTamil Call Girls Bhayandar WhatsApp +91-9930687706, Best Service
Tamil Call Girls Bhayandar WhatsApp +91-9930687706, Best Servicemeghakumariji156
 
GEAR TRAIN- BASIC CONCEPTS AND WORKING PRINCIPLE
GEAR TRAIN- BASIC CONCEPTS AND WORKING PRINCIPLEGEAR TRAIN- BASIC CONCEPTS AND WORKING PRINCIPLE
GEAR TRAIN- BASIC CONCEPTS AND WORKING PRINCIPLEselvakumar948
 

Recently uploaded (20)

Kuwait City MTP kit ((+919101817206)) Buy Abortion Pills Kuwait
Kuwait City MTP kit ((+919101817206)) Buy Abortion Pills KuwaitKuwait City MTP kit ((+919101817206)) Buy Abortion Pills Kuwait
Kuwait City MTP kit ((+919101817206)) Buy Abortion Pills Kuwait
 
Call Girls in South Ex (delhi) call me [🔝9953056974🔝] escort service 24X7
Call Girls in South Ex (delhi) call me [🔝9953056974🔝] escort service 24X7Call Girls in South Ex (delhi) call me [🔝9953056974🔝] escort service 24X7
Call Girls in South Ex (delhi) call me [🔝9953056974🔝] escort service 24X7
 
HOA1&2 - Module 3 - PREHISTORCI ARCHITECTURE OF KERALA.pptx
HOA1&2 - Module 3 - PREHISTORCI ARCHITECTURE OF KERALA.pptxHOA1&2 - Module 3 - PREHISTORCI ARCHITECTURE OF KERALA.pptx
HOA1&2 - Module 3 - PREHISTORCI ARCHITECTURE OF KERALA.pptx
 
Moment Distribution Method For Btech Civil
Moment Distribution Method For Btech CivilMoment Distribution Method For Btech Civil
Moment Distribution Method For Btech Civil
 
Thermal Engineering Unit - I & II . ppt
Thermal Engineering  Unit - I & II . pptThermal Engineering  Unit - I & II . ppt
Thermal Engineering Unit - I & II . ppt
 
DC MACHINE-Motoring and generation, Armature circuit equation
DC MACHINE-Motoring and generation, Armature circuit equationDC MACHINE-Motoring and generation, Armature circuit equation
DC MACHINE-Motoring and generation, Armature circuit equation
 
Computer Lecture 01.pptxIntroduction to Computers
Computer Lecture 01.pptxIntroduction to ComputersComputer Lecture 01.pptxIntroduction to Computers
Computer Lecture 01.pptxIntroduction to Computers
 
Thermal Engineering -unit - III & IV.ppt
Thermal Engineering -unit - III & IV.pptThermal Engineering -unit - III & IV.ppt
Thermal Engineering -unit - III & IV.ppt
 
Unit 4_Part 1 CSE2001 Exception Handling and Function Template and Class Temp...
Unit 4_Part 1 CSE2001 Exception Handling and Function Template and Class Temp...Unit 4_Part 1 CSE2001 Exception Handling and Function Template and Class Temp...
Unit 4_Part 1 CSE2001 Exception Handling and Function Template and Class Temp...
 
Hospital management system project report.pdf
Hospital management system project report.pdfHospital management system project report.pdf
Hospital management system project report.pdf
 
Orlando’s Arnold Palmer Hospital Layout Strategy-1.pptx
Orlando’s Arnold Palmer Hospital Layout Strategy-1.pptxOrlando’s Arnold Palmer Hospital Layout Strategy-1.pptx
Orlando’s Arnold Palmer Hospital Layout Strategy-1.pptx
 
Design For Accessibility: Getting it right from the start
Design For Accessibility: Getting it right from the startDesign For Accessibility: Getting it right from the start
Design For Accessibility: Getting it right from the start
 
Cara Menggugurkan Sperma Yang Masuk Rahim Biyar Tidak Hamil
Cara Menggugurkan Sperma Yang Masuk Rahim Biyar Tidak HamilCara Menggugurkan Sperma Yang Masuk Rahim Biyar Tidak Hamil
Cara Menggugurkan Sperma Yang Masuk Rahim Biyar Tidak Hamil
 
Integrated Test Rig For HTFE-25 - Neometrix
Integrated Test Rig For HTFE-25 - NeometrixIntegrated Test Rig For HTFE-25 - Neometrix
Integrated Test Rig For HTFE-25 - Neometrix
 
Wadi Rum luxhotel lodge Analysis case study.pptx
Wadi Rum luxhotel lodge Analysis case study.pptxWadi Rum luxhotel lodge Analysis case study.pptx
Wadi Rum luxhotel lodge Analysis case study.pptx
 
COST-EFFETIVE and Energy Efficient BUILDINGS ptx
COST-EFFETIVE  and Energy Efficient BUILDINGS ptxCOST-EFFETIVE  and Energy Efficient BUILDINGS ptx
COST-EFFETIVE and Energy Efficient BUILDINGS ptx
 
Online electricity billing project report..pdf
Online electricity billing project report..pdfOnline electricity billing project report..pdf
Online electricity billing project report..pdf
 
Unleashing the Power of the SORA AI lastest leap
Unleashing the Power of the SORA AI lastest leapUnleashing the Power of the SORA AI lastest leap
Unleashing the Power of the SORA AI lastest leap
 
Tamil Call Girls Bhayandar WhatsApp +91-9930687706, Best Service
Tamil Call Girls Bhayandar WhatsApp +91-9930687706, Best ServiceTamil Call Girls Bhayandar WhatsApp +91-9930687706, Best Service
Tamil Call Girls Bhayandar WhatsApp +91-9930687706, Best Service
 
GEAR TRAIN- BASIC CONCEPTS AND WORKING PRINCIPLE
GEAR TRAIN- BASIC CONCEPTS AND WORKING PRINCIPLEGEAR TRAIN- BASIC CONCEPTS AND WORKING PRINCIPLE
GEAR TRAIN- BASIC CONCEPTS AND WORKING PRINCIPLE
 

I0371048054

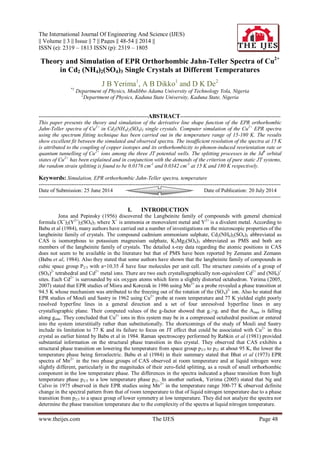
  • 1. The International Journal Of Engineering And Science (IJES) || Volume || 3 || Issue || 7 || Pages || 48-54 || 2014 || ISSN (e): 2319 – 1813 ISSN (p): 2319 – 1805 www.theijes.com The IJES Page 48 Theory and Simulation of EPR Orthorhombic Jahn-Teller Spectra of Cu2+ in Cd2 (NH4)2(SO4)3 Single Crystals at Different Temperatures J B Yerima1 , A B Dikko1 and D K De2 *1 Department of Physics, Modibbo Adama University of Technology Yola, Nigeria 2 Department of Physics, Kaduna State University, Kaduna State, Nigeria -------------------------------------------------------------ABSTRACT-------------------------------------------------------- This paper presents the theory and simulation of the derivative line shape function of the EPR orthorhombic Jahn-Teller spectra of Cu2+ in Cd2(NH4)2(SO4)3 single crystals. Computer simulation of the Cu2+ EPR spectra using the spectrum fitting technique has been carried out in the temperature range of 15-180 K. The results show excellent fit between the simulated and observed spectra. The insufficient resolution of the spectra at 15 K is attributed to the coupling of copper isotopes and its orthorhombicity to phonon-induced reorientation rate or quantum tunnelling of Cu2+ ions among the three JT potential wells. The splitting processes in the 3d9 orbital states of Cu2+ has been explained and in conjunction with the demands of the criterion of pure static JT systems, the random strain splitting is found to be 0.0176 cm-1 and 0.0342 cm-1 at 15 K and 180 K respectively. Keywords: Simulation, EPR orthorhombic Jahn-Teller spectra, temperature --------------------------------------------------------------------------------------------------------------------------------------- Date of Submission: 25 June 2014 Date of Publication: 20 July 2014 --------------------------------------------------------------------------------------------------------------------------------------- I. INTRODUCTION Jona and Pepinsky (1956) discovered the Langbeinite family of compounds with general chemical formula (X+ )2(Y2+ )2(SO4)3 where X+ is ammonia or monovalent metal and Y2+ is a divalent metal. According to Babu et al (1984), many authors have carried out a number of investigations on the microscopic properties of the langbeinite family of crystals. The compound cadmium ammonium sulphate, Cd2(NH4)2(SO4)3 abbreviated as CAS is isomorphous to potassium magnesium sulphate, K2Mg2(SO4)3 abbreviated as PMS and both are members of the langbeinite family of crystals. The detailed x-ray data regarding the atomic positions in CAS does not seem to be available in the literature but that of PMS have been reported by Zemann and Zemann (Babu et al, 1984). Also they stated that some authors have shown that the langbeinite family of compounds in cubic space group P2/3 with a=10.35 have four molecules per unit cell. The structure consists of a group of (SO4)2- tetrahedral and Cd2+ metal ions. There are two each crystallographically non-equivalent Cd2+ and (NH4)+ sites. Each Cd2+ is surrounded by six oxygen atoms which form a slightly distorted octahedron. Yerima (2005, 2007) stated that EPR studies of Misra and Korezak in 1986 using Mn2+ as a probe revealed a phase transition at 94.5 K whose mechanism was attributed to the freezing out of the rotation of the (SO4)2- ion. Also he stated that EPR studies of Mouli and Sastry in 1962 using Cu2+ probe at room temperature and 77 K yielded eight poorly resolved hyperfine lines in a general direction and a set of four unresolved hyperfine lines in any crystallographic plane. Their computed values of the g-factor showed that g//>gᗮ and that the Amax is falling along gmin. They concluded that Cu2+ ions in this system may be in a compressed octahedral position or entered into the system interstitially rather than substitutionally. The shortcomings of the study of Mouli and Sastry include its limitation to 77 K and its failure to focus on JT effect that could be associated with Cu2+ in this crystal as earlier hinted by Babu et al in 1984. Raman spectroscopy performed by Rabkin et al (1981) provided substantial information on the structural phase transition in this crystal. They observed that CAS exhibits a structural phase transition on lowering the temperature from space group p2/3 to p21 at about 95 K, the lower the temperature phase being ferroelectric. Babu et al (1984) in their summary stated that Bhat et al (1973) EPR spectra of Mn2+ in the two phase groups of CAS observed at room temperature and at liquid nitrogen were slightly different, particularly in the magnitudes of their zero-field splitting, as a result of small orthorhombic component in the low temperature phase. The differences in the spectra indicated a phase transition from high temperature phase p2/3 to a low temperature phase p21. In another outlook, Yerima (2005) stated that Ng and Calvo in 1975 observed in their EPR studies using Mn2+ in the temperature range 300-77 K observed definite change in the spectral pattern from that of room temperature to that of liquid nitrogen temperature due to a phase transition from p2/3 to a space group of lower symmetry at low temperature. They did not analyze the spectra nor determine the phase transition temperature due to the complexity of the spectra at liquid nitrogen temperature.
  • 2. Theory and Simulation of EPR Orthorhombic Jahn-Teller Spectra... www.theijes.com The IJES Page 49 The study of phase transition in CAS using VO2- as a probe in the temperature range of 573-77 K showed a complex spectrum, in which Babu et al (1984) were unable to identify the phase transition temperature and they suggested that the lower temperature phase stabilizes at temperatures higher than 95 K. This was due to a local stabilization of the low symmetry phase by vandyl ions. They also found that the data of their experiment contained Cu2+ ion as contaminant and thus concluded that the complication in their results could have been due to a possible JT effect associated with Cu2+ ion in this crystal. Unfortunately, they did not carry out further investigation to establish or rule out the possibility of JT effect due to Cu2+ ion in this system. De (2010) said in order to ascertain JT effect of Cu2+ in CAS Oguama carried out detailed EPR study of Cu2+ doped in CAS at various temperatures in the range of 300-15 K with angular variations usually at steps of 5o and 0.5o near JT extrema points in three mutually perpendicular planes of CAS single crystals. The Cu2+ :CAS spectra consists of finely resolved hyperfine lines in the low magnetic field region at all temperatures except 15 K while those in the high magnetic field region are poorly resolved at high temperatures. The complex or insufficient resolved splitting patterns of the spectra constitute a major problem in the extraction of the relevant spectroscopic parameters (resonance frequency, coupling constants, linewidths) from the spectra as starting points in the computer simulation of the spectra. Therefore, a straightforward analysis is not possible in general (neither for the human expert nor for a conceivable computer expert system (kirste, 1992)). It is against this background, several methods (spectrum contraction or elimination hyperfine splitting constants, extraction of hyperfine splitting constants, correlation method, maximum method, significance plots and ‘’roll-up’’ transformation) have been employed in the analysis of high resolution EPR spectra (Kirste, 1992; Wu, 2006). These methods may be more or less useful in providing estimates for the hyperfine coupling constants. On the other hand, the set of relevant spectroscopic parameters extracted from the spectra can be verified by spectrum simulation and comparison with the experimental spectrum which is the method adapted in this paper. We have adapted the spectrum fitting because it is considered an indispensable component in any scheme automated spectrum analysis. Theory and Method of Computer Simulation of the Line Shape Function of Cu2+ in CAS The detailed procedure of the experiment for determining Cu2+ spectra in CAS is available in Oguama (1997) and De (2010). The Oguama (1997) spectra of Cu2+ in this system at various temperatures were acquired for the computer simulation. The expression for the line shape function required for the computer simulation of the EPR spectra is derived from the spin Hamiltonian as follows: Thus, if the magnetic field is oriented along z- direction (100) of one of the orthorhombic JT distortions of the Cu2+ in CAS, the field Hz sees the gz as well as gx, gy tensor axes simultaneously unlike non-JT ions, and the spin Hamiltonian Hs becomes for H along z, i.e. Hx=Hy=0. 1 The expectation values of the Zeeman interaction for Cu2+ can be deduced taking into consideration the tunnel splitting equations of d9 ions given by (Boatner and Reynolds, 1977) 2 where the terms with subscripts x or y in equation (1) vanishes i.e. Hx=Hy=0, etc. The effective Hamiltonian for Cu2+ is obtained by adding equations (2) bearing in mind the orthorhombic g and A tensors leading to 3 where 3 is the tunnel splitting. The knowledge of the ratio of the random strain splitting, , to the tunnel splitting, 3, tells us the type of JT effect present in the system in question. Considering the hyperfine interactions as perturbations up to second-order instead of a single transition between the non-JT Kramer’s doublet, we have three transitions for magnetic field parallel z direction (in the case of a single Cu2+ per unit cell in the static JT regime) for JT Kramer’s doublet as follows (assuming that the principal axis of the g-tensor ellipsoid coincides, in orientation, with the principal axes of the hyperfine terms):
  • 3. Theory and Simulation of EPR Orthorhombic Jahn-Teller Spectra... www.theijes.com The IJES Page 50 4 5 6 Now considering only the first order terms in equations 4-6 the function describing line shapes in a non-JT complex for H along any g direction may be given by V . Thus, following the theory of the orthorhombic JT complex and considering transitions in equations 4-6, the resultant line shape function will be simultaneously governed by three functions given by 7 8 9 Thus the expression for the derivative EPR line shape can be written as 10 where , , , with ωT(=1,2,3) being the peak-to-peak linewidth (ΔHpp). Finally integrating equation (10), the derivative line shape function of EPR spectra of Cu2+ manifesting static JT effect with orthorhombic g and A tensors in CAS is given by 11 where , α is the fractional relative abundance of copper isotopes α(Cu63 ) = 0.69 and α(Cu65 ) = 0.31 ; gx, gy, gz are g-factors along the x-, y- , and z-axes respectively; H is the applied magnetic field; Ax, Ay, Az are the hyperfine constants in the x-, y-, and z-axes respectively; R1, R2, R3 are the linewidth parameters in the x-, y-, and z-axes respectively; MI=-3/2, - 1/2, 1/2, 3/2 and β is the Bohr magneton. The terms in the curly brackets represent the magnification factor of the line shape while the terms in square brackets determine the shape of the EPR line. The spectra of Cu2+ in CAS at low temperatures consists of three sets of four resolved hyperfine lines in both the g// and gᗮ directions. This implies that at the point of inflection the derivative line shape function is zero or cuts the H-axis four times in each of the three sets of four resolved lines. Thus the values of H corresponding to the points of inflection or zero F(H) can be determined. This means that the terms in square brackets must be zero i.e. . Using two values of H(H1 and H2) and corresponding to inflection points where F(H)=0, the corresponding expression for hyperfine constants is given by where n is the number of complete resolved hyperfine lines and n-1 gives the number of hyperfine constants. For example, for Cu63 and so that which is equivalent to n = 4.
  • 4. Theory and Simulation of EPR Orthorhombic Jahn-Teller Spectra... www.theijes.com The IJES Page 51 On the other hand, generally the g values are obtained by noting the middle field point Hmf of the hyperfine lines corresponding to and and using the relation . The calculated A and g values and estimated value of peak-to-peak linewidths (i=x,y,z) were used as starting points in the computer simulation process. These values of g, A and were substituted in the expression of F(H) and the resulting line shape was compared or matched with observed EPR line. The values of g, A and were varied by small amounts in the ranges ±0.005-0.01, ±0.5-1 G, and ±5-10 G respectively around the initial values until the line that best fits the observed EPR line was obtained. The presence of M-shape at the first crest and W-shape at the last trough corresponding to g// lines are assumed to be due to coupling between Cu63 and Cu65 isotopes at low temperatures (Yerima, 2007). Now, if Cu63 was the only one present in the sample of CAS we would expect only one set of four finely resolved hyperfine g// lines corresponding to MI=-3/2, -1/2, 1/2, 3/2 as opposed to six lines for only Cu65 (MI = -5/2, -3/2, -1/2, 1/2, 3/2, 5/2) present. If the two copper isotopes coexist, they couple with one another giving rise to poor resolution in the form of M-shape and W- shapes as observed at the beginning and end of the g// lines. In this case, the isotope effect is taken into account in search for the best line of fit using computer simulation. The effective values of g, A and corresponding to the simulated EPR lines of Cu2+ in CAS at different temperatures were recorded. However, the effect of isotope is neglected by setting α=1 where there are no M-and W-shapes present in the EPR spectra. Results and discussion
  • 5. Theory and Simulation of EPR Orthorhombic Jahn-Teller Spectra... www.theijes.com The IJES Page 52 Fig. 1 Observed (solid lines) and simulated (dashed lines) spectra of Cu2+ :CAS at different temperatures The EPR spectra of Cu2+ in CAS (Fig. 1), in an ac plane, show three groups of four resolved hyperfine lines in such a way that one set appeared at the low magnetic field and the remaining two at high magnetic field. The high resolution of the spectra in the high magnetic field region at 15 K results to reduction in broadening due to spin lattice relaxation time. The solid lines represent the observed spectra while the dashed lines are the simulated spectra. The complete anisotropic spectra of the hyperfine lines in the temperature range (15≤T≤180 K) has been attributed to phonon-induced reorientation rate or quantum tunnelling of the Cu2+ ions among the three JT Table 1 Observed and simulated g, A and ΔHpp values T (K) gz gx gy g<111> Az (G) Ax(G) Ay(G) A<111> (G) ΔHpp (G) 15 2.415 2.416 2.144 2.136 2.094 2.093 2.222 2.214 104 102 20 20 17 16 62 62 12.0 12.0 80 2.401 2.397 2.150 2.148 2.101 2.101 2.221 2.220 96 95 12 ** * ** 56 ** 12.0 12.0 100 2.393 2.393 2.151 2.149 2.103 2.105 2.219 2.219 94 93 * ** * ** * ** 14.0 14.2 120 2.384 2.380 * ** * ** * ** 91 92 * ** * ** * ** 16.0 16.3 140 2.370 2.367 * ** * ** * ** 88 88 * ** * ** * ** 20.0 19.8 180 2.353 2.348 * ** * ** * ** 80 80 * ** * ** * ** 24.0 24.8 where bold face values represent simulated values, * and ** represent missing observed and simulated values respectively. (a)
  • 6. Theory and Simulation of EPR Orthorhombic Jahn-Teller Spectra... www.theijes.com The IJES Page 53 (b) Fig. 2 Variation of observed and simulated (a) g-values and (b) A-values with temperature potential wells and Cu2+ ions would then stabilize statistically among the three JT wells (Yerima and De, 2014). The observed and simulated values of the hyperfine coupling constant (A), g-factor (g) and peak-to-peak linewidth (ΔHpp) at various temperatures are recorded in Table 1. The results show that Az and gz measured in the parallel direction of the magnetic field decrease with temperature while g⊥(gx,gy) and A⊥(Ax,Ay) increase with temperature. The main difficulty in computer assisted structure elucidation consists in the extraction of the relevant spectroscopic parameters such as resonance frequency, coupling constants and linewidths from the spectra. In this study, this problem has not been solved in totality because of highly complex or insufficiently resolved splitting of the g⊥ lines of Cu2+ :CAS EPR spectra at high temperatures. However, the complete resolution of the hyperfine lines has provided reliable information that the number of equivalent nuclei in this system is three resulting to the four hyperfine lines of intensity ratios 1:3:3:1 in each of the three groups of four hyperfine lines. Free ion ground Crystal field Vibronic Strain’s Zeeman Term splitting coupling splitting splittimg Fig. 3 Various splitting processes of 2 D ground state of cu2+ Fig. 3 shows the representation of the effects of the cubic crystal field, vibronic coupling, strain splitting, and Zeeman interaction on a 2 D electronic state. Allowed ΔMs=±1, ΔMI=0 EPR transitions are indicated by straight arrows at the right hand side of the Figure. Curved arrows correspond to vibronic relaxation effects which can produce an isotropic spectrum by averaging a portion of the strained-broadened resonance pattern. A host of authors (Reynolds and Boatner, 1975; Boatner and Reynolds, 1977) have shown that for pure static JT systems like Cu2+ :CAS, the ratio of the random strain splitting to the tunnel splitting is greater than 5 i.e. . Thus, for the residual linewidth, ΔHpp=12 G and g=2.415 at 15 K,
  • 7. Theory and Simulation of EPR Orthorhombic Jahn-Teller Spectra... www.theijes.com The IJES Page 54 and similarly at 180 K, ΔHPP=24 G and g=2.353, we have Thus increases with temperature and is far less than the average crystal splitting Δ=289.6 cm-1 (Yerima and De, 2014) computed from intensity and linewidth measurements. In the case of Cu2+ :CAS, the presence of M- and W-shapes at the beginning and end of the g// lines at low temperatures is attributed to the coupling of copper isotopes (copper 63(69%) and 65(31%)) (Yerima, 2007). The copper 63 ion has 3 equivalent protons while copper 65 ion has 4 which are expected to give 4 and 5 respectively resolved g⊥ or g// lines. At low temperatures, say 15 K, coupling of copper 65 ions becomes significant interacting with that of copper 63 ions giving rise to the M- and W-shapes. At high temperatures, copper 63 ions dominates giving rise to the four resolved g// lines and the g⊥ lines are insufficiently resolved (Fig. 1). CONCLUSION In this paper, the theoretical expression for the line shape function of the orthorhombic JT spectra of Cu2+ in CAS system have been reported. The spectra of Cu2+ :CAS were simulated by the aid of computer using spectrum fitting technique at various temperatures. The results show that the simulated spectra match excellently well with the observed spectra especially at the low field region where the hyperfine lines are sufficiently resolved. The splitting processes in the 3d9 orbital states of Cu2+ have been discussed. The criterion of pure static JT systems demands that the condition 5 must be satisfied, where and the random strain splitting was found to be about 0.0176 cm-1 at 15 K and 0.0342 cm-1 at 180 K. The insufficient resolution of the spectra especially at the high magnetic field side and temperatures is attributed to the rate of coupling of copper ions in this system. REFERENCES [1]. Babu D. S, Sastry G. S, Sastry M. D and Dalvi A. G. I (1984) Structural phase transition in Langbeinites an [2]. EPR study, j. Phys. C. Solid state Phys. 17, 4245 [3]. Boatner L. A, Reynolds R. W, Chen Y and Abraham M. M (1977) Static, quasistatic and quasidynamic Jahn Teller effect in EPR spectra of Ag+ SrO, CAO and MgO. Phys. Rev. B16, 1, 86 [4]. De D K (2010) First observation of orthorhombic Jahn-Teller EPR spectra in Cu II doped [5]. (NH4)2Cd2(SO4)3.6H2O single crystals, Paper I, African Physical review$:0011, 87 [6]. Jona F and Pepinsky R (1956) In low energy electron diffraction (LEED) spectra. Al. IBMJ. Res. Center, York Town [7]. Kirste B (1992) Methods of automated analysis and simulation of EPR spectra. Anal. Chim. Acta. 191-200, 265 [8]. Oguama F A (1997) EPR studies on the effect of magnetic Jahn-Teller and Jahn-Teller impurities on solid state [9]. phase transitions. Doc. Dessert. Wake Forest Uni. USA. [10]. Rabkin L. M, Torgashov V. I and Brezina B (1981) Ferroelectrics 36, 476 [11]. Reynolds R. W and Boatner L. A (1975) Dynamic, intermediate and static Jahn-Teller in the EPR spectra of 2 E [12]. orbital states. Phys. Rev B12, 4735 [13]. Wu H (2006) EPR spectra simulation of anisotropic ½ spin. Hanqing@csd.uwIII.edu. [14]. Yerima J. B (2005) EPR studies in the effect of paramagnetic impurities in phase transition and Jahn-Teller effect in crystalline solids: A review. Tech and Dev Journal,9 [15]. Yerima J. B (2007) EPR studies of the effect of paramagnetic impurity concentrations in phase transition and [16]. Jahn-Teller effect in crystalline solids. Doc. Dissert. FUTY, Nigeria [17]. Yerima J B and De D K (2014) Temperature Dependence of EPR Linewidth and Intensity in [18]. Cd2(NH4)2(SO4)3 single crystals, Vonuklang Multidisplinary Journal of Science and Technology, Vol 1, No.1