Obamacare in Pictures: Visualizing the Effects of the Patient Protection and Affordable Care Act
•
12 gefällt mir•86,737 views

“Obamacare in Pictures: Visualizing the Effects of the Patient Protection and Affordable Care Act” shows in detail the impact of the sweeping health care law for Americans.

Empfohlen
Empfohlen
Weitere ähnliche Inhalte
Was ist angesagt?
Was ist angesagt? (20)
Andere mochten auch
Ähnlich wie Obamacare in Pictures: Visualizing the Effects of the Patient Protection and Affordable Care Act
Ähnlich wie Obamacare in Pictures: Visualizing the Effects of the Patient Protection and Affordable Care Act (20)
Mehr von The Heritage Foundation
Mehr von The Heritage Foundation (20)
Kürzlich hochgeladen
Kürzlich hochgeladen (20)
Obamacare in Pictures: Visualizing the Effects of the Patient Protection and Affordable Care Act
- 1. Obamacare in Pictures VISUALIZING THE EFFECTS OF THE PATIENT PROTECTION AND AFFORDABLE CARE ACT Spring 2014
- 2. heritage.orgObamacare in PicturesSource: Associated Press, December 26, 2013. At least 4.7 million health care plans in the individual market have been discontinued due to new Obamacare rules. If you like your health care plan, can you really keep it? POLICIES SCHEDULED FOR CANCELLATION (THOUSANDS) 3.2 290 60 250 135 100 25 26 22 47 184 0.5 140 225 93 130 108185 105 1 400 333 327 1,100 5.4 90 WY WV WI WA VT VA UT TX TN SD SC RI PA OR OK OH NY NV NM 150NJ NH NE ND NC MT MS MO MN MI ME 73MD 21DC MA LA KYKS INIL ID IA HI GA FL 12DE 66CT CO CA AZ AR AK AL Data not available Cancelled plans switched automatically 0–10 10–100 100–200 200+
- 3. heritage.orgObamacare in PicturesSource: Towers Watson/NBGH Employer Survey on Purchasing Value in Health Care, 2013. Those with employer coverage might not be able to keep their existing plans either. The vast majority of businesses expect to make changes to their health care plans to comply with Obamacare’s regulations, and more than half of those anticipate the changes to be significant or drastic. BUSINESSES ANTICIPATING CHANGES TO THEIR EMPLOYER-SPONSORED HEALTH CARE BY 2018 Obamacare will require employers to make changes to their health care plans 0% 10% 20% 30% 40% 50% 3% 44% 45% 8% No change or small change Modest change Significant change Complete transformation
- 4. heritage.orgObamacare in PicturesSource: Heritage Foundation calculations using data from healthcare.gov and state-run exchanges, October 2013. Notes: Data for KY, HI, and MA unavailable at time of analysis. VA figure not available due to possible errors. Buying individual health insurance in the exchanges is generally more expensive than it was before Obamacare, especially for young adults. In 11 states, 27–year–olds will see premiums double or more. Premiums are higher in Obamacare exchanges: Age 27 26% 7% 99% 73% 144% n/a 75% 100% 59% 94% 20% 32% 55% 58% –2% –29% 2% 80% 1% 71% 113% 91% 43% 31% 54% 15% 118% 26% 106% n/a129% 34%114% 86% 12% n/a 168% 75% –30% 24% 157% 171% 73% 31% WY WV WI WA VT VA UT TX TN SD SC –28%RI PA OR OK OH NY NV NM –3%NJ NH NE ND NC MT MS MO MN MI ME 10%MD 1%DC n/aMA LA KYKS INIL ID IA HI GA FL 100%DE 64%CT CO CA AZ AR AK AL CHANGE IN PREMIUMS FOR 27–YEAR–OLDS Down 1% to 30% Up 0%–50% Up 51% to 100% Up 100%+
- 5. heritage.orgObamacare in PicturesSource: Heritage Foundation calculations using data from healthcare.gov and state-run exchanges, October 2013. Buying individual health insurance in the exchanges is generally more expensive than it was before Obamacare. In 13 states, 50–year–olds will see premiums rise by 50 percent or more. Premiums are higher in Obamacare exchanges: Age 50 15% 9% 64% 13% 61% n/a 26% 91% 32% 73% 33% 29% 7% 22% –2% –29% 50% 12% 5% 22% 96% 21% 31% 37% 39% 23% 43% 4% 44% n/a72% 81%43% 34% 13% n/a 71% 75% –26% 13% 42% 79% 46% 29% WY WV WI WA VT VA UT TX TN SD SC –16%RI PA OR OK OH NY NV NM –1%NJ NH NE ND NC MT MS MO MN MI ME 13%MD 53%DC n/aMA LA KYKS INIL ID IA HI GA FL 65%DE 75%CT CO CA AZ AR AK AL CHANGE IN PREMIUMS FOR 50–YEAR–OLDS Down 1% to 30% Up 0%–25% Up 26% to 50% Up 50%+ Notes: Data for KY, HI, and MA unavailable at time of analysis. VA figure not available due to possible errors.
- 6. heritage.orgObamacare in PicturesSource: Heritage Foundation calculations using data from healthcare.gov and state-run exchanges, October 2013. Buying individual health insurance in the exchanges is generally more expensive than it was before Obamacare. In 19 states, premiums for a family of four will increase by more than 10 percent. Premiums are higher in Obamacare exchanges: Family of four 4% 2% 19% 3% 18% n/a 7% 30% 9% 22% 9% 8% 2% 6% –0.4% –7% 0.8% 3% 1.3% 6% 32% 5% 8% 10% 11% 6% 12% 0.9% 12% n/a22% 26%12% 9% 7% n/a 21% 23% –6% 3% 12% 25% 13% 8% WY WV WI WA VT VA UT TX TN SD SC –4%RI PA OR OK OH NY NV NM –0.3%NJ NH NE ND NC MT MS MO MN MI ME 3%MD 15%DC n/aMA LA KYKS INIL ID IA HI GA FL 19%DE 23%CT CO CA AZ AR AK AL CHANGE IN PREMIUMS FOR A FAMILY OF FOUR Down 1% to 10% Up 0%–10% Up 11% to 20% Up 21%+ Notes: Data for KY, HI, and MA unavailable at time of analysis. VA figure not available due to possible errors.
- 7. heritage.orgObamacare in PicturesSources: Heritage Foundation calculations based on data from HHS and Kaiser Family Foundation Employer Health Benefits 2013 Annual Survey. Note: Those with incomes between 100% and 250% of FPL who purchase silver plans qualify for a separate cost-sharing reduction subsidy that reduces their deductible and other out-of-pocket expenses. In addition to premium costs, individuals must meet an annual deductible before coverage kicks in. Average individual deductibles in the 36 states with a federally run exchange are much higher than the average individual deductible for employer- sponsored plans in 2013. AVERAGE DEDUCTIBLE Many Obamacare exchange plans come with higher deductibles Catastrophic Bronze Silver (Standard) Gold Platinum Employer- sponsored insurance $6,346 $4,617 $2,756 $1,203 $390 $1,135
- 8. heritage.orgObamacare in PicturesSources: Heritage Foundation calculations using data from healthcare.gov and state-run exchanges, November 2013. More than half of U.S. counties have only one or two insurance carriers selling coverage in the Obamacare exchanges. This lack of competition means less choice for consumers and less market pressure to keep prices down. COUNTIES WITH LITTLE OR NO COMPETITION IN OBAMACARE EXCHANGES (% OF ALL COUNTIES) Lack of competition in Obamacare exchanges ■ Only 1 carrier (17%) ■ Only 2 carriers (35%)
- 9. $2 trillion $898 billion March 2010 estimate (six years of spending over 10 years) February 2014 estimate (10 years of spending over 10 years) heritage.orgObamacare in PicturesSource: Congressional Budget Office, March 2010 and February 2014. Initial estimates for Obamacare’s spending on the Medicaid expansion and exchange subsidies counted only six years of spending. A full 10–year cost reveals nearly $2 trillion in new spending by 2024. Obamacare’s new spending continues to grow
- 10. heritage.orgObamacare in PicturesSources: Heritage Foundation calculations based on data from the Congressional Budget Office, March 2012, and Medicaid and CHIP Payment Access Commission. In the vast majority of states, adopting the Medicaid expansion would require additional state spending. Obamacare’s Medicaid expansion burdens state budgets ESTIMATED STATE COSTS FOR MEDICAID EXPANSION, 2014–2022 (MILLIONS) $22 $176 $843 $547 $134 $284 $231 $1,402 $777 $61 $820 $1,374 $343 $319 $1,194 $7,694 $138 $331 $42 $157 $55 $891 $57 $312 $515 $724 $883 $332 $685 $370$85 $444$2,338 $61 $287 $326 U.S. total: $41.9 billion $583 $1,389 $156 $9,011 $2,805 $364 $63 $368 WY WV WI WA VT VA UT TX TN SD SC $107RI PA OR OK OH NY NV NM $5NJ NH NE ND NC MT MS MO MN MI ME $289MD $119DC $923MA LA KYKS INIL ID IA HI GA FL $164DE $335CT CO CA AZ AR AK AL $30–$99 $100–$499 $500–$999 $1,000–$1,999 $2,000–$9,100
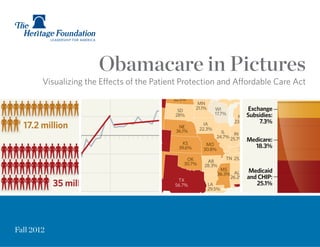
- 11. heritage.orgObamacare in PicturesSource: Congressional Budget Office, February 2014. In 2024, after 10 years of full implementation and nearly $2 trillion in new spending, 31 million people will likely remain uninsured. Those who do gain coverage will do so primarily through Obamacare exchanges or Medicaid. HEALTH COVERAGE IN 2024, WITH AND WITHOUT OBAMACAREMillions will remain uninsured under Obamacare Note: Figures have been rounded. UNINSURED MEDICAID OBAMACARE EXCHANGES n/a DOWN 25 UP 13 UP 24 56 31 34 47 24 million million million million million Without Obamacare With Obamacare Without Obamacare With Obamacare Without Obamacare With Obamacare million million million
- 12. heritage.orgObamacare in PicturesSources: Heritage Foundation calculations based on data from Congressional Budget Office, May 2013, and Joint Committee on Taxation, June 2012. Obamacare includes 18 new taxes, fees, and penalties, costing taxpayers an estimated $771 billion by 2022. OBAMACARE TAXES IN BILLIONS OF NOMINAL DOLLARS Obamacare’s 18 new taxes and penalties $0 $20 $40 $60 $80 $100 $120 2013 2014 2015 2016 2017 2018 2019 2020 2021 2022 Increase in Medicare payroll tax and application to investment income for high earners Individual and employer mandates Health insurance tax Tax on “Cadillac” plans Fee on pharmaceutical companies Fee on medical device manufacturers All other taxes Note: The total amount of tax revenue collected from the individual mandate, employer mandate (excluding collections in 2015 because of the July 2013 delay), and 40 percent excise tax on high-cost health plans are from the CBO’s May 2013 estimates. For the remaining taxes, the revenue projections are from the Joint Committee on Taxation’s 2012 estimates.
- 13. heritage.orgObamacare in PicturesSource: Congressional Budget Office, June 2012. Nearly 70 percent of those projected to pay the Obamacare individual mandate tax earn less than 400 percent of the federal poverty level (FPL) ($45,960 for a single individual in 2013), and 10 percent live in poverty. Who pays the Obamacare individual mandate tax? 0% 25% 50% 75% BELOW 400% FPL ABOVE 400% FPL 31% 69% Below Poverty Line 10% 100%–200% FPL 21% 200%–300% FPL 20% 300%–400% FPL 18% 400%–500% FPL 11% More Than 500% FPL 20%
- 14. heritage.orgObamacare in PicturesSource: Congressional Budget Office, July 2012. Projected Medicare savings from Obamacare do not improve the program’s long-term solvency. Most of the savings are redirected to fund new Obamacare spending. CUTS IN MEDICARE DUE TO OBAMACARE, 2013–2022Obamacare cuts Medicare payments to fund other new programs * Disproportionate Share Hospital, meaning supplemental payments that go to hospitals that serve a large number of low-income patients. $0 $50 $100 $150 $200 $250 billion Hospital services Payment rates in Medicare Advantage DSH* payments, other Medicare provisions Home health services Skilled nursing services All other services Hospice services $260 billion $156 billion $145 billion $66 billion $39 billion $33 billion $17 billion Obamacare cuts $716 billion from Medicare
- 15. PERCENTAGE OF HOSPITALS, SKILLED NURSING FACILITIES, AND HOME HEALTH AGENCIES PROJECTED TO OPERATE AT A LOSS 0% 5% 10% 15% 20% 25% 30% 35% 40% 45% 15% 25% 40% 2019 2030 2050 heritage.orgObamacare in PicturesSource: Medicare trustees 2013 report. By cutting Medicare payments instead of introducing real reform, the health care law jeopardizes seniors’ access to providers. According to the Medicare trustees, Obamacare’s scheduled reductions to provider payments will cause Medicare’s payments for health services to fall further below providers’ costs. This will cause providers to either withdraw from serving Medicare beneficiaries or shift more costs to their patients with private coverage. Obamacare’s Medicare cuts will result in severe access problems for seniors
- 16. heritage.orgObamacare in PicturesNote: Figures shown are the first poll average in each month. Source: Real Clear Politics, “Public Approval of Health Care Law,” March 2014. Opposition to Obamacare has hovered around 50 percent since early 2010. Over the past year, the law has grown even more unpopular. POLL AVERAGE, BY MONTH Obamacare remains unpopular 30% 40% 50% 60% AGAINST/OPPOSE FOR/FAVOR Jan. 2010 Jan. 2011 Jan. 2012 Jan. 2013 Jan. 2014