More Related Content
Similar to Urban rural disparity
Similar to Urban rural disparity (20)
Urban rural disparity
- 1. © TM Berheto, WK Mikitie, A Argaw, 2015. A licence to publish this material has been given to James Cook University, http://www.rrh.org.au
1
R E S E A R C H N O T E
Urban-rural disparities in the nutritional status of
school adolescent girls in the Mizan district, south-
western Ethiopia
TM Berheto1
, WK Mikitie2
, A Argaw1
1
School of Public Health, College of Health Sciences, Wolaita Sodo University, Sodo, Ethiopia
2
Department of Population and Family Health, Jimma University, Jimma, Ethiopia
Submitted: 14 February 2014; Revised: 25 February 2015; Accepted: 17 March 2015; Published: 30 July 2015
Berheto TM, Mikitie WK, Argaw A
Urban-rural disparities in the nutritional status of school adolescent girls in the Mizan district, south-western
Ethiopia
Rural and Remote Health 15: 2687. (Online) 2015
Available: http://www.rrh.org.au
A B S T R A C T
Introduction: Malnutrition that occurs during adolescence has important consequences for the future growth and development of
the individual, particularly in girls in developing countries. Besides limiting growth, adolescent malnutrition has important
consequences for society. Despite this, there is a lack of information on the nutritional status of adolescent girls in Ethiopia. This
study was therefore performed to help redress this lack of data and to provide information for future improvements by health
planners and policy makers.
Methods: A comparative cross-sectional study design was employed to determine the urban–rural disparity in nutritional status of
adolescent school girls in the Mizan district in south-western Ethiopia. A two-stage sampling procedure was used to randomly select
622 adolescent girls, 311 each from urban and rural locations. Trained field workers used structured questionnaires to obtain the
desired information from the respondents. Anthropometric measurements of height and weight were collected using standard
procedures and appropriate quality control measures. Height-for-age Z-scores and body mass index (BMI)-for-age Z-scores were
generated using AnthroPlus software. The independent sample t-test and χ2
test were used to determine statistical significance.
Results: There were no significant differences in the ages or physical activities of the two populations of girls studied.
Consumption of cereal, vegetables, sweets, sugars, fats, meat, and eggs was similar between the two groups, although slight
differences were found with regard to legumes, milk, and fruit consumption. No significant differences were found in the
prevalence of mild underweight girls and overweight girls in the urban and rural groups (26.5% vs 22.3% and 7.5% vs 5.2%,
respectively). Significant stunting was, however, present in the rural population (40.9% vs. 17.8% in the urban group). Although
- 2. © TM Berheto, WK Mikitie, A Argaw, 2015. A licence to publish this material has been given to James Cook University, http://www.rrh.org.au
2
overall lower than the reference data provided by WHO, the mean BMI-for-age Z-scores and height-for-age Z-scores were
significantly higher in the urban girls than in their rural counterparts, with mean differences of 0.18 (95% confidence
interval (CI) 0.02–0.34) and 0.58 (95% CI 0.45–0.72), respectively.
Conclusions: Malnutrition was present in both urban and rural adolescent girls. The most obvious disparity between the two
populations was significant stunting in the rural population. There is therefore an urgent need for strategies to address severe
nutritional problems in rural adolescent girls and to improve the nutrition of adolescent girls within the urban environment.
Key words: adolescent girls, nutritional status, obesity, southwest Ethiopia, stunting, urban and rural disparity.
Introduction
Globally, there are more than 1.2 billion adolescents aged
10–19 years1,2
. Adolescence is one of the most dynamic
stages of development and is characterized by dramatic
physical and psychosocial changes in the individual3,4
. For
example, approximately 20%, 50%, and 45% of the final
adult height, weight, and bone mass, respectively, are
attained during this period1,5,6
. Such changes result in a peak
in nutritional requirements7,8
that exceeds that occurring
during the remaining lifetime3
. Deficits in nutrition during
this period not only impair growth, but also the personal
development of the individual1-3
, which will ultimately have a
wider impact on society.
In Ethiopia, in contrast to boys, girls often face a reduction in
freedom and opportunities during puberty6,9,10
. These
restrictions are frequently increased in rural parts of Ethiopia,
where more than 85% of the girls live8
and where work
burdens for adolescent girls are especially heavy11
. Puberty is
also a time when girls’ bodies prepare for the nutritional
demands of pregnancy and lactation required in later life12,13
.
As a result, girls are more prone to nutritional difficulties
than boys2
, and nutritional deficiencies experienced by a girl
during this period can affect the future health of the
individual and her offspring13,14
. Improving the nutritional
status of adolescent girls represents an important way of
breaking the intergenerational cycle of malnutrition5,14
.
Furthermore, such an investment in increasing the
opportunities of adolescent girls should have a positive impact
on their individual development and also help long-term
reductions in poverty1,2
.
Although Ethiopia is a country with an extremely young
population, very little is known about the nutritional status of
its adolescents15
. Demographic and health surveys on
adolescents aged 15 years and older are available, but
relatively few studies have been performed on younger
adolescents16,17
in Ethiopia. Such studies also lack information
obtained from both urban and rural environments. The
present study was, therefore, carried out to help address this
problem by obtaining information on the disparity in
nutritional status between adolescent girls aged 11–19 years
living within rural and urban communities in the Mizan
district, south-western Ethiopia. The results obtained should
provide important information for future planning to help
prevent malnutrition and also improve the development of
adolescent girls in Ethiopia.
Methods
Study setting and design
A cross-sectional comparative descriptive study design was
employed to assess urban–rural disparities in the nutritional
status of adolescent school girls in Mizan district. It is located
in the Bench-Maji zone in the Southern Regional State of
Ethiopia. This district has an estimated total population of
700 000; with 30% being urban residents. It is known for its
favorable agro-ecology, with year-round rainfall and one of
- 3. © TM Berheto, WK Mikitie, A Argaw, 2015. A licence to publish this material has been given to James Cook University, http://www.rrh.org.au
3
the lowest risks of food insecurity in Ethiopia. The people in
the rural parts are economically dependent on agricultural
products while the urban residents are mainly engaged in
market-oriented business activities and services18
. The study
area was selected purposively to fulfill the assumption
homogeneity in population pattern, in regards to culture,
ethnicity and agro-economy in the urban and rural setting. It
contains 29 schools, with female enrolment reaching 98% in
both the urban and rural setting during 2012. The present
survey was conducted in February 2012, corresponding to
the Ethiopian post-harvest season.
Sample size and sampling
A sample size calculation was performed using the
STATCALC program of EPI INFO v6.2 (Centers for Disease
Control and Prevention; http://wwwn.cdc.gov/epiinfo). A
total of 622 subjects (311 in each rural and urban study
group) were required to detect the previously identified 16%
urban–rural stunting prevalence disparity10
with a 95% level
of confidence, 90% power, a design effect of two, and with
10% allowance. Fifteen schools with grades 5 to 10 were
stratified into urban (seven schools) and rural (eight schools)
groups based on the governmental administrative structure.
Three schools were selected from each group using the
‘probability proportional to size’ method, and female
adolescents were selected randomly from the two settings.
Computer-generated random numbers were used to identify
study participants from the two sampling frames.
Data collection and measurement
Twelve female diploma nurses fluent in the local dialect
interviewed the adolescent girls using a pre-tested structured
questionnaire. The questionnaire included questions about
demographic characteristics, income, puberty, food security,
dietary practice, physical activity, and health-related
practices. The nurses received 5 days of intensive training
both in the classroom and as field practice. Due to its
sensitive nature in the study area, data on ethic background of
the children were not sought.
A four-item individual food security scale, developed and tested in
another study19
, was used to assess food security status. The
questions in the scale asked whether girls within the last month had
(1) ever worried about having enough food, (2) ever had to reduce
food intake because of shortage of food or lack of money to buy
food, (3) ever had to go without eating because of shortage of food
or money to buy food or (4) ever had to ask outside the home for
food. Food security status was determined as follows: girls were
‘food secure’ only when the responses for all the four items were
‘no’; otherwise, the girls were labeled as ‘food insecure’. The
dietary practice of subjects was assessed by asking about their usual
number of meals per day, the frequency of missed meals within
the last 2 weeks, and, finally, the usual frequency of consumption
for different food groups (cereals, legumes, fruits and vegetables,
milk and milk products, and meat and eggs).
Physical activity was assessed using the Adolescent Physical
Activity Recall Questionnaire (APARQ)20
but adapted to
include a list of common activities performed by adolescents
in Mizan. Girls were asked to estimate the frequency and
time spent doing the listed activities in a typical week. The
weight and height of each girl was taken by one of the
researchers using standard techniques and calibrated
equipment21
, with the subjects wearing school uniform and
no shoes. Weight was measured using a digital scale (SECA
876) to the nearest 100 g and height to the nearest 1 mm
using a statometer (SECA 225). The age of the girls was
confirmed from the school registers.
The socio-demographic information was collected to provide
a logical overview of the study population to link with the
results and interpretation of the data. This is because the
information was obtained from face-to-face interviews with
school children, which is not reliable for multivariate analysis.
Ethics approval
Ethics approval of the study protocol was obtained from the
ethics review board of Jimma University (RpGc/448/2012).
Consent was obtained from representatives of parents and
teachers in a group meeting where the purpose and nature of
- 4. © TM Berheto, WK Mikitie, A Argaw, 2015. A licence to publish this material has been given to James Cook University, http://www.rrh.org.au
4
the study was explained prior to the start of data collection.
Verbal assent from the selected adolescents was obtained.
zz
The data were analyzed using the Statistical Package for the Social
Sciences v16 (SPSS Inc., http://www.spss.com). Height-for-age
Z-scores (HAZ) and body mass index (BMI)-for-age Z-scores
(BAZ) were calculated using the WHO growth reference data for
adolescents (AnthroPlus v1.0.3; http://www.who.int/
growthref/tools/en). The prevalences of stunting and the
underweight category were calculated from the mean HAZ and
BAZ, respectively, using the cutoff point <–2 standard deviations
(SD). Overweight was considered as BAZ >+1SD22
. The mean
HAZ, BAZ, age at menarche, and gynecological age (age since
menarche) was also calculated. The urban–rural disparity in
nutritional status was tested using the Pearson χ2
test for
categorical data (stunting and BMI categories) and the independent
student t-test for continuous (mean HAZ, BAZ, and age at
menarche) data.
Results
Socio-demographic characteristics
The baseline characteristics of the adolescent girls studied are
shown in Table 1. Overall, 98.7% (614/622) of the
adolescent girls enrolled were included in the analysis, of
which 99% and 98.4% girls were from the urban and the
rural groups, respectively. The mean age of the girls was
14.4 (±2.0 SD) years, with approximately 49.5% (304/614)
aged 14–16 years. In the urban group, 34.4%, 50.3%, and
15.9% of the girls were aged 11–13, 14–16, and 17–
19 years, respectively. Similar results of 36.6%, 49.7%, and
13.7% were found for the same age ranges in the rural group.
These results showed that there was no significant difference
in the mean age (14.5±2.0 vs 14.3±2.0, p=0.25) of the girls
from the urban and rural study groups, respectively.
Fifty-nine percent of the girls were Orthodox Christian, 28%
were Protestant, and 12% were Muslim. There were no
statistically significant differences in distribution of religion
between urban and rural. There was no statistically significant
difference between girls living in the urban (72%; 224/311)
and rural (75.9%; 236/311) groups, respectively, living with
both of their biological parents (χ2
test p>0.05). Of the
remaining girls, 11.8% were living with one of their parents
while the remaining 13.3% were not living with any parent.
The overall mean family size was 5.7±1.8 with no statistically
significant difference between the urban and rural groups
(5.6±1.8 vs 5.8±1.8); p=0.6). Of their mothers, 17% were
illiterate and only 54.2% had attended any level of formal
education.
Health and health-related practices of the
participants
The majority, 87.8% (273/311) and 81.3% (253/311) of the
urban and rural groups of girls, respectively, obtained their
water within a 30-minute walk, while 76.1% (n=467) of all
the girls reported using a covered pit latrine. Only
3.9% (n=24) of the two groups of girls used open-field
defecation. No significant differences were observed between
the urban and rural girls with respect to latrine facilities.
Similarities between the urban and rural groups were also
found with respect to episodes of illness, using mosquito
nets, and wearing shoes (χ2
urban vs rural; p>0.05).
In the week preceding this study, 58.7% (n=355),
23.2% (n=141), and 17% (n=102) of girls washed their
hands with soap always, usually, or rarely, respectively,
30 minutes before eating. Following toilet use,
26.2% (n=158), 55.9% (n=339), and 16.7% (n=101) of all
surveyed girls always, usually, and rarely washed their hands
after toilet use, respectively. There was, however, a
significant difference between the two groups with respect to
hand washing after using the toilet. Only 20.8% (n=64) of
the urban girls washed their hands, compared to
31.7% (n=97) of the rural group (χ2
test p=0.01). Other
significant differences were the proportion of households
reported to fetch water within 30 minutes walking distance
(89.8% (n=273) urban vs 83.0% (n=253) rural; p=0.02) and
the proportion of respondents in contact with health
extension workers (64.7% (n=152) urban vs.
49.2% (n=121) rural; χ2
test p=0.02).
- 5. © TM Berheto, WK Mikitie, A Argaw, 2015. A licence to publish this material has been given to James Cook University, http://www.rrh.org.au
5
Table 1: Mean characteristics of adolescent girls in public schools of Mizan district, by residence February 2012
(urban n=308 and rural n=306)
Characteristic Mean (SD) Total (n=614) t-test
p valueUrban (n=308) Rural (n=306)
Age (years) 14.5 (2.0) 14.3 (2.0) 14.4 (2.0) 0.063
Height (cm) 157.1 (7.1) 152.7 (7.6) 154.9 (7.0) 0.001
Weight (kg) 47.8 (9.1) 44.0 (8.6) 45.9 (9.05) 0.001
BMI-for-age Z-score –0.32 (1.0) –0.50 (0.90) –0.41 (0.99) 0.026
Height-for-age Z-score –0.26 (.88) –0.84 (0.82) –0.55 (0.89) 0.001
BMI (kg/m2
)†
19.3 (2.9) 18.7 (2.8) 19.01 (2.9) 0.015
Age at menarche (n=378)†
13.2 (1.1) 13.8 (1.0) 13.5 (1.0) 0.001
Gynecological age (n=378)†
2.3 (1.5) 1.8 (1.4) 2.1 (1.5) 0.002
†
Independent sample t-test; p value is two-tailed.
BMI, body mass index. SD, standard deviation
Table 2: Distribution of physical activity and household chores of adolescent girls in public schools of Mizan
district, by residence February 2012 (urban n=308 and rural n=306)
Characteristic Mean (SD) Total (n=614) t-test
p valueUrban (n=308) Rural (n=306)
Time spent on physical activity per week (min) 430.3 (359.0) 555.2(613.6) 492 (502.0) 0.002
Time taken to school on foot in minutes 24.1 (10.4) 27.4 (15.2) 24.58 (13.2) 0.002
Sleeping (hours/day) (n=613) 7.8 (1.5) 8.0 (1.6) 7.89 (1.6) 0.025
TV watching (hours/day) 4.2 (1.43) 1.4 (1.4) 1.96 (2.0) 0.001
Sedentary life (hours/day) 10.4 (2.1) 9.4 (2.1) 9.9 (2.1) 0.005
Household chores (hours/week) 6.8 (4.75) 7.7 (5.4) 7.3 (5.1) 0.041
SD, standard deviation
In the month preceding the study, 99.2% (n=609) of the two
groups of girls ate meals at least twice a day, with
69.4% (n=212) of the rural and 61.8% (n=190) of the urban
study groups eating three meals a day. The food consumption
patterns of participants in the two populations were similar
with respect to cereals, vegetables, sweets and sugars, fats,
meat, and eggs (p>0.05). Differences were, however,
reported in the consumption of legumes (27.7% (n=85)
urban vs 33% (n=100) rural; p=0.01), milk and milk
products (13.2% (n=41) urban vs 20.2% (n=62) rural; χ2
test p=0.01) and fruits (59.8% (n=183) urban vs
49.5% (n=151) rural; p=0.01).
Physical activity
The various physical activities of the two groups of girls are
summarized in Table 2. The majority (79.3, n=487)) of total
participants engaged in at least 40 minutes of physical activity
per day in five or more days during the week preceding the
interview. More household chores were performed in rural
settings. Eighty-eight percent (n=268) of the urban group
walked to school, compared to 93.5% (n=283) of the rural
group (χ2
=5.5, p=0.02). A minority of the urban and rural
girls, 15% (n=46) and 18% (n=55), respectively, were
engaged in paid work after school.
- 6. © TM Berheto, WK Mikitie, A Argaw, 2015. A licence to publish this material has been given to James Cook University, http://www.rrh.org.au
6
Growth and nutritional status of the study participants
The age, height, weight, BAZ, and HAZ of all the adolescent girls
are shown in Table 1. On average, a gain of 23 kg in weight and
18 cm in height was observed as the age of the girls increased from
11 to 19 years. The mean BAZ and HAZ were significantly higher
for the urban than for the rural girls, with a mean difference of
0.18 (95% confidence interval (CI) 0.02–0.34) and 0.58 (95% CI
0.45–0.72) respectively. Urban girls were also taller and heavier
than their rural counterparts by an average of 4.38 cm
(95% CI 3.21–5.55) and 3.86 kg (95% CI 2.47–5.28),
respectively (Table 1).
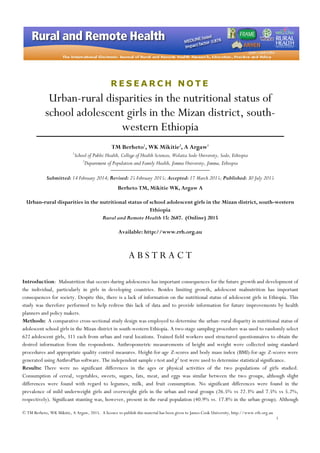
An age-wise comparison showed that the mean BAZ for
urban girls were higher than those for the rural group of girls
at every age except for ages between 16 and 17 years (Fig1).
After this time, although the mean BAZ for the rural
population remained below the reference group, the scores
for the urban group aged 18–19 years rose above the WHO
2007 reference line (Fig1). The mean HAZ of both the urban
and rural groups were below the reference group for all girls
aged 11–18 years (Fig2). A greater difference from the
reference data was observed in the rural group of girls (Fig2).
The overall prevalences of mild stunting, thinness, and being
overweight in the two groups of girls were 29.3%, 24.4%, and
6.4% respectively (Fig3). The prevalences of mild thinness, mild
stunting, and being overweight in the urban and rural settings
were 22.3% versus 26.5%, 17.8% versus 40.9%, and 7.5%
versus 5.2%, respectively. While an overall comparison of
nutritional status based on residence eand stunted in rural schools
compared to those in urban schools, the difference in the
proportion of thinness and being overweight was not statistically
significant. In contrast, the prevalence of mild stunting was
significantly higher in the rural group (40.9%) than in the urban
group (17.8%; p=0.0001). The proportion of stunting (HAZ<–
2) was 1.9% in the urban group compared to 6.9% in the rural
group. The prevalences of moderate and severe thinness were
5.2% versus 8.2% and 0.3% versus 1.3% in the urban and rural
groups, respectively (Table 3). No case of severe stunting was
observed in the urban group, whereas the incidence was 0.7% in
the rural group.
The majority (61.6%; n=378)) of the girls were post-menarche.
Of these, 66.9% (n=206) were from the urban and 56.2%
(n=172) were from the rural groups. The mean age at menarche
for menstruating girls (n=378) was 13.5±1.0 years, with the
urban girls reaching menarche at an earlier age than their rural
counterparts (13.2±1.1 urban vs 13.8±1.0 rural; p=0.001)
(Table 1).
Discussion
Relatively few studies have been undertaken to study the
nutrition of adolescent girls in Ethiopia. The present study
aimed to study disparities in the nutritional status of
adolescent girls from rural and urban communities, in order
to help redress this situation. Mizan, a zone of south-western
Ethiopia that has a low level of food insecurity, was chosen as
the study area. The provision of information on nutritional
status is important because although anthropometric
parameters, such as height and weight, are considered highly
heritable traits9
, they are also influenced by environmental
factors such as nutrition17,23
.
The results obtained in the present study demonstrated a disparity
in nutritional status between urban and rural adolescent girls. This
was shown by comparison of the current results with the WHO
2007 growth reference data, which shows the prevalence of
under-nutrition in terms of height for age and BMI for age for girls
from both urban and rural groups. While both urban and rural
girls were shorter and thinner than heights and weights of the
reference curve, the rural group of girls was also shorter and
thinner than their urban counterparts. This significantly lower
mean nutritional index of rural compared to urban girls is
consistent with previous studies performed in adolescents in
Ethiopia16-18
and other developing countries24,25
. One possible
reason for such a disparity might be the socio-economic status of
the household. The present results were, however, in contrast to a
previous rural northern Ethiopian study, in which the mean height
for age was below the –1.5 SD of the WHO 2007 reference
data26
. This difference might be attributable to variability in
livelihoods or the fact that Mizan is a relatively productive region18
compared to northern Ethiopia, where 75% of the girls studied
were from food-insecure households at some points in a year16
.
- 7. © TM Berheto, WK Mikitie, A Argaw, 2015. A licence to publish this material has been given to James Cook University, http://www.rrh.org.au
7
Table 3: Nutritional status of adolescent girls in public schools of Mizan district, by residence 2012 (urban n=308, rural
n=306)
Age (years) BMI-for-age Z-score Height-for-age Z-score
<–3SD (%) <–2SD (%) <+1SD (%) <+2SD (%) <–3SD (%) <–2SD (%)
Urban Rural Urban Rural Urban Rural Urban Rural Urban Rural Urban Rural
11–19 (n=614) 0.3 1.3 5.2 8.2 7.5 5.2 1.0 0.3 0.0 0.7 1.9 6.9
11–14 (n=313) 0.7 1.9 7.9 11.9 7.9 4.4 2.0 0.6 0.0 1.3 2.0 6.9
15–19 (n=303) 0.0 0.7 2.5 4.1 7 6.2 0.0 0.0 0.0 0.0 1.9 6.8
BMI, body mass index. SD, standard deviation
BAZ, BMI-for-age Z-score
Figure 1: Age-wise comparison of mean body mass index for age Z-scores of study population by residence
relative to WHO 2007 reference data (where ‘0’ represents the median of the reference data), Mizan district
February 2012 (urban n=308, rural n=306).
HAZ, height-for-age Z-score
Figure 2: Age-wise comparison of mean height for age Z-scores of study population by residence relative to
WHO 2007 reference data (where ‘0’ represents the median of the reference data), Mizan district February 2012
(urban n=308, rural n=306).
- 8. © TM Berheto, WK Mikitie, A Argaw, 2015. A licence to publish this material has been given to James Cook University, http://www.rrh.org.au
8
BMI, body mass index
Figure 3: Prevalence of mild under-nutrition and overweight of adolescent girls, by residence Mizan district
2012 (urban n=308, rural n=306).
The nutritional status of the girls, based on the BAZ,
indicated that there were no significant differences between
the urban and rural study groups. This result is at odds with
other reports from Ethiopia10,11
. Mild stunting was observed
in 29.3% of all the girls studied, but was more common in
the rural group, where it was found in 40.9% subjects
compared to just 17.8% in the urban group of girls. This
result is consistent with other reports4,25
and is supported by
evidence that rural girls are more likely to suffer from under-
nutrition when compared to urban girls in developing
countries10,11,26
. Of interest, a difference in moderate to
severe stunting in the urban and rural groups was lower than
other similar studies in different countries16,24,25
. Possible
reasons for this include socio-economic differences, not only
between the various countries, but also between the urban
and rural communities6,27
. Such differences might affect the
quality and quantity of food consumption. Another important
factor for consideration is that malnutrition occurring during
childhood might delay growth during childhood as well as in
adolescence2
.
The onset of menstruation is considered the most obvious
sign of puberty in girls28,29
. The mean age at menarche was
significantly higher in the rural group than in the urban group
in the present study. This was despite the absence of any
significant difference in biological ages between the two
populations. Instead, this result suggests an effect of different
living conditions on the onset of puberty. Indeed, under-
nutrition has been linked to a delayed age at menarche,
whereas a moderate degree of overweight has been associated
with early menarche29
. There is increasing evidence that the
age of onset of puberty is decreasing in the developed
world28
. In keeping with this, the mean age of menarche in
the present study is later than in girls from Michigan in the
USA (12.3±5 years30
), Alexandria in Egypt
(11.98±0.96 years), and in African-American girls28
.
Conclusions
Differences in nutritional status were found between urban
and rural girls. These took the form of decreased height,
weight, and BMI compared to 2007 WHO reference data
from other developing countries. Stunting was also
significantly increased in the rural group of girls compared to
those from an urban environment. These results demonstrate
the urgent need to develop strategies to improve the growth
and nutritional status of adolescent girls, with a special
emphasis on rural girls. Since the huge urban and rural
differences in nutritional status in terms of stunting might be
- 9. © TM Berheto, WK Mikitie, A Argaw, 2015. A licence to publish this material has been given to James Cook University, http://www.rrh.org.au
9
attributed to social and/or economic disparities, future
community-based longitudinal studies should be instigated as
soon as possible to further investigate the reasons for this.
Acknowledgements
The authors would like to thank all participants and the
school authorities. They also thank Nextgenediting for
editorial assistance as part of the Global Initiative.
References
1. World Health Organization, Adolescent Health and
Development Programme. Improving adolescent health and
development. Geneva: WHO, 2010.
2. United Nations Children’s Fund (UNICEF). The state of the world's
children: Adolescence: an age of opportunity. UNICEF: New York,
2011.
3. Stang J, Story M. Adolescent growth and development. In J
Stang, M Story (eds). Guidelines for Adolescent Nutrition Services.
Minneapolis: University of Minnesota, 2005; chapter 1.
4. World Health Organization. Adolescent nutrition: a review of the
situation in selected South-East Asian countries. New Delhi: Regional
Office for South East Asia, 2006.
5. Greene ME, Cardinal L, Goldstein-Siegel E. Girls speak: a new
voice in global development. Washington: International Center for
Research on Women, 2009.
6. Bertini C. Girls grow: a vital force in rural economies. Chicago:
Chicago Council on Global Affairs, 2010.
7. Giuseppina D. Nutrition in adolescence. Pediatrics in Review 2000;
21(1): 32-33.
8. World Health Organization. Improvement of nutritional status of
adolescents. Report of the Regional Meeting, Chandigarh, India, 17–
19 September 2002. New Delhi: WHO, 2002.
9. Ahmad H, Liaqat P, Paracha PI, Qayyum A, Uppal A.
Assessment of nutritional status of adolescents versus eating
practices in Islamabad city. Pakistan Journal of Nutrition 2009; 8(8):
1304-1308.
10. Ethiopian Health and Nutrition Research Institute (ENARI).
National nutrition baseline survey report for the national nutrition program
of Ethiopia. Addis Ababa: ENARI, 2010.
11. Hadley C, Belachew T, Lindstrom D, Tessema F. The shape of
things to come? Household dependency ratio and adolescent
nutritional status in rural and urban Ethiopia. American Journal of
Physical Anthropology 2011; 144(4): 643-652.
12. World Health Organization. Broadening the horizon: balancing
protection and risk for adolescents. Geneva: WHO, 2010.
13. World Health Organization. Nutrition in adolescence: issues and
challenges for the health sector. Geneva: WHO, 2005.
14. Standing Committee on Nutrition. Adolescence: a pivotal stage
in the life cycle. SCN News 2006, no. 31.
15. Federal Democratic Republic of Ethiopia Population Census
Commission. Summary and statistical report of the 2007 Population and
Housing Census. Addis Ababa: Central Statistical Agency of Ethiopia,
2008.
16. Mulugeta A, Hagos F, Stoecker B, Kruseman G, Linderhof V,
Abraha Z, et al. Nutritional status of adolescent girls from rural
communities of Tigray, northern Ethiopia. Ethiopian Journal of
Health Development 2009; 23(1): 5-11.
17. Assefa H, Belachew T, Negash L. Socioecondomic factors
associated with underweight and stunting among adolescents of
Jimma Zone, south west Ethiopia: a cross-sectional study. ISRN
Public Health 2013; 238546.
18. United States Agency for International Development (USAID).
Southern Nations Nationalities and People’s Region Ethiopia (SNNPR)
livelihood profiles. USAID, 2006.
19. Hadley C, Lindstrom D, Tessema F, Belachew T. Gender bias
in food insecurity experiences of adolescents in Jimma Zone. Social
Science and Medicine 2008: 66: 427-438.
20. Booth M, Okely AD, Chey T, Bauman A. The reliability and
validity of the Adolescent Physical Activity Recall Questionnaire.
Medicine and Science in Sports and Exercise 2002; 34(12): 1986-1995.
21. Lohman T, Roche A, Martorell R. Anthropometric standardization
reference manual. Champagne. USA: Human Kinetics Books, 1988.
- 10. © TM Berheto, WK Mikitie, A Argaw, 2015. A licence to publish this material has been given to James Cook University, http://www.rrh.org.au
10
22. Blössner M, Siyam A, Borghi E, de Onis M, Onyango A, Yang
H. WHO AnthroPlus for Personal Computers Manual: software for assessing
growth of the world's children and adolescents. Geneva: WHO, 2009.
23. Kodjo A. Poverty and the anthropometric status of children; a
comparative analysis of rural and urban households in Togo. Nairobi:
African Economic Research Consortium, 2009.
24. Oninla SO, Owa JA, Onayade AA, Taiwo O. Comparative
study of nutritional status of urban and rural Nigerian school
children. Journal of Tropical Pediatrics 2007; 53(1): 39-43.
25. Maiti S. A comparative study on nutritional status of urban and
rural early adolescent school girls of West Bengal, India. Journal of
Nepal Paediatric Society 2011; 31(3).
26. Uthman OA, Aremu OF. Malnutrition among women in sub-
Saharan Africa: rural-urban disparity. Rural and Remote Health 8:
931. (Online) 2008. Available: www.rrh.org.au (Accessed 21 July
2015).
27. McMichael AJ. The urban environment and health in a world of
increasing globalization: issues for developing countries. Bulletin of
the World Health Organization 2000; 78(9).
28. Malina R. Secular trends in growth, maturation and physical
performance: a review. Anthropological Review 2004; 67: 3-31.
29. Mounir GM, El-Sayed NA, Mahdy NH, Khamis SE. Nutritional
factors affecting the menarcheal state of adolescent school girls in
Alexandria. Journal of Egypt Public Health Association 2007; 82(3 &
4).
30. Michels Blanck H, Marcus M, Tolbert PE, Rubin C, Henderson
AK, Hertzberg VS, et al. Age at menarche and tanner stage in girls
exposed in utero and postnatally to polybrominated biphenyl.
Epidemiology 2000; 11(6): 641-647.