Design and Development of a Provenance Capture Platform for Data Science
Deviser2
1. TEST REPORT
Multi Norm Digital TV Signal Analyzer
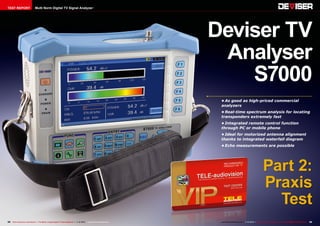
Deviser TV
Analyser
S7000
• As good as high-priced commercial
analyzers
• Real-time spectrum analysis for locating
transponders extremely fast
• Integrated remote control function
through PC or mobile phone
• Ideal for motorized antenna alignment
thanks to integrated waterfall diagram
• Echo measurements are possible
Part 2:
Praxis
Test
34 TELE-audiovision International — The World‘s Largest Digital TV Trade Magazine — 1
1-12/2013 — www.TELE-audiovision.com
www.TELE-audiovision.com — 1
1-12/2013 — TELE-audiovision International — 全球发行量最大的数字电视杂志
35
2. Multi Norm Digital TV Signal Analyzer
TEST REPORT
Professional
Combination Signal
Analyzer for All Digital
TV Standards
■ TELE-audiovision's
Technical Editor
Vitor Martins
Augusto using the
Deviser S7000
TEST REPORT
Multi Norm Digital TV Signal Analyzer
Deviser TV
Analyser
S7000
Part 1: Analyzer
Functions
• Very large, high resolution display
• Suitable for MPEG2 and MPEG4
• Real-time spectrum for quickly
identifying active transponders
• Can be remotely controlled via PC
or mobile phone
• Very ergonomical and practical
operation
14
TELE-audiovision International — The World‘s Largest Digital TV Trade Magazine — 09-10/2013 — www.TELE-audiovision.com
www.TELE-audiovision.com — 09-10/2013 — TELE-audiovision International — 全球发行量最大的数字电视杂志
15
■ Part 1 of this test report appeared in the 09-10/2013 issue of
TELE-audiovision. It can be read online here:
www.TELE-audiovision.com/TELE-audiovision-1309/eng/deviser1.pdf
36 TELE-audiovision International — The World‘s Largest Digital TV Trade Magazine — 1
1-12/2013 — www.TELE-audiovision.com
3. 4
While we introduced
the functions of this new
Deviser S7000 analyzer
in the previous issue of
TELE-audiovision, in this
second part we want to
reveal to you the results
of our actual testing and
also present our comparison to a number of other
reference analyzers.
The Deviser S7000 is an
amazing signal analyzer
that can demodulate, measure and analyze nearly
every possible TV signal.
There are numerous familiar measurements and then
also a number of seldom
used measurements available to the technician.
The integrated transport
stream analyzer also makes
this device interesting for
use in head-end stations
since, for example, it would
be able to troubleshoot any
problems in newly muxed
transport streams. To properly test all of the different
functions in the S7000, we
created a number of different scenarios in our test
center
and
constructed
tasks for the analyzer to
deal with.
The first thing you‘d expect with a professional analyzer is very high precision;
you want to be able to trust
the values that are measured. That‘s why we measured a number of different
signal sources with five different reference analyzers
and compared the results to
the S7000. The five reference analyzers that we used
were higher-end devices.
As you can see in the following table, the S7000‘s
measurement values are
very similar to those of the
five reference devices.
The fact that that Deviser
is serious about its measurement precision is confirmed not once but twice
in the S7000‘s configuration
menu: you can see the date
of the most recent calibration and there‘s also the
ability to synchronize the
S7000‘s measurement values on your own so that you
can, for example, guarantee
that all of your company‘s
analyzers will perform identical measurements.
Exercise:
Fine-tuning
a Motorized
100cm
Offset Antenna
Aligning an antenna with
the S7000 is extremely easy
since this analyzer confirms
its own position through the
included GPS antenna and
automatically displays elevation, azimuth and LNB
skew for the selected satellite.
The setup of the new antenna therefore turned out
to be unspectacular and the
strongest satellites could
immediately be received
after which a fine-tuning of
the antenna was all that remained to be done.
And it‘s here where the
Deviser S7000 could really
prove itself; the presentation of waterfall diagrams
makes this otherwise cumbersome job a piece of cake.
Simply move the antenna
76.9 dBµV
75.6 dBµV
77.0 dBµV
73.0 dBµV
76.0 dBµV
75.0 dBµV
MER
14.9 dB
-
12.5 dB
12.0 dB
17.1 dB
14.9 dB
CBER
<1.0E-6
-
3.6E-6
1.7E-6
2.0E-4
<1.0E-6
<1.0E-8
<1.0E-8
<1.0E-8
-
<1.0E-7
<1.0E-9
Power
DVB-S2
Deviser
S7000
VBER
DVB-S
Measurement
Power
Modulation
76.3 dBµV
-
76.0 dBµV
-
76.1 dBµV
74.6 dBµV
MER
13.3 dB
-
16.8 dB
-
17.1 dB
14.8 dB
CBER
4.4E-0
-
7.0E-4
-
2.0E-4
4.4E-4
Reference 1 Reference 2 Reference 3 Reference 4 Reference 5
LBER
-
<1.0E-7
<1.0E-7
-
56.5 dBµV
55.0 dBµV
56.5 dBµV
MER
>30 dB
-
-
30.3 dB
34.3 dB
30.7 dB
CBER
2.1E-02
-
-
6.1E-5
3.0E-5
<1.0E-6
1.9E-03
-
-
-
<1.0E-8
<1.0E-9
52.9 dBµV
49.0 dBµV
-
51.0 dBµV
51.1 dBµV
51.3 dBµV
MER
35.1 dB
29.5 dB
-
23.4 dB
>36 dB
29.5 dB
PRE-BER
<1.0E-9
<1.0E-8
-
1.3E-3
<1.0E-9
<1.0E-7
POST-BER
Analog
<1.0E-8
-
Power
DVB-C
-
56.5 dBµV
VBER
DVB-T
<1.0E-8
Power
<1.0E-9
-
-
-
<1.0E-9
<1.0E-9
Video
57.5 dBµV
59.9 dBµV
-
58.0 dBµV
58.1 dBµV
57.7 dBµV
Audio
42.3 dBµV
-
-
41.5 dBµV
41.5 dBµV
39.7 dBµV
■ Table 1: Comparison of the S7000's measurement values to five other professional analyzers in
our TELE-audiovision test lab.
38 TELE-audiovision International — The World‘s Largest Digital TV Trade Magazine — 1
1-12/2013 — www.TELE-audiovision.com
from one limit to the other
and then have a look at the
resulting waterfall diagram:
it instantly becomes clear
how many satellites can be
received and at what signal
level. The following holds
true for the northern hemisphere: if the satellites to
the east have a strong signal while the satellites to
the west are weaker, then
the entire antenna including
the motor has to be moved
to the left.
If it‘s the other way
around, then the antenna would be moved to the
right. If the outer satellites
are strong while the central ones are weaker, then
the inclination of the motor
would need to be lowered
and the inclination of the
antenna raised.
If reception of the central
satellites is good and the
outer ones weak, the opposite needs to be done. This
procedure was previously
presented in the 02-03/2012
issue of TELE-audiovision see Table 2.
The great thing about a
waterfall diagram is that you
can see in a single glance
the reception of the entire
horizon. With a little bit of
practice and feeling it would
even be possible to use the
waterfall diagram to identify
individual satellites and after a little time you‘ll know
how far the antenna would
need to be turned to optimize reception.
There‘s no question: when
aligning a satellite antenna,
regardless if it‘s motorized
or not, a real-time spectrum is by far the best aid
that an analyzer could offer. And, beyond that, if the
spectrum is presented as a
waterfall diagram, it would
be heaven.
Thank you, Deviser, for
incorporating such valuable
display tools; we can no
longer do without them.
Waterfall
1. The waterfall diagram shows
the spectrum encoded with
colours over a period of time.
If the antenna is rotated, it
is possible to clearly see the
individual satellites and their
transponders. Also, this gives
a clear indication on the signal
level of each satellite: in the
picture you can see that some
satellites have a very low
signal.
2. Deviser implemented an
additional visualization in the
S7000: a combined view of the
spectrum and the respective
waterfall diagram.
3. This is ideal to adjust the
antenna. The picture shows the
variation of the reception – this
allows to fine tune the antenna
for maximum gain.
4. This picture shots that
satellites located east show
a much better signal than
satellites in the west. This
means the inclination of the
motor is wrong.
5. After correcting the motor
inclination, all satellites are
received with a similar signal
level.
6. The motor handling is
extremely well implemented
on the Devisor S7000. You
can choose between a fully
dedicated menu featuring all
required DiSEqC-commands
(1.0, 1.1 and 1.2), as well as
theSaTCR (Sat Cable Routing)
mode, used to provide the
satellite signal to multiple
users with a single cable.
7. Alternatively you can stay
in the spectrum modus and
rotate the dish using the DRIVE
option. When it is active, the
left and right keys are used
to rotate the dish, while the
up and down keys are used to
switch between a continuous
move and a stepped move. The
pictures shows the results of
the fine tuning – no doubts
it has never been as easy to
obtain the perfect alignment.
8. As a reward it is possible
to enjoy a bit of live radio
fromEutelsat W3A
5
1
6
2
7
3
8
www.TELE-audiovision.com — 1
1-12/2013 — TELE-audiovision International — 全球发行量最大的数字电视杂志
39
4. ■ Checking a
Multiswitch
with the Deviser
S7000
Exercise:
Troubleshooting
- Interference
in a Home‘s
CATV Distribution
In our Portuguese test
center CATV and satellite
TV are available over a common cable. The coax cable
from the CATV provider is
first run through a splitter
with one of the outputs going to a DOCSIS modem to
provide broadband Internet
access. The second splitter
output goes to a multiswitch
that takes the CATV signal of
50-850 MHz and combines
it with the satellite signal
of 950-2100 MHz from Astra 19.2E, Hotbird 13.0E and
Hispasat 30.0W.
All of a sudden, only weak,
static-filled analog CATV
could be received at all the
■ Table 2: Correct alignment of the motor and antenna: all the
satellites are on the antenna's arc
Faulty alignment of the motor and antenna
cable jacks while the satellite
signal could not be received
at all.
Here comes the S7000. On
the first cable port there was
no digital cable signal at all
and also no satellite signal.
Using an analog transponder the problem was quickly
found: the coax cable was
Too high
Too low
Motor axis
inclination
Outer satellites cannot be received (antenna too
high)
Outer satellites cannot be received (antenna too low)
Antenna
inclination
No satellites can be received (antenna too high)
No satellites can be received (antenna too low)
Motor
alignment
Left satellites can’t be received because antenna is
too low; right satellites can’t be received because
antenna is too high
Left satellites can’t be received because antenna is
too high; right satellites can’t be received because
antenna is too low
40 TELE-audiovision International — The World‘s Largest Digital TV Trade Magazine — 1
1-12/2013 — www.TELE-audiovision.com
not correctly connected to
the cable port.
Nevertheless, there still
was intermittent interference. A Barscan of the CATV
channels showed a significant reduction in the signal level/performance (depending on whether it‘s an
analog or digital signal) and
the constellation diagram
showed widely scattered
clouds rather than the usual focused image points for
each quadrant.
This situation could also
be measured on another antenna jack and this led to the
conclusion that the problem
was not with the cable or the
antenna jacks. Next the distribution cabinet was opened
and the analyzer was connected directly to one of the
multiswitch outputs. Once
again the same problem was
observed.
Since the attached satellite antenna and especially
the LNBs have not been
serviced in some time, we
began to suspect that one
5. 9
12
10
13
11
14
or more connectors had become oxidized or that an LNB
was defective. The LNBV
output cables were therefore connected individually
to the S7000 and discovered
that each of the polarizations
from the three Quattro LNBs
could be perfectly received.
Could the multiswitch be
defective? When the CATV
cable was connected directly from the splitter to the
analyzer, some light could
now be shed on the problem: interference could also
be seen here even though
the multiswitch wasn‘t being used. The problem could
then only be with the signal
from the provider; or could it
be the splitter?
When the cable from the
provider was directly connected to the analyzer, there
CATV
9. An analogue picture like this
is normally an indication that
something is definitely wrong
with the cable. And yes: even
today it is still important to be
able to measure analogue CATV
channels and to show a live picture.
10. The video and audio signal
level is far too low.
11. Same problem with the channel to noise ratio.
12. After opening the aerial
socket and reconnecting the
coaxial cable properly, reception
was apparently back to normal.
13. Still I was getting intermittent
picture interferences. There was
another additional problem.
14. The constellation diagram
shows a less defined and concentrated cloud – a clear indication that the signal modulation
was not OK.
15. The culprit was a defect
signal splitter. After exchanging it, the constellation diagram
showed perfectly concentrated
clouds.
16. The signal quality was back
to normal and without any interferences.
15
16
42 TELE-audiovision International — The World‘s Largest Digital TV Trade Magazine — 1
1-12/2013 — www.TELE-audiovision.com
6. 17
was no problem receiving
analog and digital cable TV
signals. The problem was
definitely with the splitter
and not with the provider.
Fortunately, there‘s always
a few replacement parts lying around so after replacing
the splitter with a new one,
everything once again functioned normally.
In these fault scenarios it
was demonstrated how beneficial it would be to have
an analyzer like the S7000.
It has no trouble analyzing
DVB-C signals in all the different modulations as well
as analog and DVB-S/S2 signals. The real-time spectrum
display makes it possible to
identify intermittent interference and, of course, the
combined waterfall display is
largely preferred since at the
same time as the spectrum
this is also retained over a
period of time. In this way
tendencies, among other
things, could be recognized.
This could be especially useful if the signal only slowly
rises or falls off.
The multiswitch could be
controlled through the perfect DiSEqC implementation
and the modulation quality
could be checked thanks to
the constellation diagram.
During the tests cables were
connected and disconnected
without any hiccups to the
S7000. All in all, the analyzer
has shown itself to be very
robust.
The S7000 is the perfect
technician‘s tool for troubleshooting problems at a customer site. All the required
functions are without exception correctly implemented
and function as expected.
Exercise:
Designing
a DIY
DVB-T antenna
In many regions DVB-T is
implemented as an SFN (Sin-
gle Frequency Network). All
broadcasters transmit one
or more transponders on the
same frequencies. The huge
advantage here is that the
remaining frequency spectrum is left for other applications. The user can move the
receiver around within the
region (for example, in a car)
without having to change the
frequency even when reception is from another transmitter.
In this test we wanted to
find out if the stub antennas
included with the USB receiver - in this case it‘s T-dipole antennas - are matched
to the country-specific DVBT frequency. For this reason a T-dipole antenna was
constructed out of wire. The
length of the wire was calculated precisely for the Portuguese DVB-T frequency of
754 MHz. The formulas for
the DIY T-dipole are:
For a DVB-T frequency of
754 MHz you get an outer
conductor length of 94mm
and an inner conductor
length of 96mm.
The outer conductor length
can be achieved by simply
pulling back the shield on the
cable to the proper length
while the insulation for the
inner conductor is simply removed.
And there you have it, a
DIY (Do-it-Yourself) DVB-T
antenna for SFN reception.
You can find a variety of
construction ideas for these
T-dipole antennas on the Internet and even for doublequad antennas that promise
even better reception.
But here’s the question: is
our DIY antenna really better than the included stub
antenna? The answer can be
seen in Table 3.
Sure enough, it pays to
use a specialized T-Dipole
antenna. However, our experiments have shown that
you can simply cut off the
metal sheathing.
If the inner conductor is
20
21
DIY DVB-T Antenna
17. DVB-T Signal of our external
antenna. Reception is quite
good.
18. A good indicator for
DVB-T reception quality is the
constellation diagram. As long
as all dots are closely within
the centre of each square,
everything is fine.
18
19
23
19. The Deviser S7000 allows to
set the resolution bandwidth in
spectrum mode. This is unique
among the meters I have tested
so far. A smaller bandwidth will
feature higher resolution, while
a bigger bandwidth will result
in a slower spectrum refresh
rate. Because we are looking at
the specific DVB-T transponder
at 754 MHz, a span of 16 MHz
is sufficient and thus even the
lowest resolution bandwidth
setting will produce a real time
refresh rate. The resolution
is so good, that you can
practically see the carriers.
22
24
25
20. The same signal, but in
combined spectrum and
waterfall diagram view. This
allows to monitor the spectrum
over a period of time, while
simultaneously monitoring the
spectrum in high detail.
21. A generic rod antenna
provided with a USB DVB-T
receiver: this antenna was not
designed specifically for a
certain frequency; its length
does not match the SDN
frequency of 754 MHz as used
in Portugal.
26
left at the correct length,
the reception results are
even better thus making the
building and optimization
of the antenna that much
easier. The Deviser S7000
answered our question com-
pletely. Through its high
measurement precision and
speed we were quickly able
to get the answers we needed regarding the reception
capabilities of the antennas.
23. Looking at the constellation
diagram using the generic
rod antenna, it is obvious that
the signal quality is far from
perfect.
24. First step of the DIY
antenna: strip the rubber off
the cable, maintaining the
length calculated for the SFN
frequency.
27
■ Formula 1: The formla to calculate a DIY T dipol antenna
754 MHz
Televés TDT Roof
Antenna
Original Antenna
Optimized DIY
T-Dipol Antenna
Leistung
61.0dBµV
41.7dBµV
46.2dBµV
MER
>30 dB
23.8 dB
23.8 dB
CBER
<1.0E-5
2.2E-3
3.4E-3
VBER
<1.0E-7
<1.0E-7
<1.0E-7
■ Table 3: DVB-T measurement comparison using the
Deviser S7000
44 TELE-audiovision International — The World‘s Largest Digital TV Trade Magazine — 1
1-12/2013 — www.TELE-audiovision.com
22. As a result, the signal
power is only 41.7 dbµV and the
CBER is rather low, though still
correctable since the VBER is
under 1.0E-7.
25. Flip the mesh back and
leave the inner wire with the
correct length: you just got
yourself the “poor-man’s”
DVB-T antenna.
26. Amazingly, the signal power
is on average 5 dBµV higher
than with the generic antenna.
27. Again, using the waterfall
diagram it is easy to adjust
the antenna so that reception
is maximized. It is strange
to think on how it has been
possible in the past to fine tune
the alignment of the antenna
without this functionality. One
thing is for sure: the waterfall
diagram is an outstanding aid
for installers.
www.TELE-audiovision.com — 1
1-12/2013 — TELE-audiovision International — 全球发行量最大的数字电视杂志
45
7. 28
Echo
Measurement
The Deviser S7000 can
also perform Echo measurements, critical for DVB-T/H.
This makes it possible to
optimally erect an antenna
such that the interference
caused by a second, more
distant transmitter can be
eliminated.
When this second transmitter lies outside of the
so-called Guard interval, annoying runtime delays are
the result that the demodulator can no longer compensate for. This leads to
interference and, at worst,
a total loss of reception. A
technician armed with the
S7000 can solve this problem in which, for example,
he can set up two antennas
and offset them such that
the incoming interference
signals would simply cancel
each other out.
The principle behind this
is that both antennas are
aligned to the nearest transmitter and the interference
coming from the distant
transmitters would involve
turning the antenna to receive them.
If the offset of the two antennas is selected cleverly,
then the signals from the
two nearby antennas would
add to each other while the
signals from the distant
transmitters would cancel
each other out.
Since these types of interference echoes did not
exist near our test center
Mux TS Analyser
28. In order to use the Transport
Stream Analyser of the S7000
with the ASI input, you have to
first enable this interface.
29. By pressing the TV key on the
meter, you enter the Transport
Stream Analyser, which is now
receiving the TS stream on its
ASI input connector. In this case
I setup a TS containing channels
from two different German FTA
transponders.
30. The Deviser S7000 gives
access to all parameters of the
this type of interference was
not a problem here although
with the S7000 it would have
been very easy to set up
such a “double antenna”.
The ability to confirm your
actual position with the included GPS antenna is actually quite interesting. In this
way you could use the S7000
to create regional reception
maps.
Too bad you can’t save signal strength measurements
automatically with the local
position so that they could
later be uploaded to a PC
or exported in Google Maps
format. Deviser will most
likely incorporate this function in a future firmware update. This would allow you
to drive around a selected
region and at the end you’d
have an automatically generated field strength map.
32
37
29
33
38
30
34
39
31
35
40
36
41
Exercise:
MUX analysis of
a self-generated
transport stream
To test the Deviser S7000
as a TV analyzer, a scenario
was set up in a head-end
station. A professional IRD
with an integrated multiplexer receives a transponder via the built-in DVB-S2
tuner and from a second IRD
via the ASI-IN interface. The
two transponders are then
muxed together into a new
transponder that is sent to
the ASI output.
The S7000 was connected
to this output with the goal
TS stream. 31, 32. Interestingly,
the equipment used to generate
this mux filtered all NIT information, which is correct. Don’t
you hate receiving a CATV transponder containing a satellite
NIT?
33. One important application
for the S7000: determining the
TS rate. Notice on this picture
that the specified bandwidth of
the TS is 75 MB/s, but 32.45%
are not being used. This clearly
represents a waste of allocated
bandwidth.
34. I reduced the bandwidth on
the multiplexer to 35 MB/s but
this time the S7000 indicates
that there is 0% empty capacity
in the stream. This means that
there is no reserve for sporadic
increases in bandwidth.
35. Again, the multiplexer was
setup, this time to use a bandwidth of 40 MB/s. And this time
around 15% of the bandwidth is
empty, leaving some reserve.
This adjustment took a couple of
minutes and resulted in saving a
bandwidth of 35 MB/s.
36. To compare our TS with one
of the originally broadcasted
streams, we connected the ASI
output of one of the IRDs.
46 TELE-audiovision International — The World‘s Largest Digital TV Trade Magazine — 1
1-12/2013 — www.TELE-audiovision.com
37. While there is no disturbance
in the PCR interval measurement
in our TS…
38. …some can be detected from
the satellite signal, which is
normal after travelling back and
forth into space. However, if the
TS from our multiplexer would
show a PCR like this, then something would clearly be wrong.
39. Analysis of one of the original satellite Transport Streams.
40. The PIDs carry different numbers…
41. …and the NIT contains additional data.
www.TELE-audiovision.com — 1
1-12/2013 — TELE-audiovision International — 全球发行量最大的数字电视杂志
47
8. 44
of analyzing the received
transponder stream to, for
example, check the PIDs
that were being used and to
measure eventual timing errors.
This job is handled by
the S7000 effortlessly. You
merely have to activate the
ASI input to use the TV analyzer function with the TS
stream on the ASI input.
Numerous functions are now
available just like in normal
Tuner mode.
We could quickly determine if the stream really
consisted of all the desired
channels and services. It’s
interesting to note that the
IRD assigned new PIDs such
that they don’t correspond to
the PIDs of the original transponder. The S7000 showed
this instantly.
Finally, it also pays to perform a PCR measurement:
if the original satellite signal had no deviations (in the
green range), the stream
produced by the IRD was
perfectly synchronized with
the S7000’s clock generator.
If there was the smallest of
errors, they would have been
further multiplied through
additional signal distribution.
The Deviser S7000 is ideal
for all of these tasks.
S7000’s
PC Software
So, what software is loaded on the included CD? The
S7000 Toolbox (as the software is called) lets you comfortably manage and edit
numerous transponder and
satellite lists. Additionally,
measurements stored in the
S7000 can be presented on a
PC. Not only that, measurements can be stored in two
different ways.
For starters the current
screen image can be saved
as a picture. The measurement values themselves can
be stored. These measurement values could then be
displayed in the PC software
whereby more influence can
naturally be placed on the
presentation. This makes it
possible to generate professional inspection reports on
the computer. The technician
can copy all the measurement data onto a USB stick
and hand it over to his office
colleagues who could then
create the reports.
In this way you don’t have
to do the actual work on the
S7000 leaving it free to be
45
42
46
43
Toolbox Software
42. Thanks to the S7000’s Ethernet port
it is possible to access the data captured
through an FTP client.
43. Naturally, the same can be done using
the Deviser Toolbox software, which
allows to edit the channel lists and satellite
transponder as well.
44. Editing the satellite transponder lists
48 TELE-audiovision International — The World‘s Largest Digital TV Trade Magazine — 1
1-12/2013 — www.TELE-audiovision.com
is really easy, but Deviser did a good job
maintaining them updated, so there really
was nothing to edit: the S7000 features all
worldwide satellite transponder lists.
45. Editing the terrestrial channels is no
challenge either, and again all channel
plans worldwide are predefined.
46. Amazingly, the Toolbox software is
not only capable of downloading and
displaying the screenshots taken during
measurements. If you instead store the
actual data, the measurements can be
rendered with the toolbox software instead.
This provides additional functionality,
since markers can be moved, etc. Also, the
technician taking the measurements does
not have to worry about specific readings
for the report – they can be generated with
the stored data and you don’t even need
the meter to do that: just transfer the data
using the network or a USB memory and
the meter is ready to be used for the next
call!
www.TELE-audiovision.com — 1
1-12/2013 — TELE-audiovision International — 全球发行量最大的数字电视杂志
49
9. 47
48
49
used on the next job.
The data (settings and
measurements) can be read
directly as a file from a disk
or via the integrated ActiveSync function via the
network from the analyzer.
Naturally, the files can be
copied the same way from
the PC back to the analyzer.
The underlying protocol is
actually the best FTP protocol and, thanks to the Wireshark network analysis tool,
the access data was quickly
determined: if needed you
can also copy the files back
and forth normally via FTP
where you provide the IP address of the analyzer along
with the user name „ftpadmin“ and the password „Instrument“.
It‘s important to operate
the FTP connection in Active mode so that files can
be copied back and forth
more quickly. Damage can‘t
be inflicted to the device in
this way since only the User
Directory Plan, SaveBmp,
SaveData and Temp are
available via FTP.
The highlight of the S7000
Toolbox Software is the remote control of the entire
analyzer! Via the unremarkable „Remote Control“ button a new window is opened
that then displays the front
panel of the analyzer including the screen. The mouse
can be used to „press“ all
of the virtual buttons just
like the real buttons and the
screen reacts just as fast as
on the real analyzer.
You can access all of the
functions via the network
without requiring any direct
access to the actual physical analyzer. Only the demodulated video/audio is
not passed on which is to
be expected considering
50
51
Toolbox Software
47. Incredibly, Deviser implemented
a remote access to the meter. All
you need is a network connection
to the meter to be able to fully
operate the S7000 remotely.
48. Everything shown on the
physical screen is rendered in real
time on the remote software.
49, 50. Even the TS analyser
function can be used this way –
only the live picture is obviously
not shown, due to bandwidth
limitations of the network.
51. If you have a smartphone, you
can do a VNC connection to the
PC running the Deviser Toolbox
software. This means that you can
climb to the roof with just your
phone and still use all functions
of the S7000. This is simply
incredible.
50 TELE-audiovision International — The World‘s Largest Digital TV Trade Magazine — 1
1-12/2013 — www.TELE-audiovision.com
10. the bandwidth that would be
needed.
So the question then is:
why not leave the S7000 in
the house and only climb up
on the roof with a SmartPhone?
The SmartPhone can be
linked to the PC via VNC
which can then be controlled
remotely. If the Toolbox
Software is started ahead of
time, the S7000 can then be
comfortably controlled via
the SmartPhone and thanks
to its touchscreen you have
access to all of the analyzer‘s
virtual buttons.
Just like that you have a
100g (1/4 Lbs) SmartPhone
in your hand and you can
hang out on your roof for
hours adjusting your antenna! How great is that?
Perhaps Deviser will eventually offer an App for Android phones and/or iPhones
so that the S7000 can be
controlled directly without
first going through a PC.
Are there any
issues with
the analyzer?
A test in which no problems are found with a unit is
not possible; it would be an
indication that you haven‘t
adequately dealt with it.
Even so, there is essentially
nothing to complain about
with the S7000 so some effort had to be made to at
least come up with the following points:
• With analog CATV signals
the S7000 cannot display
any videotext. This isn‘t really critical since the analog
video signal can be analyzed
in Oscillator mode.
and to compare the current
spectrum for a longer period
56
55
of time with the stored spectrum to determine if there
has been any deterioration.
Deviser
could
more
than
likely add this function easily
with a firmware update.
• It was somewhat annoying that the S7000 auto-
57
matically reduces the range
of the spectrum based on
the incoming signal when
you
switch
to
measure-
ment mode. As soon as the
spectrum is redisplayed, the
range has to be manually adjusted in order to once again
see
the
entire
spectrum.
This is just a minor thing and
probably just as many users will appreciate this - it‘s
a typical case of: you can‘t
make everyone happy.
Battery and Inside Peek
52. The battery pack of the S7000 is easily accessible on the back
side of the meter. Two big screws need to be loosened up.
53. The cover plate can be removed, revealing the battery pack.
54. The battery back can be pulled by the two cords. It is a composed of a 10x AA battery pack.
55. We could not resist removing the cover of the meter to have a
peek inside. What we saw: a highly integrated and extremely well
built electronic equipment. Naturally we did not dare to further
disassemble the device, so this is the best insight we can provide.
Ka-Band Satellite Scan
53
56. This waterfall diagram shows the horizon from about 30.0E to
30.0W using the Inverto Ka LNB. Only 9.0E is broadcasting transponders in the 19.7 GHz – 20.2 GHz range.
57. This picture shows 9.0E over a period of time (about 30 seconds).
The second half (lower part – representing about 15 seconds) of the
waterfall diagram was recorded during a sporadic rain shower. Curiously the rain did not produce any signal loss.
But these are all minor issues. The Deviser S7000 is a
professional signal analyzer
for practically all TV stand-
How to interpret BER
measurements
ards. It is perfectly equipped
for any possible application.
Every possible measurement
What
does
1.2E-03
mean? BER stands for Bit
Error Ratio: the measuring instrument will basically count the erroneous
bits within all received
bits and calculate this
simple formula:
is available. The analyzer is
very easy to use, it is robust and also comes with a
complete TV analyzer. The
measured
values
remove
any doubts and provide an
accuracy
similar
to
other
high-end professional signal
show this number as 1E6, instead, to save some
screen space. So this is
what a reading of CBER =
1.2E-03 means: you will
get one wrong bit in every 1200 bits received.
CBER means that no error correction has been
applied to the signal, so
let’s now see what LBER
< 1.0E-8 means:
Let’s do the math:
analyzers.
What more could you ask
for? Perhaps, armed with the
S7000, you‘d hopefully want
to come across as many
• In Spectrum mode you
can‘t overlay a current
spectrum with a previously
stored spectrum as a reference. This could typically
be used to align different
antennas exactly the same
52
54
complex situations as possible so that you could diagnose and correct them.
It‘s simply a lot of fun to
work with this outstanding
signal analyzer!
52 TELE-audiovision International — The World‘s Largest Digital TV Trade Magazine — 1
1-12/2013 — www.TELE-audiovision.com
Because the amount
of erroneous bits is normally very small, let’s
say 1 wrong bit in every
1.000.000 bits, it would
look odd to see a value of 0.000001 on the
meter’s screen. A much
more convenient format
would be 1x10⁻⁶. Calculators will frequently
It means that after applying the error correction, we only will receive
one bad bit every hundred million received bits.
We will have a great picture without any noticeable artifacts. However,
because our initial CBER
value is low, there is no
bad weather reserve.
If the signals gets only
slightly worse, the error correction will not be
able to correct the incoming stream and picture
artifacts will be produced.
The thumb rule is: the
smaller the BER value
before error correction,
the better. Notice that
smaller means a bigger
number after the “E”, because there is a “-“ sign:
-5 is smaller than -3! The
smaller the number, the
more bad weather reserve you will get. The BER
value after the error correction will give you an
idea, if artifacts will be
noticeable on the screen
with the current signal.
www.TELE-audiovision.com — 1
1-12/2013 — TELE-audiovision International — 全球发行量最大的数字电视杂志
53
11. 4
DVB-S, DVB-S2, DVB-C, DVB-T,
DVB-T2, DVB-H, ATSC –
the Deviser S7000 can do it all!
The Deviser S7000 is a very versatile instrument that comes from the factory with the ability to handle practically
every modulation. We checked out a number of standards
again to confirm that the S7000 really can work with these
different DVB and ATSC modulations.
5
1, 2. In addition to DVB-T, the S7000 can also analyze DVB-T2 signals and can display the corresponding constellation diagrams.
Interesting with DVB-T2 is the option to introduce a slope to the
modulation called TILT with which the signal can be made more
stable against interference.
3, 4. You might assume that every DVB-T compatible signal analyzer can also analyze DVB-H. We tried it out to make sure. Sure
enough, the S7000 can measure DVB-H without any problems.
5, 6. Next is ATSC. Here‘s where the S7000 shows what it‘s all
about: while most competitor products nearly always offer ATSC
only as an option, Deviser includes it as a standard feature. Even
the constellation diagram for 8VSB is correctly displayed.
7, 8. Naturally the S7000 can also take care of 16VSB modulation;
it‘s amazing how capable this analyzer is for every possible situation.
1
6
2
7
3
8
54 TELE-audiovision International — The World‘s Largest Digital TV Trade Magazine — 1
1-12/2013 — www.TELE-audiovision.com