1,2 & 3,4 ratio analysis updated
•Download as DOCX, PDF•
0 likes•171 views

RATIO analysis

Recommended
Recommended
More Related Content
What's hot
What's hot (20)
Viewers also liked
Viewers also liked (19)
Similar to 1,2 & 3,4 ratio analysis updated
Similar to 1,2 & 3,4 ratio analysis updated (20)
More from Syafiq Zariful
More from Syafiq Zariful (20)
Recently uploaded
Recently uploaded (20)
1,2 & 3,4 ratio analysis updated
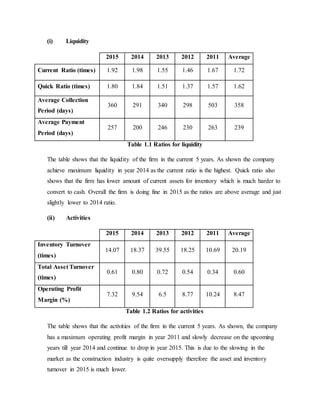
- 1. (i) Liquidity 2015 2014 2013 2012 2011 Average Current Ratio (times) 1.92 1.98 1.55 1.46 1.67 1.72 Quick Ratio (times) 1.80 1.84 1.51 1.37 1.57 1.62 Average Collection Period (days) 360 291 340 298 503 358 Average Payment Period (days) 257 200 246 230 263 239 Table 1.1 Ratios for liquidity The table shows that the liquidity of the firm in the current 5 years. As shown the company achieve maximum liquidity in year 2014 as the current ratio is the highest. Quick ratio also shows that the firm has lower amount of current assets for inventory which is much harder to convert to cash. Overall the firm is doing fine in 2015 as the ratios are above average and just slightly lower to 2014 ratio. (ii) Activities 2015 2014 2013 2012 2011 Average Inventory Turnover (times) 14.07 18.37 39.55 18.25 10.69 20.19 Total Asset Turnover (times) 0.61 0.80 0.72 0.54 0.34 0.60 Operating Profit Margin (%) 7.32 9.54 6.5 8.77 10.24 8.47 Table 1.2 Ratios for activities The table shows that the activities of the firm in the current 5 years. As shown, the company has a maximum operating profit margin in year 2011 and slowly decrease on the upcoming years till year 2014 and continue to drop in year 2015. This is due to the slowing in the market as the construction industry is quite oversupply therefore the asset and inventory turnover in 2015 is much lower.
- 2. (iii) Debt 2015 2014 2013 2012 2011 Average Debt Ratio (%) 54.18 55.99 53.14 45.34 44.07 50.53 Times Interest Earned (times) 13.63 26.09 72.23 16.21 4.76 26.58 Fixed Payment Coverage Ratio (times) 2.22 5.94 3.43 1.68 2.91 3.24 Table 1.3 Ratios for debt The table shows the debt of the firm in the last 5 years. As shown, the company has its debt ratio increased since 2011 until the year 2014. This is due to the increase in current liabilities and long-term debt which overcomes the total amount of equity in the year 2013 but the company were able to pay of some of its debts in the year 2015 because of the strong change in times interest earned from the year 2014 to 2015.
- 3. (iv) Profitability 2015 2014 2013 2012 2011 Average Inventory Turnover (times) 14.07 18.37 39.55 18.25 10.69 20.19 Average Payment Period (days) 257 200 246 230 263 239 Total Asset Turnover (times) 0.61 0.80 0.72 0.54 0.34 0.60 Times Interest Earned (times) 13.63 26.09 72.23 16.21 4.76 26.58 Gross Profit Margin (%) 12.80 10.67 10.86 12.10 19.34 13.15 Operating Profit Margin (%) 7.32 9.54 6.5 8.77 10.24 8.47 Net Profit Margin (%) 5.38 8.59 5.96 5.26 5.79 6.20 Return on Total Assets (%) 11.27 17.70 16.28 24.60 11.65 16.3 Table 1.4 Ratios for Profitability The table shows the profitability of the firm in the last 5 years. As shown, the company achieves maximum efficiency in generating sales using its assets in the year 2014 and thus will give positive outcome in years later. According to the inventory turnover, the company sells its inventory at most in the year 2013 and it has dropped ever since then.
- 4. (i) Market Performance 2015 2014 2013 2012 2011 Average Return on total assets (%) 3.49 6.99 4.44 2.84 1.78 3.91 Return on common equity (%) 7.75 16.11 9.58 5.24 3.22 8.38 Earning per share (RM) 0.05 0.11 0.05 0.03 0.02 0.05 Price/earnings (times) 7.59 2.93 5.14 6.45 9.97 6.41 Price/book ratio (times) 0.55 0.48 0.46 0.34 0.31 0.43 Table 1.4 Ratios for Market Performance The table shows the market performance of Sycal Venture Berhard in the last 5 financial years. The investment attractiveness of its common stock appears to have gradually increased from year 2011 to 2014 and decrease during the year 2015. At the same time, earning per share have the same situation with the return on common equity. Overall the firm market performance is doing fine because the earning power of investment have gradually increase from year 2011 to year 2014 and slightly decrease in 2015.