Pip3
- 1. a r t ic l e s
PIP3 controls synaptic function by maintaining AMPA
receptor clustering at the postsynaptic membrane
Kristin L Arendt1,2,4, María Royo3, Mónica Fernández-Monreal3, Shira Knafo3, Cortney N Petrok2,
Jeffrey R Martens1,2 & José A Esteban1–3
Despite their low abundance, phosphoinositides are critical regulators of intracellular signaling and membrane compartmentalization.
However, little is known of phosphoinositide function at the postsynaptic membrane. Here we show that continuous synthesis and
availability of phosphatidylinositol-(3,4,5)-trisphosphate (PIP3) at the postsynaptic terminal is necessary for sustaining synaptic
© 2010 Nature America, Inc. All rights reserved.
function in rat hippocampal neurons. This requirement was specific for synaptic, but not extrasynaptic, AMPA receptors, nor for
NMDA receptors. PIP3 downregulation impaired PSD-95 accumulation in spines. Concomitantly, AMPA receptors became more
mobile and migrated from the postsynaptic density toward the perisynaptic membrane within the spine, leading to synaptic
depression. Notably, these effects were only revealed after prolonged inhibition of PIP3 synthesis or by direct quenching of this
phosphoinositide at the postsynaptic cell. Therefore, we conclude that a slow, but constant, turnover of PIP 3 at synapses is required
for maintaining AMPA receptor clustering and synaptic strength under basal conditions.
Phosphoinositides (phosphorylated derivatives of phosphatidyl- as long-term potentiation (LTP) and long-term depression (LTD)15.
inositol) are fundamental second messengers in the cell. They are able In addition, AMPARs continuously cycle in and out of the synaptic
to integrate multiple intracellular signaling pathways and modulate a membrane in a manner that does not require synaptic activity. This
large range of cellular activities1. Phosphoinositides are highly com- constitutive trafficking involves both exocytic delivery from intracel-
partmentalized in the cell, and in this fashion they are thought to lular compartments16 and fast exchange with surface extrasynaptic
provide essential spatial and temporal cues for protein recruitment receptors through lateral diffusion17. Still, we know very little about
and intracellular membrane trafficking2. The functional role of phos- the organization and regulation of AMPARs within the synaptic
phoinositide metabolism and compartmentalization has been studied t
erminal. In particular, the potential role of PIP3 in these processes
with great detail at the presynaptic terminal, where phosphoinositide has never been explored.
turnover has been shown to be critical for neurotransmitter vesi- We investigated specific actions of PIP3 at the postsynaptic mem-
cle cycling and synaptic function3. There is also abundant evidence brane, using a combination of pharmacological and molecular tools,
for the relevance of phosphoinositide pathways for synaptic plas- together with electrophysiology, fluorescence imaging and electron
ticity4–8. However, very little is known about specific roles of phos- microscopy. Unexpectedly, we found that PIP 3 was continuously
phoinositides in membrane trafficking at the postsynaptic terminal, required for the maintenance of AMPARs at the synaptic membrane.
despite the importance of neurotransmitter receptor trafficking for This effect was only visible upon direct PIP3 quenching or prolonged
synaptic plasticity9,10. inhibition of its synthesis, suggesting that a slow but constant turn
PIP3 is among the most difficult to characterize phosphoinositides. over of PIP3 is required for sustaining synaptic function.
Basal abundance of PIP3 is extremely low, owing to a tight spatial and
temporal regulation of PIP3 synthesis11. Nevertheless, PIP3 can be RESULTS
found enriched in specific subcellular compartments, such as the tip of PIP3 limits AMPA receptor-mediated synaptic transmission
growing neurites12. Indeed, local accumulation of PIP3 is very impor- As a first step to evaluate the role of PIP3 in synaptic transmission,
tant for the establishment of cell polarity, including neuronal differen- we manipulated endogenous PIP3 availability by overexpressing
tiation and dendritic arborization13,14. The mechanisms by which PIP3 the pleckstrin homology (PH) domain from General Receptor for
exerts its functions are still being elucidated. Nevertheless, a common Phosphoinositides (GRP1) in CA1 neurons from organotypic hippo
theme is the role of PIP3 as a landmark for docking and colocalization campal slice cultures (see Online Methods). This domain has a 650-fold
of a variety of signaling molecules at the plasma membrane1. specificity for PIP3 versus phosphatidylinositol-(4,5)-bisphosphate
AMPA-type glutamate receptors (AMPARs) mediate most excitatory (PIP2) and other phosphoinositides18, and it has a dominant nega-
transmission in the brain, and their regulated addition and removal tive effect on PIP3-dependent processes by restricting binding to the
from synapses leads to long-lasting forms of synaptic plasticity such endogenous targets19. This construct (PH-GRP1) is well expressed
1Neuroscience Program and 2Department of Pharmacology, University of Michigan Medical School, Ann Arbor, Michigan, USA. 3Centro de Biología Molecular “Severo
Ochoa,” Consejo Superior de Investigaciones Científicas (CSIC)/Universidad Autónoma de Madrid, Madrid, Spain. 4Present address: Department of Molecular and Cell
Biology, University of California at Berkeley, Berkeley, California, USA. Correspondence should be addressed to J.A.E. (jaesteban@cbm.uam.es).
Received 3 August; accepted 4 November; published online 13 December 2009; doi:10.1038/nn.2462
36 VOLUME 13 | NUMBER 1 | january 2010 nature NEUROSCIENCE
- 2. a r t ic l e s
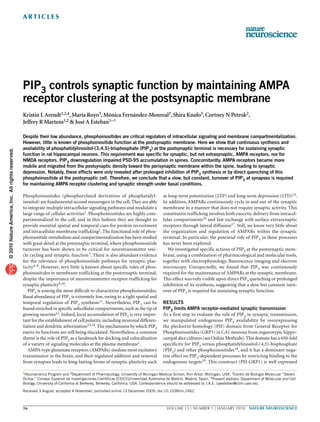
a Figure 1 Expression of PH-GRP1 in hippocampal neurons and specific
binding to PIP3. (a) Expression of PH-GRP1-GFP in the soma, dendrites,
and dendritic spines (inset) of CA1 pyramidal neurons in organotypic
2 µm
cultures. (b) Protein extracts from hippocampal slices expressing GFP
(lanes 1, 4–6), GFP-PH-PLC (lanes 2, 7–9) or GFP-PH-GRP1 (lanes 3,
10–12) were incubated with agarose beads covalently linked to PIP 2
(lanes 5, 8, 11), PIP3 (lanes 6, 9, 12) or control (ctrl) beads (lanes
25 µm
4, 7, 10). Pull-down fractions were analyzed by western blot with
b PH- PH-
GFP PH-PLC PH-GRP1 anti-GFP antibody. Input extracts, lanes 1–3. (c) Extracts similar to
those used in b were incubated with membranes spotted with an array
GFP PLC GRP1 Ctrl PlP2 PlP3 Ctrl PlP2 PlP3 Ctrl PlP2 PlP3
of different phospholipids and phosphoinositides. LPA, lysophosphatidic
GFP-PH acid; LPC, lysophosphocholine; PI, phosphatidylinositol; PE,
(45 kDa) phosphatidylethanolamine; PC, phosphatidylcholine; S1P, sphingosine-
1-phosphate; PA, phosphatidic acid; PS, phosphatidylserine. Membrane-
bound fractions were visualized with anti-GFP. (d) Representative example
GFP
(27 kDa) of BHK cells expressing GFP-PH-GRP1 before (left) and after (right)
1 2 3 4 5 6 7 8 9 10 11 12 stimulation with peroxovanadate (5 min incubation with 30 µM peroxide,
PH-GRP1-
100 µM orthovanadate). Line plots show quantification of fluorescence
c GFP R284C PH-PLC PH-GRP1
intensity across the cell. GFP-PH-GRP1 accumulates at the cell edge
LPA S1P (plasma membrane) after stimulation. A.u., arbitrary units.
LPC Pl(3,4)P2
Pl Pl(3,5)P2
Pl(3)P Pl(4,5)P2
Pleckstrin homology domains have been reported to have cellular
© 2010 Nature America, Inc. All rights reserved.
Pl(4)P Pl(3,4,5)P3
Pl(5)P PA effects independent from their phosphoinositide binding activity20.
PE PS
PC Blank Therefore, we tested whether the depression of AMPAR transmission
by PH-GRP1 was directly due to PIP3 sequestration. We expressed
d 5 µm 5 µm a PH-GRP1 domain with a point mutation that specifically pre-
Peroxovanadate
vents phosphoinositide binding: R284C (ref. 20; see also Fig. 1c).
Paired recordings for AMPAR- and NMDAR-mediated transmission
revealed no difference in synaptic responses between cells expressing
PH-GRP1-R284C and their control neighbors (Fig. 2b). These results
60 60 confirm that the binding and thus sequestering of PIP3 caused the
Fluorescence (a.u.)
Fluorescence (a.u.)
depression of AMPAR-mediated transmission.
40 40
As an independent approach to test the role of PIP3 in synaptic trans-
20 20 mission, we used specific inhibitors of class I phosphatidylinositol-
3-kinases (PI3Ks), the enzymes that generate PIP3. For these experi-
0 0
ments, we pretreated hippocampal slices with 10 µM LY294002 or
100 nM wortmannin for 1 h before whole-cell recordings. (These
in neurons, where it reaches dendritic spines (Fig. 1a). The lack of an drugs were also present in the perfusion solution during the record-
obvious membrane distribution of this recombinant protein is con- ings.) At these concentrations, LY294002 and wortmannin are potent
sistent with the presence of very little PIP3 under basal conditions11. inhibitors of PI3K, without significant effects on phosphoinositide
That is, PH-GRP1 is expected to be well in excess over endogenous kinases required for PIP2 synthesis11. Synaptic responses were evoked
PIP3 (ref. 18), as would be required for PH-GRP1 to act as a domi- at −60 mV and +40 mV holding potentials to obtain AMPA/NMDA
nant negative. Nevertheless, we confirmed the PIP3-binding ability ratios (Fig. 2c). The AMPA/NMDA ratio was significantly lower in
and specificity of PH-GRP1 in vitro (Fig. 1b,c) and in baby-hamster cells treated with LY294002 or wortmannin than in the equivalent
kidney (BHK) cells upon PIP3 upregulation (Fig. 1d). vehicle (DMSO) controls. Finally, depression of AMPA/NMDA ratios
We then monitored the effect of PIP3 quenching with PH-GRP1 on was observed in both cultured and acute hippocampal slices (Fig. 2c,
evoked AMPAR- and NMDAR-mediated responses in CA1 pyramidal right histogram).
neurons using whole-cell simultaneous double recordings. Crucially, To test whether pharmacological inhibition of PI3K and overex-
only CA1 (not CA3) cells express the recombinant protein. Therefore, pression of PH-GRP1 depressed synaptic transmission by the same
PIP3 levels are altered only in the postsynaptic cell when monitor- mechanism, we compared AMPAR and NMDAR responses between
ing CA3-to-CA1 synaptic transmission. Quenching of PIP 3 with PH-GRP1-expressing and control neurons, after pretreating the slices
PH-GRP1 caused a significant and selective depression of AMPAR with 10 µM LY294002 for 1 h. (LY294002 was also present during the
synaptic responses compared to those in control neighboring pyrami- recordings.) PH-GRP1 expression did not alter AMPAR nor NMDAR
dal neurons (Fig. 2a). Recordings at +40 mV revealed no effect on currents with respect to those in the control neuron when PIP3 syn-
NMDAR transmission. (For simplicity, only average values are plotted thesis was inhibited (Fig. 2d). This result confirms that PH-GRP1 and
in the graphs, but statistical comparisons are always calculated for LY294002 depress synaptic transmission through the same pathway,
infected–uninfected paired data.) Expression of PH-GRP1 did not most likely by limiting PIP3 availability.
affect passive membrane properties of the cell, such as holding current This observed depression of AMPAR-mediated transmission upon
or input resistance, indicating that cell-wide ion channel conduct- PIP3 depletion suggests that PIP3 may be a limiting factor for AMPAR
ances were not altered. In addition, cell size, as reported by whole- synaptic function. If this is the case, enhanced PIP3 synthesis might
cell capacitance, was not affected either (Supplementary Fig. 1). lead to increased AMPAR responses. To test this possibility, we gener-
Therefore, overnight expression of this construct does not seem to ated a constitutively active PI3K by permanently targeting its catalytic
have any general toxic effect in neurons from organotypic slices. subunit (p110) to the plasma membrane using a myristoylation tag
nature NEUROSCIENCE VOLUME 13 | NUMBER 1 | january 2010 37
- 3. a r t ic l e s
Figure 2 Bidirectional modulation of a AMPA NMDA c DMSO LY Wrt
Culture Acute
AMPA-receptor mediated currents by 75
EPSC amplitude (pA)
PH-GRP1 1.0
n = 20 n = 15
PIP 3. (a,b) Comparison of evoked synaptic
AMPA/NMDA
P = 0.01
Normalized
Uninf Inf 50 P = 0.006
responses from pairs of neighboring CA1 P = 0.006 0.5
P = 0.009
neurons expressing PH-GRP1 (a) or
n = 12
n = 18
n = 13
25
n=7
n=5
50 pA
PH-GRP1-R284C (b), and control
40 pA
20 ms 0
(uninfected) neurons, recorded at −60 mV 20 ms 0 DMSO LY Wrt DMSO LY
Uninf Inf Uninf Inf
(AMPAR excitatory postsynaptic currents
(EPSCs)) and +40 mV (NMDAR EPSCs). b PH-GRP1-
R284C
AMPA NMDA d PH-GRP1 + AMPA NMDA
EPSC amplitude (pA)
LY294002 n = 16 n = 15
n, number of cell pairs; left (all panels),
EPSC amplitude (pA)
75 80
Uninf Inf n = 14 n = 13 Uninf Inf
example traces from uninfected (uninf) 60
50
and infected (inf) neurons. Significance 40
calculated by Wilcoxon text for paired data 25
20 pA
20
20 pA
(individual pairs of infected versus uninfected 20 ms 0
0 20 ms Uninf Inf Uninf Inf
cells). (c) Comparison of evoked synaptic Uninf Inf Uninf Inf
responses from CA1 neurons pretreated for 1 h e Myr-p110
AMPA
P = 0.01
NMDA
with 10 µM LY294002 (LY) or 100 nM wortmannin (Wrt) or with vehicle control
EPSC amplitude (pA)
Uninf Inf 75 n = 23
n = 15
(0.05% DMSO). The AMPA/NMDA ratio is calculated from the size of the AMPAR- and
NMDAR-mediated responses recorded at −60 mV and +40 mV, respectively. Experiments 50
were carried out on organotypic cultured slices (left bars) or on acute slices (14 d postnatal;
80 pA
25
right bars). n, number of cells; P-values calculated by Mann-Whitney test. (d,e) Similar to 20 ms
a,b, with slices expressing PH-GRP1 (d) or Myr-p110 (e). Slices in d were pretreated for 0
Uninf Inf Uninf Inf
1 h with 10 µM LY294002. Error bars, s.e.m. in all cases.
© 2010 Nature America, Inc. All rights reserved.
(Myr-p110; ref. 21). The efficacy of this construct to upregulate PIP3 example, ref. 22) but also by PIP3 (ref. 23). To test whether this is the
signaling was confirmed by monitoring Akt phosphorylation in CA1 case for AMPARs, we recorded extrasynaptic responses evoked by
neurons expressing Myr-p110 (Supplementary Fig. 2). We compared bath application of AMPA (100 nM) from CA1 neurons expressing
evoked AMPAR and NMDAR responses between infected and unin- PH-GRP1 and from neighboring control cells. Recordings were car-
fected neighboring pyramidal neurons. Neurons expressing Myr-p110 ried out in the presence of 0.5 µM tetrodotoxin (to prevent action
showed a significant potentiation of AMPAR transmission (Fig. 2e) potential firing) and 10 µM cyclothiazide (to prevent AMPAR
with no alteration of NMDAR responses. Passive membrane proper- desensitization). Whole-cell AMPA-evoked currents were similar in
ties including holding current, input resistance and capacitance were PH-GRP1-expressing neurons and in control neighboring cells (Fig. 3d).
not different between infected and uninfected cells (Supplementary This result suggests that the requirement for PIP 3 is specific for
Fig. 1). These results support the interpretation that PIP3 is a limiting synaptic AMPARs.
factor controlling AMPAR synaptic function.
Postsynaptic PIP3 is necessary for long-term potentiation
Gradual synaptic depression upon PIP3 synthesis inhibition There have been conflicting results on the role of PIP3 in LTP induc-
Previous reports using PI3K inhibitors have yielded conflicting results tion, maintenance or both4,5. However, pharmacological inhibition
on the role of PIP3 on basal synaptic transmission4,5. However, the of PI3K would affect both pre- and postsynaptic cells. In addition, as
magnitude of the decrease in PIP3 abundance upon blockade of its discussed above, different incubation times with PI3K inhibitors may
synthesis will depend on its metabolic turnover under basal condi- yield variable depletion of basal PIP3 amounts. To circumvent these
tions. Thus, short incubations with PI3K inhibitors may be ineffective complications, we decided to test the role of PIP3 in LTP by directly
if basal PIP3 turnover is slow. To directly address this possibility, we quenching this phosphoinositide in the postsynaptic cell using
incubated hippocampal slices with 10 µM LY294002 for up to 2 h while PH-GRP1 in organotypic hippocampal slices. This experimental
monitoring AMPAR synaptic responses using field recordings. manipulation does not affect NMDAR synaptic currents (Fig. 2a),
Stable baselines of a minimum of 25 min were obtained from and it therefore rules out potential effects on LTP induction.
ippocampal slices before infusion of 10 µM LY294002 or 0.05%
h Whole-cell recordings were obtained in an interleaved manner
DMSO (vehicle control). Slices treated with 10 µM LY294002 from neurons expressing PH-GRP1 and from control, uninfected
showed a slow and gradual run-down of synaptic transmission, neurons. LTP was induced according to a pairing protocol (see
which started to become significant 60–80 min after the onset of Online Methods). Control cells showed significant potentiation of
PI3K inhibition (Fig. 3a,b). In contrast, DMSO-treated slices showed transmission compared to the unpaired pathway that did not receive
a small decrease in synaptic responses, which was not significant LTP-inducing stimulation (Fig. 4a,b). In contrast, LTP expression was
after 2 h of infusion. As a control, treatment with LY294002 did not abolished in cells expressing PH-GRP1.
affect fiber volley amplitude (Fig. 3a,c), suggesting that presynaptic
excitability was not altered. Therefore, these results confirm our PIP3 requirements for cycling and regulated AMPA receptors
previous conclusion on the importance of PIP3 for the maintenance Most AMPARs in the hippocampus are composed of GluA1/GluA2
of AMPAR synaptic function. In addition, these data support the or GluA3/GluA2 subunit combinations24 (subunit nomenclature
interpretation that PIP 3 undergoes a slow turnover under basal according to ref. 25). These two populations seem to reach their
conditions, which is only revealed after prolonged inhibition of synaptic targets according to different pathways, with GluA2/GluA3
PIP3 synthesis. (Note that recordings in Fig. 2c started 1 h after continuously cycling in and out of synapses and GluA1-containing
application of LY294002.) receptors undergoing acute, activity-dependent synaptic delivery26
The function of some ion channels has been shown to be directly (but see also ref. 27). Therefore, we decided to separately test the PIP3
modulated by phosphoinositides, more typically by PIP2 (see, for requirements of these two populations.
38 VOLUME 13 | NUMBER 1 | january 2010 nature NEUROSCIENCE
- 4. a r t ic l e s
a DMSO 10 µM LY294002 Figure 3 Inhibition of PIP3 synthesis produces a slow and gradual
depression of AMPA receptor-mediated transmission. (a) Examples of
Baseline 120–140 min Baseline 120–140 min
evoked field excitatory postsynaptic potentials (fEPSP) obtained from
hippocampal slices 5–25 min before (baseline) or 120–140 min after
0.5 mV
(120–140 min) treatment with DMSO (left) or 10 µM LY294002 (right).
Presynaptic fiber volleys and fEPSPs are indicated. (b) Time course of the
5 ms
Fiber volley fEPSP Fiber volley fEPSP slope of fEPSP responses from hippocampal slices treated with 10 µM
LY294002 or DMSO. Values are normalized to the average slope before
b Drug application
drug application. n, number of slices. Significance for the comparison
1.0 between slices treated with DMSO and LY294002 calculated by
Normalized fEPSP slope
Mann-Whitney test. (c) The amplitude of the presynaptic fiber volley
0.8
was analyzed from the experiments shown in b. Values are normalized to
P = 0.03
0.6 the average fiber volley amplitude before drug application. No significant
0.4 change in fiber volley amplitude was observed over the time course.
(d) Time course of whole-cell currents recorded from CA1 pyramidal
0.2 DMSO (n = 5)
LY294002 (n = 6) neurons infected with PH-GRP1 or uninfected control neurons during the
0 application of 100 nM AMPA (bar). n, number of cells; error bars, s.e.m.
0 20 40 60 80 100 120 140 in all cases.
Time (min)
c Drug application
LY294002 (10 µM) on hippocampal slices expressing either
1.0 GluA2(R607Q) or GluA1 plus tCaMKII (Fig. 4d).
Normalized fiber
volley amplitude
0.8 These experiments using recombinant receptors fit well with our
© 2010 Nature America, Inc. All rights reserved.
0.6 results monitoring endogenous AMPARs during basal synaptic trans-
0.4
DMSO (n = 5)
mission and LTP. Together, these data strongly suggest that PIP 3 is a
0.2 LY294002 (n = 6) common requirement for all populations of AMPARs.
0
0 20 40 60 80 100 120
Time (min) AMPA receptor accumulation at spines upon PIP3 depletion
d 100 nM AMPA The results described above suggest that PIP3 availability affects syn-
0 aptic, but not extrasynaptic, AMPARs. Therefore, we hypothesized
AMPA current (pA)
–100 that PIP3 may play a local role in AMPAR function at synapses. To
–200
address this hypothesis, we evaluated the distribution of AMPARs at
Uninfected (n = 12) dendritic spines upon PIP3 depletion.
–300 PH-GRP1 (n = 14) We used biolistic gene delivery into organotypic hippocampal slices
–400 to express EGFP-tagged GluA2 together with either RFP (control) or
0 5 10 15 20
Time (min) an RFP-tagged PH-GRP1. The partition of GluA2 between spines and
dendrites was estimated from the intensity of the GFP signal in the
To this end, we expressed individual enhanced green fluorescent spine head versus the adjacent dendritic shaft (see Online Methods).
protein (EGFP)-tagged AMPAR subunits along with either RFP or an Similarly, the surface distribution of the recombinant receptor in
RFP-tagged PH-GRP1 in organotypic slice cultures using a biolistic spines and dendrites was assessed by immunostaining with an anti-
delivery system (see Online Methods). When overexpressed, these body to GFP coupled to an infrared fluorophore (anti-GFP–Cy5)
subunits form homomeric receptors, which can be detected at syn- under non-permeabilized conditions. (The GFP tag is placed at the
apses from their inward rectification properties28,29. (In the case of extracellular N terminus of the receptor; see Fig. 5a for examples and
GluA2, we used the genomic sequence, lacking post-transcriptional Supplementary Fig. 3 for a control of the non-permeabilizing condi-
mRNA sequence editing: R607Q.) Recombinant GluA2 receptors tions for surface immunostaining.)
behave like endogenous GluA2/GluA3 heteromers28; thus, they can GluA2 partitioned almost equally between the spine head and the
be used to monitor the constitutively cycling population of AMPARs. adjacent dendrite when expressed with RFP (Fig. 5b). Unexpectedly,
When GluA2(R607Q) was expressed with RFP, the rectification index expression with PH-GRP1 led to a small but significant increase in the
was significantly higher than that in untransfected cells (Fig. 4c), amount of GluA2 receptor in the spine (Fig. 5b). Notably, PH-GRP1
indicating presence of the recombinant receptor at the synapse. In produced a similar accumulation of GluA2 at the plasma membrane
contrast, when GluA2(R607Q) was expressed with PH-GRP1, this (surface) of the spine (Fig. 5b). This redistribution seemed to be local,
increase in rectification was abolished (Fig. 4c), indicating that PIP3 is as long-range distribution of GluA2 along the primary apical den-
needed for the delivery and/or stability of this population of AMPARs drite was not altered by PH-GRP1 expression (Supplementary Fig. 4).
at synapses. These results were replicated using a pharmacological approach to
We used similar assays with recombinant GluA1 subunits to inhibit PIP3 synthesis (10 µM LY294002; Fig. 5c).
monitor the activity-regulated population of AMPARs29. GluA1 Crucially, spine size (estimated from cytosolic GFP distribution)
was driven into synapses when expressed with a constitutively and distribution of the PIP3 precursor, PIP2, at spines were not altered
active form of αCaMKII (tCaMKII), as judged from the increase upon PIP3 blockade (Supplementary Fig. 5). Therefore, these com-
in the rectification index (Fig. 4c). However, when PH-GRP1 was bined data indicate that PIP3 depletion led to a local redistribution
expressed with GluA1 and tCaMKII, this increase in rectification of AMPARs, which, unexpectedly, accumulated in spines. As will be
was not observed (Fig. 4c). This finding suggests that PIP 3 is also shown below, ultrastructural analyses indicated that this receptor
necessary for the synaptic presence of this population of AMPARs. accumulation occurred preferentially on the extrasynaptic region of
These results were essentially replicated using the PI3K inhibitor the spine plasma membrane.
nature NEUROSCIENCE VOLUME 13 | NUMBER 1 | january 2010 39
- 5. a r t ic l e s
Figure 4 PIP3 is required for LTP and
affects both constitutively cycling and 3
P = 0.02 a b
EPSC fold potentiation
regulated populations of AMPA receptors.
EPSC fold potentiation
LTP 2
(a) Time course of AMPAR-mediated synaptic 2 induction
responses before and after LTP induction in
control (uninfected) CA1 neurons and in 1
1
PH-GRP1-expressing cells. (b) Quantification
n=7
n=9
n=7
n=8
Uninfected (n = 7)
of average synaptic potentiation (LTP pathway)
PH-GRP1 (n = 9)
from the last 5 min of the time course in 0 0
0 10 20 30 Uninf PH-GRP1 Uninf PH-GRP1
a. One of the stimulating electrodes was Time (min) LTP pathway Unpaired pathway
turned off during LTP induction (unpaired
pathway). (c) CA1 neurons were transfected c d
with different combinations of GluA2(R607Q)
or GluA1 plus constitutively active CaMKII
(tCaMKII), together with RFP or RFP-PH-
GRP1 as indicated. Synaptic responses were 2 2 P = 0.004 P = 0.02
Normalized rectification
Normalized rectification
evoked at −60 mV and +40 mV to quantify P = 0.01 P = 0.0005
inward rectification. Rectification indexes were
normalized to the average value obtained 1 1
from untransfected cells (2.0 ± 0.3).
n = 12
n = 12
n = 12
n = 12
n = 12
n = 11
n = 13
n = 13
n = 16
n=9
n=9
Representative traces of the recordings are
plotted above their respective columns in 0 0
Untran RFP PH-GRP1 RFP PH-GRP1 DMSO LY DMSO LY DMSO LY
the graph. (d) As in c, with the indicated
© 2010 Nature America, Inc. All rights reserved.
GluA2(R607Q) GluA1 + tCaMKll Uninfected GluA2(R607Q) GluA1 + tCaMKll
recombinant proteins and slices treated
with 10 µM LY294002 or DMSO (vehicle control) for 1 h (LY294002 or DMSO were also present during the recordings). Rectification index for
uninfected, DMSO-treated cell was 2.4 ± 0.2. In all cases: n, number of cells; error bars, s.e.m.; significance calculated by Mann-Whitney test;
scale bars 20 pA, 10 ms. EPSC, excitatory postsynaptic current.
PIP3 contributes to PSD-95 accumulation in spines Therefore, these results strongly suggest that PIP3 availability is
PSD-95 is a synaptic scaffolding molecule that critically controls important for PSD-95 enrichment in spines.
the accumulation of AMPARs at synapses30, and accordingly, it is
a determining factor for the maintenance of synaptic strength 31–33. PIP3 regulates AMPA receptor mobility at the spine surface
Therefore, we decided to test whether PIP3 may affect PSD-95 accu- PSD-95 is a critical factor for the stability of AMPARs at the synaptic mem-
mulation at synapses. To this end, we expressed GFP-tagged PSD-95 brane30. Therefore, the results shown above suggest that the depression of
together with plain (cytosolic) RFP or with RFP-PH-GRP1 in CA1 synaptic strength upon PIP3 depletion may be due to a reduction in PSD-
neurons from organotypic slice cultures (see Fig. 6a for representative 95–mediated anchoring of AMPARs at synapses. As an initial approach
examples). The accumulation of PSD-95 in spines was then quantified to test this hypothesis, we evaluated the mobility of AMPARs at the sur-
from the ratio of GFP fluorescence at the spine head to that on the face of dendritic spines using fluorescence recovery after photobleaching
adjacent dendritic shaft. (FRAP) and Super-Ecliptic-pHluorin-tagged GluA2 (SEP-GluA2).
Expression along with PH-GRP1 significantly reduced the accumu- Super-ecliptic-pHluorin is a highly pH-sensitive version of GFP, which
lation of PSD-95 in spines, relative to that in RFP-expressing neurons has been previously used to track surface AMPARs34.
(Fig. 6b). This reduction was detected across the whole population of SEP-GluA2 receptors were expressed in organotypic hippocam-
spines (left shift in the cumulative distribution). As mentioned ear- pal slices, and PIP3 abundance was reduced by treatment with the
lier, PIP3 depletion did not alter spine size (Supplementary Fig. 5a). PI3K inhibitor LY294002. Spines expressing SEP-GluA2 were photo
bleached and the extent of fluorescence recovery was measured over
GluA2-GFP + RFP
a GFP RFP Cy5
30 min (see representative examples in Fig. 6c). Approximately 25%
of the SEP-GluA2 signal was recovered in the spine over a time course
2 µm Figure 5 Depletion of PIP3 leads to the accumulation of AMPA receptors
in dendritic spines. (a) Representative confocal images of total receptor
GluA2-GFP + RFP-PH-GRP1 (GFP, green) and surface anti-GFP labeling (Cy5, purple) in dendritic
GFP RFP Cy5 spines from neurons expressing GluA2-GFP with RFP or with RFP-PH-
GRP1 (RFP, red). (b) Quantification of fluorescence intensity at spines
versus the adjacent dendritic shaft from neurons like those in a. Total
1 µm receptor quantified from GFP fluorescence, surface receptor from Cy5
signal. Values of spine/dendrite ratios are normalized to the control
b Total Surface c Total Surface (RFP-expressing neurons). Actual (non-normalized) ratios for the control
P = 0.02
Normalized spine/dendrite
(average ± s.e.m.): total, 1.15 ± 0.2; surface, 1.0 ± 0.1. n, number
Normalized spine/dendrite
P = 0.03
1.5 P = 0.007 1.5 P = 0.002
of spines from 11 (GluA2 + RFP) or 25 (GluA2 + PH-GRP1) different
neurons. (c) Neurons expressing GluA2-GFP were treated with 10 µM
1.0 1.0
LY294002 or DMSO (vehicle control) for 1 h before fixation and imaging.
Total and surface receptors are plotted as in b. Values of spine/dendrite
n = 204
n = 287
n = 204
n = 287
n = 156
n = 151
n = 156
n = 151
0.5 0.5
ratios are normalized to the control (DMSO-treated neurons). The actual
(non-normalized) values for the control were (average ± s.e.m.): 1.5 ± 0.1
0 0
RFP PH- RFP PH- DMSO LY DMSO LY (total), 1.1 ± 0.2 (surface). n, number of spines from 25 (DMSO) or 22
GRP1 GRP1 (LY294002) different neurons.
40 VOLUME 13 | NUMBER 1 | january 2010 nature NEUROSCIENCE