CAPACITY PLANNING
•Als PPT, PDF herunterladen•
23 gefällt mir•33,771 views

Contents of Presentation- Capacity Planning: - Meaning - Forecasting - Reasons - Importance - Examples - Capacity Terminology - Efficiency & Utilization - Calculation of capacity Utilization - Determinants of Effective Capacity - Calculating Processing Requirements - Capacity Planning Process - Planning Over a Time Horizon - Economies of Scale - Optimal Rate of Output -Capacity Planning Alternatives Evaluating Models Cost Volume Analysis: Break-even Analysis Decision Theory Financial Analysis Waiting-Line Analysis - PROCESS PLANNING Methods - INTERACTION OF PLANNING FUNCTIONS.. -

Empfohlen
Weitere ähnliche Inhalte
Was ist angesagt?
Was ist angesagt? (20)
Andere mochten auch
Andere mochten auch (20)
Ähnlich wie CAPACITY PLANNING
Ähnlich wie CAPACITY PLANNING (20)
Mehr von Shilpi Panchal
Mehr von Shilpi Panchal (17)
Kürzlich hochgeladen
Kürzlich hochgeladen (20)
CAPACITY PLANNING
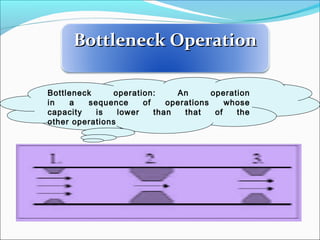
- 1. Bottleneck OperationBottleneck Operation Bottleneck operation: An operation in a sequence of operations whose capacity is lower than that of the other operations
- 3. Capacity planning Capacity is the maximum output rate of a production or service facility. Capacity also includes Equipment Space Employee skills 02/09/17 3
- 4. The basic questions in capacityThe basic questions in capacity planningplanning
- 5. Capacity planning is the process of establishing the output rate that may be needed at a facility. 02/09/17 5
- 6. Reasons of capacityReasons of capacity planningplanning
- 7. Impacts ability to meet future demands Affects operating costs Major determinant of initial costs Involves long-term commitment Affects competitiveness Affects ease of management Importance of Capacity Decisions 02/09/17 7
- 8. Measuring Capacity Examples Type of Business Input Measures of Capacity Output Measures of Capacity Car manufacturer Labor hours Cars per shift Hospital Available beds Patients per month Pizza parlor Labor hours Pizzas per day Retail store Floor space in square feet Revenue per foot 02/09/17 8
- 9. Capacity terminologyCapacity terminology Design capacityDesign capacity ( Max. Capacity ) is the maximum theoretical output of a systemis the maximum theoretical output of a system Normally expressed as a rateNormally expressed as a rate Under ideal conditionsUnder ideal conditions Effective capacityEffective capacity ( Best Operating Level ) is the capacity a firm expects to achieve givenis the capacity a firm expects to achieve given current operating constraintscurrent operating constraints Often lower than design capacityOften lower than design capacity Under ideal conditionsUnder ideal conditions Actual outputActual output ( Capacity Used ) is rate of output actually achievedis rate of output actually achieved Cannot exceed effective capacity.
- 10. Utilization is the percent of design capacity achieved Efficiency is the percent of effective capacity achieved Utilization = Actual Output/Design CapacityUtilization = Actual Output/Design Capacity Efficiency = Actual Output/Effective CapacityEfficiency = Actual Output/Effective Capacity Utilization and EfficiencyUtilization and Efficiency Both measures expressed as percentagesBoth measures expressed as percentages
- 11. Calculating Capacity Utilization Measures how much of the available capacity is actually being used: Measures effectiveness Use either effective or design capacity in denominator ( )100% capacity rateoutputactual nUtilizatio = 02/09/17 11
- 12. Efficiency/UtilizationEfficiency/Utilization Actual output 36 units/day Efficiency = = = 90% Effective capacity 40 units/ day Actual output 36 units/day Utilization = = = 72% Design capacity 50 units/day Design capacity = 50 trucks/day Effective capacity = 40 trucks/day Actual output = 36 units/day Ex.Ex.
- 13. Facilities (size, location, layout, heating, lighting, ventilations) Product and service factors (similarity of products) Process factors (productivity, quality) Human factors (training, skills, experience, motivations, absentation, turnover) Policy factors (overtime system, no. of shifts) Operational factors (scheduling problems, purchasing requirements, inventory shortages) Supply chain factors (warehousing, transportation, distribution) External factors (product standards, government agencies, pollution standard) Determinants of Effective CapacityDeterminants of Effective Capacity
- 14. P r o d u c t A n n u a l D e m a n d S t a n d a r d p r o c e s s in g t im e p e r u n it ( h r . ) P r o c e s s in g t im e n e e d e d ( h r . ) # 1 # 2 # 3 4 0 0 3 0 0 7 0 0 5 . 0 8 . 0 2 . 0 2 , 0 0 0 2 , 4 0 0 1 , 4 0 0 5 , 8 0 0 Calculating Processing RequirementsCalculating Processing Requirements A dept. works 8-hour shift, 250 days/year annual capacity is 250*8 = 2000 hours, number of machines required = 5,800 hours/2,000 hours = 2.90 machines then we need three machines to handle the required volume
- 15. Forecast Demand Compute Needed Capacity Compute Rated Capacity Evaluate Capacity Plans Implement Best Plan Qualitative Factors (e.g., Skills) Select Best Capacity Plan Develop Alternative Plans Quantitative Factors (e.g., Cost) Capacity Planning Process
- 16. Modify capacityModify capacity Use capacityUse capacity Planning Over a Time HorizonPlanning Over a Time Horizon Intermediate-Intermediate- rangerange planningplanning Subcontract Add personnel Add equipment Build or use inventory Add shifts Short-rangeShort-range planningplanning Schedule jobs Schedule personnel Allocate machinery* Long-rangeLong-range planningplanning Add facilities Add long lead time equipment * * Limited options exist* Limited options exist 02/09/17 16
- 17. Economies of Scale Economies of scale If the output rate is less than the optimal level, increasing output rate results in decreasing average unit costs Diseconomies of scale If the output rate is more than the optimal level, increasing the output rate results in increasing average unit costs
- 18. Minimum cost Averagecostperunit 0 Rate of output Production units have an optimal rate of output for minimal cost. Minimum average cost per unit
- 19. 5-19 Minimum cost & optimal operating rate are functions of size of production unit.Averagecostperunit 0 Small plant Medium plant Large plant Output rate
- 20. 02/09/17 20
- 21. Cost Volume Analysis: Breakeven Analysis Technique for evaluating process & equipment alternatives Objective: Find the point at which total cost equals total revenue Assumptions •Revenue & costs are related linearly to volume •All information is known with certainty •No time value of money
- 22. 22 Break-Even Analysis Fixed costs: costs that continue even if no units are produced: depreciation, taxes, debt, mortgage payments Variable costs: costs that vary with the volume of units produced: labor, materials, portion of utilities
- 23. Breakeven Chart Fixed cost Variable cost Total cost line Total revenue line ProfitBreakeven point Total cost = Total revenue Volume (units/period) CostinDollars Loss
- 24. 5-24 1. One product is involved 2.Everything produced can be sold 3. Variable cost per unit is the same regardless of volume 4.Fixed costs do not change with volume 5.Revenue per unit constant with volume 6.Revenue per unit exceeds variable cost per unit Assumptions of Cost-Volume Analysis
- 25. 5-25 Decision Theory Helpful tool for financial comparison of alternatives under conditions of risk or uncertainty Suited to capacity decisions
- 26. Small Box Office Medium Box Office Large Box Office Small Box Office Medium Box Office Large Box Office Sign with Movie Co. Sign with TV Network 200,000 1,000,000 300,000 900,000 900,000 900,000 .3 .6 .1 .3 .6 .1 ER 900,000 ER 690,000 ER 900,000
- 27. 5-27 Financial Analysis Cash Flow - the difference between cash received from sales and other sources, and cash outflow for labor, material, overhead, and taxes. Present Value - the sum, in current value, of all future cash flows of an investment proposal.
- 28. Net Present Value F = future value P = present value i = interest rate N = number of years N i F P )1( + =
- 29. 5-29 Waiting-Line Analysis Useful for designing or modifying service systems Waiting-lines occur across a wide variety of service systems Waiting-lines are caused by bottlenecks in the process Helps managers plan capacity level that will be cost- effective by balancing the cost of having customers wait in line with the cost of additional capacity
- 30. PROCESS PLANNING Design Machine Tool Scheduling and Production Control Process Planning
- 31. What methods were used? Machining methods Pressworking Welding/fabrication Casting Powder materials Layered deposition Others
- 33. Machining Methods: Subtractive techniques Initial Stock Slotting Drilling Final Product
- 35. ENGINEERING DESIGN MODELING 10" +0.01 -0.01 1'-4" +0.01 -0.01 4" +0.01 -0.01 7" +0.05 -0.05 5" +0.01 -0.01 3" +0.01 -0.01 2" +0.01 -0.01 0.001 A B A B S.F. 64 u inch U* - * CSG MODEL Fa c e Lo o p Ed g e V e rt e x B-REP MODEL
- 36. INTERACTION OF PLANNING FUNCTIONS GEOMETRIC REASONING PROCESS SELECTION CUTTER SELECTION MACHINE TOOL SELECTION SETUP PLANNING FIXTURE PLANNING CUTTER PATH GENERATION • global & local geometry • process capability • process cost • available tools • tool dimension and geometry • geometric constraints • machine availability, cost • machine capability • feature relationship • approach directions • process constraints • fixture constraints • fixture element function • locating, supporting, and clamping surfaces • stability • feature merging and split • path optimization • obstacle and interference avoidance
Hinweis der Redaktion
- This slide outlines the capacity planning process. It is probably useful to discuss, at least briefly, each step in the process. If time permits, the boxes representing Quantitative factors, Qualitative factors, Evaluation of Capacity Plans, and Selecting the Best Capacity Plan, merit the most attention.
- This chart introduces breakeven analysis and the breakeven or crossover chart. As you discuss the assumptions upon which this techniques is based, it might be a good time to introduce the more general topic of the limitations of and use of models. Certainly one does not know all information with certainty, money does have a time value, and the hypothesized linear relationships hold only within a range of production volumes. What impact does this have on our use of the models?