SlideShare ist ein Scribd-Unternehmen logo
1 von 8
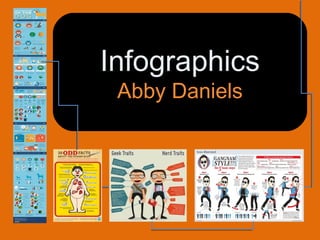
Infographics
Abby Daniels
What is an infographic?
You are looking at
one! Infographics
are a funfun and quickquick
way to learn about a
topic without a ton of
heavy reading.
There are many
different stylesdifferent styles of
infographics and
datadata visualizationsvisualizations,
but the ultimate goal
for all infographics is
to be sharedshared.
A data-richdata-rich
visualizationvisualization of a story
A tool to educateeducate
and informinform.
The Contents of an Infographic
Styles of Infographics
Status
Comparison
Chronology
Resource
Why use infographics in the
classroom?
Infographics are:
• Eye-Catching
• Engaging
• Full of rich data
• Easily available online
Infographics can:
• Compare or identify
relationships between data
• Build or assess knowledge
• Ignite critical thinking
• Inspire creativity
Classroom Applications
Anticipatory
Activity
Have students view,
discuss, and
generate ideas
before covering a
unit.
Create Your Own
Create an infographic that
displays essential
information to be learned
in a given unit.
HaveStudentsCreate!
Exploring Infographics
Let’s look at some examples! Links to all infographics included in
this presentation are available on the rmsTechPD wiki . You can
also search on Google Images for others.
As you view multiple infographics consider the following questions:
•What is the purpose of the infographic? Who is the intended
audience?
•How does the use of color, shapes, pictures, and organizational
tools add or subtract from the comprehension of the data?
•How would an infographic like this, or of this style be useful to you
in your class?
Creating Infographics
The following websites are dedicated to free
infographic design:
•Visual.ly
•Easel.ly
•Infogr.am
•Piktochart
•Many Eyes
•Goodlabs

Weitere ähnliche Inhalte

Ähnlich wie Infographics: A Fun and Quick Way to Learn

Infographics: E-volving Instruction for Visual Literacy
Infographics: E-volving Instruction for Visual LiteracyInfographics: E-volving Instruction for Visual Literacy
Infographics: E-volving Instruction for Visual LiteracyMelanie Parlette-Stewart
 
Empowering Future-Ready Students: Teaching AI Ethics and Information Literacy...
Empowering Future-Ready Students: Teaching AI Ethics and Information Literacy...Empowering Future-Ready Students: Teaching AI Ethics and Information Literacy...
Empowering Future-Ready Students: Teaching AI Ethics and Information Literacy...IL Group (CILIP Information Literacy Group)
 
The civil rights movement ppt for itc 1 kj 7
The civil rights movement ppt for itc 1 kj 7The civil rights movement ppt for itc 1 kj 7
The civil rights movement ppt for itc 1 kj 7hollowaymm
 
All about Infographics
All about Infographics All about Infographics
All about Infographics Renee Hobbs
 
The civil rights movement ppt for itc 1 kj 5
The civil rights movement ppt for itc 1 kj 5The civil rights movement ppt for itc 1 kj 5
The civil rights movement ppt for itc 1 kj 5hollowaymm
 
The civil rights movement ppt for itc 1 kj 6
The civil rights movement ppt for itc 1 kj 6The civil rights movement ppt for itc 1 kj 6
The civil rights movement ppt for itc 1 kj 6hollowaymm
 
Infographics for Nonprofits - Forefront Member Breakfast Series
Infographics for Nonprofits - Forefront Member Breakfast SeriesInfographics for Nonprofits - Forefront Member Breakfast Series
Infographics for Nonprofits - Forefront Member Breakfast SeriesForefront
 
Regis university learning technology fair kim hosler_ infographics for st...
Regis university   learning technology fair   kim hosler_ infographics for st...Regis university   learning technology fair   kim hosler_ infographics for st...
Regis university learning technology fair kim hosler_ infographics for st...Kim Hosler, PhD
 
Infographic evernote
Infographic evernoteInfographic evernote
Infographic evernoteaswinehart
 
Data Visualisation Sara Miller McCune founded SAGE
Data Visualisation Sara Miller McCune founded SAGEData Visualisation Sara Miller McCune founded SAGE
Data Visualisation Sara Miller McCune founded SAGEOllieShoresna
 
Data visualisation sara miller mc cune founded sage
Data visualisation sara miller mc cune founded sageData visualisation sara miller mc cune founded sage
Data visualisation sara miller mc cune founded sageAISHA232980
 
The civil rights movement ppt for itc 1 kj 4
The civil rights movement ppt for itc 1 kj 4The civil rights movement ppt for itc 1 kj 4
The civil rights movement ppt for itc 1 kj 4hollowaymm
 
Information Literacy meets Employability
Information Literacy meets EmployabilityInformation Literacy meets Employability
Information Literacy meets Employabilitydbslibrary
 
Separating Myth from Truth in Data Visualisation
Separating Myth from Truth in Data VisualisationSeparating Myth from Truth in Data Visualisation
Separating Myth from Truth in Data VisualisationAndy Kirk
 
higher thinking skills through IT-based project part 2
higher thinking skills through IT-based project part 2higher thinking skills through IT-based project part 2
higher thinking skills through IT-based project part 2miss yhda
 
Digital Literacy Lens for the SCONUL 7 pillars model of IL
Digital Literacy Lens for the SCONUL 7 pillars model of ILDigital Literacy Lens for the SCONUL 7 pillars model of IL
Digital Literacy Lens for the SCONUL 7 pillars model of ILHelen Howard
 
Data visualisation23 data visualisation
Data visualisation23 data visualisationData visualisation23 data visualisation
Data visualisation23 data visualisationmehek4
 

Ähnlich wie Infographics: A Fun and Quick Way to Learn (20)

Infographics: E-volving Instruction for Visual Literacy
Infographics: E-volving Instruction for Visual LiteracyInfographics: E-volving Instruction for Visual Literacy
Infographics: E-volving Instruction for Visual Literacy
 
Empowering Future-Ready Students: Teaching AI Ethics and Information Literacy...
Empowering Future-Ready Students: Teaching AI Ethics and Information Literacy...Empowering Future-Ready Students: Teaching AI Ethics and Information Literacy...
Empowering Future-Ready Students: Teaching AI Ethics and Information Literacy...
 
The civil rights movement ppt for itc 1 kj 7
The civil rights movement ppt for itc 1 kj 7The civil rights movement ppt for itc 1 kj 7
The civil rights movement ppt for itc 1 kj 7
 
All about Infographics
All about Infographics All about Infographics
All about Infographics
 
The civil rights movement ppt for itc 1 kj 5
The civil rights movement ppt for itc 1 kj 5The civil rights movement ppt for itc 1 kj 5
The civil rights movement ppt for itc 1 kj 5
 
The civil rights movement ppt for itc 1 kj 6
The civil rights movement ppt for itc 1 kj 6The civil rights movement ppt for itc 1 kj 6
The civil rights movement ppt for itc 1 kj 6
 
Infographics for Nonprofits - Forefront Member Breakfast Series
Infographics for Nonprofits - Forefront Member Breakfast SeriesInfographics for Nonprofits - Forefront Member Breakfast Series
Infographics for Nonprofits - Forefront Member Breakfast Series
 
Regis university learning technology fair kim hosler_ infographics for st...
Regis university   learning technology fair   kim hosler_ infographics for st...Regis university   learning technology fair   kim hosler_ infographics for st...
Regis university learning technology fair kim hosler_ infographics for st...
 
Infographic evernote
Infographic evernoteInfographic evernote
Infographic evernote
 
Data Visualisation Sara Miller McCune founded SAGE
Data Visualisation Sara Miller McCune founded SAGEData Visualisation Sara Miller McCune founded SAGE
Data Visualisation Sara Miller McCune founded SAGE
 
Data visualisation sara miller mc cune founded sage
Data visualisation sara miller mc cune founded sageData visualisation sara miller mc cune founded sage
Data visualisation sara miller mc cune founded sage
 
The civil rights movement ppt for itc 1 kj 4
The civil rights movement ppt for itc 1 kj 4The civil rights movement ppt for itc 1 kj 4
The civil rights movement ppt for itc 1 kj 4
 
Information Literacy meets Employability
Information Literacy meets EmployabilityInformation Literacy meets Employability
Information Literacy meets Employability
 
Hello Data!
Hello Data!Hello Data!
Hello Data!
 
Separating Myth from Truth in Data Visualisation
Separating Myth from Truth in Data VisualisationSeparating Myth from Truth in Data Visualisation
Separating Myth from Truth in Data Visualisation
 
higher thinking skills through IT-based project part 2
higher thinking skills through IT-based project part 2higher thinking skills through IT-based project part 2
higher thinking skills through IT-based project part 2
 
IBL and Skills Development
IBL and Skills DevelopmentIBL and Skills Development
IBL and Skills Development
 
Infographics
InfographicsInfographics
Infographics
 
Digital Literacy Lens for the SCONUL 7 pillars model of IL
Digital Literacy Lens for the SCONUL 7 pillars model of ILDigital Literacy Lens for the SCONUL 7 pillars model of IL
Digital Literacy Lens for the SCONUL 7 pillars model of IL
 
Data visualisation23 data visualisation
Data visualisation23 data visualisationData visualisation23 data visualisation
Data visualisation23 data visualisation
 

Infographics: A Fun and Quick Way to Learn

  • 2. What is an infographic? You are looking at one! Infographics are a funfun and quickquick way to learn about a topic without a ton of heavy reading. There are many different stylesdifferent styles of infographics and datadata visualizationsvisualizations, but the ultimate goal for all infographics is to be sharedshared. A data-richdata-rich visualizationvisualization of a story A tool to educateeducate and informinform.
  • 3. The Contents of an Infographic
  • 5. Why use infographics in the classroom? Infographics are: • Eye-Catching • Engaging • Full of rich data • Easily available online Infographics can: • Compare or identify relationships between data • Build or assess knowledge • Ignite critical thinking • Inspire creativity
  • 6. Classroom Applications Anticipatory Activity Have students view, discuss, and generate ideas before covering a unit. Create Your Own Create an infographic that displays essential information to be learned in a given unit. HaveStudentsCreate!
  • 7. Exploring Infographics Let’s look at some examples! Links to all infographics included in this presentation are available on the rmsTechPD wiki . You can also search on Google Images for others. As you view multiple infographics consider the following questions: •What is the purpose of the infographic? Who is the intended audience? •How does the use of color, shapes, pictures, and organizational tools add or subtract from the comprehension of the data? •How would an infographic like this, or of this style be useful to you in your class?
  • 8. Creating Infographics The following websites are dedicated to free infographic design: •Visual.ly •Easel.ly •Infogr.am •Piktochart •Many Eyes •Goodlabs