
Recommended
More Related Content
What's hot
Similar to Jefferson elementary
Similar to Jefferson elementary (20)
More from secretsvicky
More from secretsvicky (17)
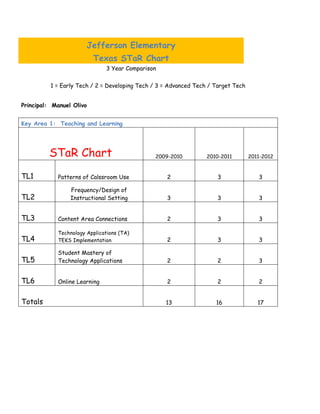
Jefferson elementary
- 1. Jefferson Elementary Texas STaR Chart 3 Year Comparison 1 = Early Tech / 2 = Developing Tech / 3 = Advanced Tech / Target Tech Principal: Manuel Olivo Key Area 1: Teaching and Learning STaR Chart 2009-2010 2010-2011 2011-2012 TL1 Patterns of Calssroom Use 2 3 3 Frequency/Design of TL2 Instructional Setting 3 3 3 TL3 Content Area Connections 2 3 3 Technology Applications (TA) TL4 TEKS Implementation 2 3 3 Student Mastery of TL5 Technology Applications 2 2 3 TL6 Online Learning 2 2 2 Totals 13 16 17
- 2. Key Area 2: Educator Preparation & Development STaR Chart 2009-2010 2010-2011 2011-2012 Professional Development EP1 Experiences 2 3 3 Models of Professional EP2 Development 2 2 3 EP3 Capabilities of Educators 3 3 3 Access to Professional EP4 Development 2 2 2 Levels of Understanding and EP5 Patterns of Use 2 3 3 Professional Development for EP6 Online Learning 2 2 2 Totals 13 15 16
- 3. Key Area 3: Leadership, Administration, & Instructional Support STaR Chart 2009-2010 2010-2011 2011-2012 L1 Leadership and Vision 3 3 3 L2 Planning 3 3 3 L3 Instructional Support 3 3 3 Communication and L4 Collaboration 3 3 3 L5 Budget 2 3 3 Leadership and Support for L6 Online Learning 3 3 3 Totals 17 18 18
- 4. Key Area 4: Infrastructure for Technology STaR Chart 2009-2010 2010-2011 2011-2012 INF1 Students per Computers 2 3 2 Internet Access Connectivity INF2 Speed 4 4 4 INF3 Other Classroom Technology 3 3 3 INF4 Technical Support 3 3 3 Local Area Network Wide INF5 Area Network 3 3 3 INF6 Distance Learning Capacity 3 3 3 Totals 18 19 18