SlideShare a Scribd company logo
1 of 1
Download to read offline
Validation of Granger Causality using Unidirectional Neuronal Networks
                                                                                                               Sankaraleengam Alagapan, Liangbin Pan, Bruce Wheeler and Thomas DeMarse
                                                                                                                      J Crayton Pruitt Family Department of Biomedical Engineering
                                                                                                                                           University of Florida


                                              Introduction                                                                                                                     Methods                                                                                                                                          Results                                                                                     Results
                                                                                                                    Materials
           • Neurons cultured on microelectrode arrays (MEAs) form an                                               • MEAs (Commercial (MCS, Germany)) 8 x 8 array, 200µm 60                                                                                       Analysis of Data From Microwells and Microtunnels (Fig                                                                     • Average causal values from Input well to Output well is higher
           interesting system to study living (in vitro) neuronal network                                           TiN electrodes on Glass substrate with SiN2 insulation                                                                                         5)                                                                                                                         than Output well to Input well
           properties                                                                                               • Dissociated neuronal culture from E18 rats, Medium:                                                                                          • Causal Measures are Sensitive to Time Constant:
           • Microfluidic devices consisting of wells connected by tunnels                                          Neurobasal/ B27/Glutamax                                                                                                                          – 1 ms bins, tau=4 ms: low causality within and between                                                                                         Bin size=10 ms Tau = 40ms
           enable control over the direction of connections in in vitro                                                                                                                                                                                               group activity in the wells, but high values for propagation
           networks                                                                                                 Microtunnel Devices (Fig 2)                                                                                                                       by axons
           • Sequential plating of neurons in wells ideally leads to tunnels                                        • PDMS Devices Tunnels - (3µm x 10µm x 400µm), Wells 1 mm                                                                                         – 10 ms bins, tau=40 ms: high causality within and
           filled with axons extending from the older to the younger                                                high
           population and hence unidirectional propagation                                                                                                                                                                                                            between wells, but little for axonal propagation
                                                                                                                    • Well B cultured 10 days after culture in Well A
                                                                                                                    • Spontaneous Activity recorded 10 days after culture in Well B
                                                                                                                                                                                                                                                 Spike Train                                                                Bin size=1 ms Tau = 4ms

                                                                                                                                                                                                                                  Microwell B
                                                                                                                                                                                                                                 (Output Well)


                                                                                                                                                                         Row 4                                                                                                   Output well (B)                          Tunnels to Well B                                Well A to Well B
                                                                                                                                                                                                                                 Microtunnels

                                                                                                                                                                         Row 5                                                                 Smoothed Waveform                                                          Tunnels
     MEA                                      Dissociated Neuronal Culture        Multi Electrode Recordings
                                                                                                                                                                                                                                 Microwell A
                                                                                                                                                                                                                                 (Input Well)


                                                                                                                                                                                                                                                                                                      Well B to Tunnels


                                                                                                                                                                                                                                                                                                                                                                      Well A to Tunnels
                                                                                                                                                                                                                         Arrow indicates direction
                                                                                                                                                                                                                100 µm   of growth of axons
                                                                                                                                                                                             (a)                                     (b)


                                                                                                                                (a)                                                    (b)                                                             (c)                                                                                                                                     Fig 6 Average Region wise Causal Values (Average values from Fig 5(a) bottom
                                                                                                                    Fig 3. (a)Schematic of the device coupled MEA (b) Micrograph of device and
                                                                                                                                                                                                                                                                                 Well B to Well A                         Tunnels to Well A                                Input well
                         Microtunnel Device                       Microtunnel Device                                MEA (c) Preprocessing for Granger Analysis                                                                                                                                                                                                             (A)


                          Fig 1. Overview of technology used in this work                                                                                                        Results
                                                                                                                                                                                                                                                                                                                                                                                                                        Conclusion
           • Granger Causality(GC) is a statistical measure finding
                                                                                                                   Analysis of Data From Microtunnels (Fig 4)                                                                                                                                                             Bin size=10 ms Tau = 40ms
           widespread use in Neuroscience especially in LFPs and EEGs
                                                                                                                   • By design, action potentials should propagate from row 5 to                                                                                                                                                                                                              • Granger analysis on the data from microtunnels shows that
           for assessing functional connectivity between brain structures
                                                                                                                   row 4. This is supported by two measures.                                                                                                                                                                                                                                  Granger Causality is effective in determining directionality
           • Here we use data from unidirectional microtunnel networks
                                                                                                                       – Values of causal connection from row 5 to row 4 are higher                                                                                                                                                                                                           from neuronal data.
           to validate Granger Causality’s ability to infer direction of                                                                                                                                                                                                         Output well (B)                          Tunnels to Well B                          Well A to Well B
                                                                                                                       than for row 4 to row 5                                                                                                                                                                                                                                                • Analysis of data from the entire system shows the
           functional connectivity                                                                                                                                                                                                                                                                                        Tunnels
                                                                                                                       – Cross-correlograms show a significant peak at a delay at                                                                                                                                                                                                             necessity to consider the time scale of interactions to


                                                                                                                                                                                                                                                                                                    Well B to Tunnels
                                                   Methods


                                                                                                                                                                                                                                                                                                                                                                 Well A to Tunnels
                                                                                                                       positive delay from row 4 to row 5                                                                                                                                                                                                                                     obtain the exact connectivity structure
                                                                                                                   • However, in 15% of the cases, propagation was in the other
             Granger Causality                                                                                     direction as indicated by cross-correlogram and Granger
             • Suppose X and Y are 2 time
                                                                 0.5      Illustration
                                                                                                                   analysis. (Channels 84-85 in Fig 4)                                                                                                                                                                                                                                                           Acknowledgement
                                                              1         2                                                                                                                                                                                                        Well B to Well A                         Tunnels to Well A                          Input well
             series modeled as autoregressive                    0.25
                                                                                                                         Conditional Granger Values Between Electrodes Under Microtunnels                                                                                                                                                                            (A)

             processes, Y G-causes X if the
                                                                                                                                                 24
                                                                                                                                                 25                                                                                             0.14                                                                                                                                          Funded by National Institute of Health (NIH) NS052233
             including past of Y in modeling X
                                                                                                                                                 34
                                                                                                                                                                                                                                                0.12
                                                                                                                                                 35
                                                                     0.25
             decreases the variability of                                                                                                        44
                                                                                                                                                 45
                                                                                                                                                                                                                                                0.1
                                                                                                                                                                                                                                                                                                                                       (a)                                                                              References
             residuals in the model and vice
                                                                                                                                        Target


                                                                                                                                                 54                                                                                             0.08
                                                                                                                                                                                                                                                                             Bin size=1 ms Tau = 4ms                                                    Bin size=10 ms Tau = 40ms
             versa.                                        0. 5
                                                                                                                                                 55
                                                                                                                                                 64                                                                                             0.06
                                                                                                                                                                                                                                                                                                                                                                                              1. Cadotte AJ, Demarse TB, He P, Ding M. Causal
             • The amount by which the                                                                                                           65

             variability is reduced gives a
                                                                                                                                                 74                                                                                             0.04                                                                                                                                             Measures of Structure and Plasticity in Simulated and
                                                                                                                                                                                                                                                                                                                                                                                                 Living Neural Networks. PLOS One. 2008;3(10).
                                                                                                                                                 75

             measure of strength and direction Fig2 Illustration of Granger Causality

                                                                                                                                                                                                                                                                                                                                              Tunnels
                                                                                                                                                                                                                                                0.02
                                                                                                                                                                                                                                                                   Tunnels


                                                                                                                                                 84


             is revealed in the relative strengths and representation
                                                                                                                                                 85
                                                                                                                                                      24 25 34 35 44 45 54 55 64 65 74 75 84 85
                                                                                                                                                                                                                                                                                                                                                                                              2. Dworak BJ, Wheeler BC. Novel MEA platform with
              • Conditional Granger Causality: Same idea as Granger, with both
                                                                                                                                                                                 Source
                                                                                                                                                                                                                                                                                                                                                                                                 PDMS microtunnels enables the detection of action
                                                                                                                                                                                       (a)
              X and Y conditioned on another variable Z which might influence                                                                    Channel_55 to Channel_54                                   Channel_85 to Channel_84                                                                                                                                                             potential propagation from isolated axons in culture. Lab
              the two time series                                                                                                                                                                                                                                                                                                       (b)                                                      on a Chip. 2009:404-410.
                                                                                                                                                                                                                                                                                                                                                                                              3. Ding, M., Chen, Y., & Bressler, S.L. Granger causality:
                                                                                                                                                                                                     400
                                                                                                                                        200


                                                                                                                                                                                                                                                                    Fig 5 (a) Granger Causal Values between different electrodes under the
                                                                                                                           Counts/bin


                                                                                                                                                                                        Counts/bin


            Pre-processing for Granger Analysis (Fig 3c)                                                                                100                                                          200
                                                                                                                                                                                                                                                                    microtunnels and microwells for different values of bin size and tau.
                                                                                                                                                                                                                                                                                                                                                                                                 Basic theory and application to neuroscience
            • Spikes detected – Threshold crossing – Threshold = 5σ                                                                                                                                                                                                 (b) Connectivity Diagrams for different bin size and tau. Connectivity Diagram                                               Winterhalder, N., & Timmer, J. Schelter. S. Handbook of
            • Spiketimes  Spiketrains (Bin size = 1ms or 10ms)                                                                           0
                                                                                                                                           -2           -1       0         1       2
                                                                                                                                                                                                      0
                                                                                                                                                                                                       -2        -1          0             1           2
                                                                                                                                                                                                                                                                    shows only stronger connections (GC values >0.025)                                                                           Time Series Analysis. Wienheim : Wiley, 2006.
            • Spiketrains smoothed with exponential curve (τ = 4ms or 40ms)                                                                                                                                                                                                                                                                                                                   4. Seth AK. A MATLAB toolbox for Granger causal
                                                                                                                                                             Time (ms)                                                   Time (ms)


            to get a continuous waveform                                                                                                                                               (b)
                                                                                                                    Fig 4(a) Granger Causal Values from source(columns) to targets(rows) (b)                                                                                                                                                                                                     connectivity analysis. Journal of neuroscience methods.
            • Conditional Granger analysis using GCCA Toolbox4                                                      Cross Correlograms for 2 examples showing unidirectional (left) and                                                                                                                                                                                                          2010;186(2):262-73
                                                                                                                    bidirectional (right) propagation
TEMPLATE DESIGN © 2008

www.PosterPresentations.com

More Related Content

What's hot

Anovasia technology presentation nov2012 non-conf
Anovasia technology presentation nov2012 non-confAnovasia technology presentation nov2012 non-conf
Anovasia technology presentation nov2012 non-confJohn Dangerfield
 
Christina Smolke (Stanford) at a LASER on "Synthetic Biology"
Christina Smolke (Stanford) at a LASER on "Synthetic Biology"Christina Smolke (Stanford) at a LASER on "Synthetic Biology"
Christina Smolke (Stanford) at a LASER on "Synthetic Biology"piero scaruffi
 
Nasa
NasaNasa
Nasalusik
 
Vellore 2011
Vellore 2011Vellore 2011
Vellore 2011phgts
 
Stratified Medicine - Applications and Case Studies
Stratified Medicine - Applications and Case StudiesStratified Medicine - Applications and Case Studies
Stratified Medicine - Applications and Case StudiesSpace IDEAS Hub
 
Ryan Poplin - Sources of Bias
Ryan Poplin - Sources of BiasRyan Poplin - Sources of Bias
Ryan Poplin - Sources of BiasGenomeInABottle
 
C04124021024
C04124021024C04124021024
C04124021024IOSR-JEN
 
How Point of Care Diagnostics Will Change Health Care-Texas Enterprise Speake...
How Point of Care Diagnostics Will Change Health Care-Texas Enterprise Speake...How Point of Care Diagnostics Will Change Health Care-Texas Enterprise Speake...
How Point of Care Diagnostics Will Change Health Care-Texas Enterprise Speake...UT Austin McCombs School of Business
 
Dna and rna
Dna and rnaDna and rna
Dna and rnaUSM
 
Vienna Bpi 2010 Handout
Vienna Bpi 2010 HandoutVienna Bpi 2010 Handout
Vienna Bpi 2010 Handoutphgts
 
Dr Pablo Leivar (CRAG) - THE DARK SIDE OF PLANT GROWTH: A ROLE FOR PHYTOCHROM...
Dr Pablo Leivar (CRAG) - THE DARK SIDE OF PLANT GROWTH: A ROLE FOR PHYTOCHROM...Dr Pablo Leivar (CRAG) - THE DARK SIDE OF PLANT GROWTH: A ROLE FOR PHYTOCHROM...
Dr Pablo Leivar (CRAG) - THE DARK SIDE OF PLANT GROWTH: A ROLE FOR PHYTOCHROM...xrbiotech
 
Session 4 part 5
Session 4 part 5Session 4 part 5
Session 4 part 5plmiami
 
BPS 2010 Poster Presentation: Shotgun DNA Mapping with Yeast
BPS 2010 Poster Presentation: Shotgun DNA Mapping with YeastBPS 2010 Poster Presentation: Shotgun DNA Mapping with Yeast
BPS 2010 Poster Presentation: Shotgun DNA Mapping with YeastAnthony Salvagno
 
Ancient dna
Ancient dnaAncient dna
Ancient dnaCAS0609
 
Electrodes for Energy Delivery and Storage
Electrodes for Energy Delivery and StorageElectrodes for Energy Delivery and Storage
Electrodes for Energy Delivery and StorageDavid Pan
 
Perfusion scaling slideshare
Perfusion scaling slidesharePerfusion scaling slideshare
Perfusion scaling slideshare3D Biotek
 

What's hot (18)

Anovasia technology presentation nov2012 non-conf
Anovasia technology presentation nov2012 non-confAnovasia technology presentation nov2012 non-conf
Anovasia technology presentation nov2012 non-conf
 
Christina Smolke (Stanford) at a LASER on "Synthetic Biology"
Christina Smolke (Stanford) at a LASER on "Synthetic Biology"Christina Smolke (Stanford) at a LASER on "Synthetic Biology"
Christina Smolke (Stanford) at a LASER on "Synthetic Biology"
 
Nasa
NasaNasa
Nasa
 
Church nhgri 2012
Church nhgri 2012Church nhgri 2012
Church nhgri 2012
 
Vellore 2011
Vellore 2011Vellore 2011
Vellore 2011
 
Stratified Medicine - Applications and Case Studies
Stratified Medicine - Applications and Case StudiesStratified Medicine - Applications and Case Studies
Stratified Medicine - Applications and Case Studies
 
Ryan Poplin - Sources of Bias
Ryan Poplin - Sources of BiasRyan Poplin - Sources of Bias
Ryan Poplin - Sources of Bias
 
Pid effect
Pid effectPid effect
Pid effect
 
C04124021024
C04124021024C04124021024
C04124021024
 
How Point of Care Diagnostics Will Change Health Care-Texas Enterprise Speake...
How Point of Care Diagnostics Will Change Health Care-Texas Enterprise Speake...How Point of Care Diagnostics Will Change Health Care-Texas Enterprise Speake...
How Point of Care Diagnostics Will Change Health Care-Texas Enterprise Speake...
 
Dna and rna
Dna and rnaDna and rna
Dna and rna
 
Vienna Bpi 2010 Handout
Vienna Bpi 2010 HandoutVienna Bpi 2010 Handout
Vienna Bpi 2010 Handout
 
Dr Pablo Leivar (CRAG) - THE DARK SIDE OF PLANT GROWTH: A ROLE FOR PHYTOCHROM...
Dr Pablo Leivar (CRAG) - THE DARK SIDE OF PLANT GROWTH: A ROLE FOR PHYTOCHROM...Dr Pablo Leivar (CRAG) - THE DARK SIDE OF PLANT GROWTH: A ROLE FOR PHYTOCHROM...
Dr Pablo Leivar (CRAG) - THE DARK SIDE OF PLANT GROWTH: A ROLE FOR PHYTOCHROM...
 
Session 4 part 5
Session 4 part 5Session 4 part 5
Session 4 part 5
 
BPS 2010 Poster Presentation: Shotgun DNA Mapping with Yeast
BPS 2010 Poster Presentation: Shotgun DNA Mapping with YeastBPS 2010 Poster Presentation: Shotgun DNA Mapping with Yeast
BPS 2010 Poster Presentation: Shotgun DNA Mapping with Yeast
 
Ancient dna
Ancient dnaAncient dna
Ancient dna
 
Electrodes for Energy Delivery and Storage
Electrodes for Energy Delivery and StorageElectrodes for Energy Delivery and Storage
Electrodes for Energy Delivery and Storage
 
Perfusion scaling slideshare
Perfusion scaling slidesharePerfusion scaling slideshare
Perfusion scaling slideshare
 

Similar to BMES 2010 poster

INSET poster_bearddylan
INSET poster_bearddylanINSET poster_bearddylan
INSET poster_bearddylanDylan Beard
 
Nanotechnology in medicine
Nanotechnology in medicineNanotechnology in medicine
Nanotechnology in medicineNANOYOU
 
Bmes presentation final
Bmes presentation finalBmes presentation final
Bmes presentation finalhcbarber13
 
Nyu wireless presentation
Nyu wireless presentationNyu wireless presentation
Nyu wireless presentation3GDR
 
In Vivo Detection of Nanoparticles in Mouse Cancer Using an Integrated Photoa...
In Vivo Detection of Nanoparticles in Mouse Cancer Using an Integrated Photoa...In Vivo Detection of Nanoparticles in Mouse Cancer Using an Integrated Photoa...
In Vivo Detection of Nanoparticles in Mouse Cancer Using an Integrated Photoa...FUJIFILM VisualSonics Inc.
 
Patch clamp technique
Patch clamp techniquePatch clamp technique
Patch clamp techniqueRitik Vardhan
 
Immunoassays using artificial nanopores
Immunoassays using artificial nanoporesImmunoassays using artificial nanopores
Immunoassays using artificial nanoporesSrishti Kushwaha
 
Nanopore for dna sequencing by shreya
Nanopore for dna sequencing by shreyaNanopore for dna sequencing by shreya
Nanopore for dna sequencing by shreyaShreya Modi
 
Icam 2009 Soft Actuators H Bridges Nanopores
Icam 2009 Soft Actuators H Bridges NanoporesIcam 2009 Soft Actuators H Bridges Nanopores
Icam 2009 Soft Actuators H Bridges Nanoporesdickbroer
 
Method of gene transfer
Method of gene transferMethod of gene transfer
Method of gene transferSumedhaBobade
 
Sigma xi final
Sigma xi finalSigma xi final
Sigma xi finaljmalloy1
 
Phlyogenetic trees
Phlyogenetic treesPhlyogenetic trees
Phlyogenetic treesjmalloy1
 
Sigma xi final
Sigma xi finalSigma xi final
Sigma xi finaljmalloy1
 
Humans Aliens And E Harmony Or Why There Is No Such Thing As A Free Lunch In ...
Humans Aliens And E Harmony Or Why There Is No Such Thing As A Free Lunch In ...Humans Aliens And E Harmony Or Why There Is No Such Thing As A Free Lunch In ...
Humans Aliens And E Harmony Or Why There Is No Such Thing As A Free Lunch In ...Mark Berjanskii
 

Similar to BMES 2010 poster (17)

MEA2010 Poster
MEA2010 PosterMEA2010 Poster
MEA2010 Poster
 
INSET poster_bearddylan
INSET poster_bearddylanINSET poster_bearddylan
INSET poster_bearddylan
 
Nanotechnology in medicine
Nanotechnology in medicineNanotechnology in medicine
Nanotechnology in medicine
 
Bmes presentation final
Bmes presentation finalBmes presentation final
Bmes presentation final
 
Nanogenetics
NanogeneticsNanogenetics
Nanogenetics
 
Nyu wireless presentation
Nyu wireless presentationNyu wireless presentation
Nyu wireless presentation
 
In Vivo Detection of Nanoparticles in Mouse Cancer Using an Integrated Photoa...
In Vivo Detection of Nanoparticles in Mouse Cancer Using an Integrated Photoa...In Vivo Detection of Nanoparticles in Mouse Cancer Using an Integrated Photoa...
In Vivo Detection of Nanoparticles in Mouse Cancer Using an Integrated Photoa...
 
Patch clamp technique
Patch clamp techniquePatch clamp technique
Patch clamp technique
 
Immunoassays using artificial nanopores
Immunoassays using artificial nanoporesImmunoassays using artificial nanopores
Immunoassays using artificial nanopores
 
Nanopore for dna sequencing by shreya
Nanopore for dna sequencing by shreyaNanopore for dna sequencing by shreya
Nanopore for dna sequencing by shreya
 
Icam 2009 Soft Actuators H Bridges Nanopores
Icam 2009 Soft Actuators H Bridges NanoporesIcam 2009 Soft Actuators H Bridges Nanopores
Icam 2009 Soft Actuators H Bridges Nanopores
 
Method of gene transfer
Method of gene transferMethod of gene transfer
Method of gene transfer
 
Sigma xi final
Sigma xi finalSigma xi final
Sigma xi final
 
NANOPORE SEQUENCING
NANOPORE SEQUENCINGNANOPORE SEQUENCING
NANOPORE SEQUENCING
 
Phlyogenetic trees
Phlyogenetic treesPhlyogenetic trees
Phlyogenetic trees
 
Sigma xi final
Sigma xi finalSigma xi final
Sigma xi final
 
Humans Aliens And E Harmony Or Why There Is No Such Thing As A Free Lunch In ...
Humans Aliens And E Harmony Or Why There Is No Such Thing As A Free Lunch In ...Humans Aliens And E Harmony Or Why There Is No Such Thing As A Free Lunch In ...
Humans Aliens And E Harmony Or Why There Is No Such Thing As A Free Lunch In ...
 

Recently uploaded

From Family Reminiscence to Scholarly Archive .
From Family Reminiscence to Scholarly Archive .From Family Reminiscence to Scholarly Archive .
From Family Reminiscence to Scholarly Archive .Alan Dix
 
TeamStation AI System Report LATAM IT Salaries 2024
TeamStation AI System Report LATAM IT Salaries 2024TeamStation AI System Report LATAM IT Salaries 2024
TeamStation AI System Report LATAM IT Salaries 2024Lonnie McRorey
 
New from BookNet Canada for 2024: Loan Stars - Tech Forum 2024
New from BookNet Canada for 2024: Loan Stars - Tech Forum 2024New from BookNet Canada for 2024: Loan Stars - Tech Forum 2024
New from BookNet Canada for 2024: Loan Stars - Tech Forum 2024BookNet Canada
 
What is DBT - The Ultimate Data Build Tool.pdf
What is DBT - The Ultimate Data Build Tool.pdfWhat is DBT - The Ultimate Data Build Tool.pdf
What is DBT - The Ultimate Data Build Tool.pdfMounikaPolabathina
 
What's New in Teams Calling, Meetings and Devices March 2024
What's New in Teams Calling, Meetings and Devices March 2024What's New in Teams Calling, Meetings and Devices March 2024
What's New in Teams Calling, Meetings and Devices March 2024Stephanie Beckett
 
Digital Identity is Under Attack: FIDO Paris Seminar.pptx
Digital Identity is Under Attack: FIDO Paris Seminar.pptxDigital Identity is Under Attack: FIDO Paris Seminar.pptx
Digital Identity is Under Attack: FIDO Paris Seminar.pptxLoriGlavin3
 
The Role of FIDO in a Cyber Secure Netherlands: FIDO Paris Seminar.pptx
The Role of FIDO in a Cyber Secure Netherlands: FIDO Paris Seminar.pptxThe Role of FIDO in a Cyber Secure Netherlands: FIDO Paris Seminar.pptx
The Role of FIDO in a Cyber Secure Netherlands: FIDO Paris Seminar.pptxLoriGlavin3
 
Artificial intelligence in cctv survelliance.pptx
Artificial intelligence in cctv survelliance.pptxArtificial intelligence in cctv survelliance.pptx
Artificial intelligence in cctv survelliance.pptxhariprasad279825
 
What is Artificial Intelligence?????????
What is Artificial Intelligence?????????What is Artificial Intelligence?????????
What is Artificial Intelligence?????????blackmambaettijean
 
Time Series Foundation Models - current state and future directions
Time Series Foundation Models - current state and future directionsTime Series Foundation Models - current state and future directions
Time Series Foundation Models - current state and future directionsNathaniel Shimoni
 
DevoxxFR 2024 Reproducible Builds with Apache Maven
DevoxxFR 2024 Reproducible Builds with Apache MavenDevoxxFR 2024 Reproducible Builds with Apache Maven
DevoxxFR 2024 Reproducible Builds with Apache MavenHervé Boutemy
 
New from BookNet Canada for 2024: BNC CataList - Tech Forum 2024
New from BookNet Canada for 2024: BNC CataList - Tech Forum 2024New from BookNet Canada for 2024: BNC CataList - Tech Forum 2024
New from BookNet Canada for 2024: BNC CataList - Tech Forum 2024BookNet Canada
 
"Subclassing and Composition – A Pythonic Tour of Trade-Offs", Hynek Schlawack
"Subclassing and Composition – A Pythonic Tour of Trade-Offs", Hynek Schlawack"Subclassing and Composition – A Pythonic Tour of Trade-Offs", Hynek Schlawack
"Subclassing and Composition – A Pythonic Tour of Trade-Offs", Hynek SchlawackFwdays
 
"ML in Production",Oleksandr Bagan
"ML in Production",Oleksandr Bagan"ML in Production",Oleksandr Bagan
"ML in Production",Oleksandr BaganFwdays
 
The State of Passkeys with FIDO Alliance.pptx
The State of Passkeys with FIDO Alliance.pptxThe State of Passkeys with FIDO Alliance.pptx
The State of Passkeys with FIDO Alliance.pptxLoriGlavin3
 
Advanced Computer Architecture – An Introduction
Advanced Computer Architecture – An IntroductionAdvanced Computer Architecture – An Introduction
Advanced Computer Architecture – An IntroductionDilum Bandara
 
SIP trunking in Janus @ Kamailio World 2024
SIP trunking in Janus @ Kamailio World 2024SIP trunking in Janus @ Kamailio World 2024
SIP trunking in Janus @ Kamailio World 2024Lorenzo Miniero
 
WordPress Websites for Engineers: Elevate Your Brand
WordPress Websites for Engineers: Elevate Your BrandWordPress Websites for Engineers: Elevate Your Brand
WordPress Websites for Engineers: Elevate Your Brandgvaughan
 
SALESFORCE EDUCATION CLOUD | FEXLE SERVICES
SALESFORCE EDUCATION CLOUD | FEXLE SERVICESSALESFORCE EDUCATION CLOUD | FEXLE SERVICES
SALESFORCE EDUCATION CLOUD | FEXLE SERVICESmohitsingh558521
 
Generative AI for Technical Writer or Information Developers
Generative AI for Technical Writer or Information DevelopersGenerative AI for Technical Writer or Information Developers
Generative AI for Technical Writer or Information DevelopersRaghuram Pandurangan
 

Recently uploaded (20)

From Family Reminiscence to Scholarly Archive .
From Family Reminiscence to Scholarly Archive .From Family Reminiscence to Scholarly Archive .
From Family Reminiscence to Scholarly Archive .
 
TeamStation AI System Report LATAM IT Salaries 2024
TeamStation AI System Report LATAM IT Salaries 2024TeamStation AI System Report LATAM IT Salaries 2024
TeamStation AI System Report LATAM IT Salaries 2024
 
New from BookNet Canada for 2024: Loan Stars - Tech Forum 2024
New from BookNet Canada for 2024: Loan Stars - Tech Forum 2024New from BookNet Canada for 2024: Loan Stars - Tech Forum 2024
New from BookNet Canada for 2024: Loan Stars - Tech Forum 2024
 
What is DBT - The Ultimate Data Build Tool.pdf
What is DBT - The Ultimate Data Build Tool.pdfWhat is DBT - The Ultimate Data Build Tool.pdf
What is DBT - The Ultimate Data Build Tool.pdf
 
What's New in Teams Calling, Meetings and Devices March 2024
What's New in Teams Calling, Meetings and Devices March 2024What's New in Teams Calling, Meetings and Devices March 2024
What's New in Teams Calling, Meetings and Devices March 2024
 
Digital Identity is Under Attack: FIDO Paris Seminar.pptx
Digital Identity is Under Attack: FIDO Paris Seminar.pptxDigital Identity is Under Attack: FIDO Paris Seminar.pptx
Digital Identity is Under Attack: FIDO Paris Seminar.pptx
 
The Role of FIDO in a Cyber Secure Netherlands: FIDO Paris Seminar.pptx
The Role of FIDO in a Cyber Secure Netherlands: FIDO Paris Seminar.pptxThe Role of FIDO in a Cyber Secure Netherlands: FIDO Paris Seminar.pptx
The Role of FIDO in a Cyber Secure Netherlands: FIDO Paris Seminar.pptx
 
Artificial intelligence in cctv survelliance.pptx
Artificial intelligence in cctv survelliance.pptxArtificial intelligence in cctv survelliance.pptx
Artificial intelligence in cctv survelliance.pptx
 
What is Artificial Intelligence?????????
What is Artificial Intelligence?????????What is Artificial Intelligence?????????
What is Artificial Intelligence?????????
 
Time Series Foundation Models - current state and future directions
Time Series Foundation Models - current state and future directionsTime Series Foundation Models - current state and future directions
Time Series Foundation Models - current state and future directions
 
DevoxxFR 2024 Reproducible Builds with Apache Maven
DevoxxFR 2024 Reproducible Builds with Apache MavenDevoxxFR 2024 Reproducible Builds with Apache Maven
DevoxxFR 2024 Reproducible Builds with Apache Maven
 
New from BookNet Canada for 2024: BNC CataList - Tech Forum 2024
New from BookNet Canada for 2024: BNC CataList - Tech Forum 2024New from BookNet Canada for 2024: BNC CataList - Tech Forum 2024
New from BookNet Canada for 2024: BNC CataList - Tech Forum 2024
 
"Subclassing and Composition – A Pythonic Tour of Trade-Offs", Hynek Schlawack
"Subclassing and Composition – A Pythonic Tour of Trade-Offs", Hynek Schlawack"Subclassing and Composition – A Pythonic Tour of Trade-Offs", Hynek Schlawack
"Subclassing and Composition – A Pythonic Tour of Trade-Offs", Hynek Schlawack
 
"ML in Production",Oleksandr Bagan
"ML in Production",Oleksandr Bagan"ML in Production",Oleksandr Bagan
"ML in Production",Oleksandr Bagan
 
The State of Passkeys with FIDO Alliance.pptx
The State of Passkeys with FIDO Alliance.pptxThe State of Passkeys with FIDO Alliance.pptx
The State of Passkeys with FIDO Alliance.pptx
 
Advanced Computer Architecture – An Introduction
Advanced Computer Architecture – An IntroductionAdvanced Computer Architecture – An Introduction
Advanced Computer Architecture – An Introduction
 
SIP trunking in Janus @ Kamailio World 2024
SIP trunking in Janus @ Kamailio World 2024SIP trunking in Janus @ Kamailio World 2024
SIP trunking in Janus @ Kamailio World 2024
 
WordPress Websites for Engineers: Elevate Your Brand
WordPress Websites for Engineers: Elevate Your BrandWordPress Websites for Engineers: Elevate Your Brand
WordPress Websites for Engineers: Elevate Your Brand
 
SALESFORCE EDUCATION CLOUD | FEXLE SERVICES
SALESFORCE EDUCATION CLOUD | FEXLE SERVICESSALESFORCE EDUCATION CLOUD | FEXLE SERVICES
SALESFORCE EDUCATION CLOUD | FEXLE SERVICES
 
Generative AI for Technical Writer or Information Developers
Generative AI for Technical Writer or Information DevelopersGenerative AI for Technical Writer or Information Developers
Generative AI for Technical Writer or Information Developers
 

BMES 2010 poster

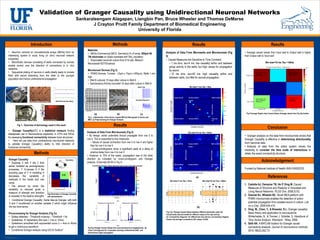
  • 1. Validation of Granger Causality using Unidirectional Neuronal Networks Sankaraleengam Alagapan, Liangbin Pan, Bruce Wheeler and Thomas DeMarse J Crayton Pruitt Family Department of Biomedical Engineering University of Florida Introduction Methods Results Results Materials • Neurons cultured on microelectrode arrays (MEAs) form an • MEAs (Commercial (MCS, Germany)) 8 x 8 array, 200µm 60 Analysis of Data From Microwells and Microtunnels (Fig • Average causal values from Input well to Output well is higher interesting system to study living (in vitro) neuronal network TiN electrodes on Glass substrate with SiN2 insulation 5) than Output well to Input well properties • Dissociated neuronal culture from E18 rats, Medium: • Causal Measures are Sensitive to Time Constant: • Microfluidic devices consisting of wells connected by tunnels Neurobasal/ B27/Glutamax – 1 ms bins, tau=4 ms: low causality within and between Bin size=10 ms Tau = 40ms enable control over the direction of connections in in vitro group activity in the wells, but high values for propagation networks Microtunnel Devices (Fig 2) by axons • Sequential plating of neurons in wells ideally leads to tunnels • PDMS Devices Tunnels - (3µm x 10µm x 400µm), Wells 1 mm – 10 ms bins, tau=40 ms: high causality within and filled with axons extending from the older to the younger high population and hence unidirectional propagation between wells, but little for axonal propagation • Well B cultured 10 days after culture in Well A • Spontaneous Activity recorded 10 days after culture in Well B Spike Train Bin size=1 ms Tau = 4ms Microwell B (Output Well) Row 4 Output well (B) Tunnels to Well B Well A to Well B Microtunnels Row 5 Smoothed Waveform Tunnels MEA Dissociated Neuronal Culture Multi Electrode Recordings Microwell A (Input Well) Well B to Tunnels Well A to Tunnels Arrow indicates direction 100 µm of growth of axons (a) (b) (a) (b) (c) Fig 6 Average Region wise Causal Values (Average values from Fig 5(a) bottom Fig 3. (a)Schematic of the device coupled MEA (b) Micrograph of device and Well B to Well A Tunnels to Well A Input well Microtunnel Device Microtunnel Device MEA (c) Preprocessing for Granger Analysis (A) Fig 1. Overview of technology used in this work Results Conclusion • Granger Causality(GC) is a statistical measure finding Analysis of Data From Microtunnels (Fig 4) Bin size=10 ms Tau = 40ms widespread use in Neuroscience especially in LFPs and EEGs • By design, action potentials should propagate from row 5 to • Granger analysis on the data from microtunnels shows that for assessing functional connectivity between brain structures row 4. This is supported by two measures. Granger Causality is effective in determining directionality • Here we use data from unidirectional microtunnel networks – Values of causal connection from row 5 to row 4 are higher from neuronal data. to validate Granger Causality’s ability to infer direction of Output well (B) Tunnels to Well B Well A to Well B than for row 4 to row 5 • Analysis of data from the entire system shows the functional connectivity Tunnels – Cross-correlograms show a significant peak at a delay at necessity to consider the time scale of interactions to Well B to Tunnels Methods Well A to Tunnels positive delay from row 4 to row 5 obtain the exact connectivity structure • However, in 15% of the cases, propagation was in the other Granger Causality direction as indicated by cross-correlogram and Granger • Suppose X and Y are 2 time 0.5 Illustration analysis. (Channels 84-85 in Fig 4) Acknowledgement 1 2 Well B to Well A Tunnels to Well A Input well series modeled as autoregressive 0.25 Conditional Granger Values Between Electrodes Under Microtunnels (A) processes, Y G-causes X if the 24 25 0.14 Funded by National Institute of Health (NIH) NS052233 including past of Y in modeling X 34 0.12 35 0.25 decreases the variability of 44 45 0.1 (a) References residuals in the model and vice Target 54 0.08 Bin size=1 ms Tau = 4ms Bin size=10 ms Tau = 40ms versa. 0. 5 55 64 0.06 1. Cadotte AJ, Demarse TB, He P, Ding M. Causal • The amount by which the 65 variability is reduced gives a 74 0.04 Measures of Structure and Plasticity in Simulated and Living Neural Networks. PLOS One. 2008;3(10). 75 measure of strength and direction Fig2 Illustration of Granger Causality Tunnels 0.02 Tunnels 84 is revealed in the relative strengths and representation 85 24 25 34 35 44 45 54 55 64 65 74 75 84 85 2. Dworak BJ, Wheeler BC. Novel MEA platform with • Conditional Granger Causality: Same idea as Granger, with both Source PDMS microtunnels enables the detection of action (a) X and Y conditioned on another variable Z which might influence Channel_55 to Channel_54 Channel_85 to Channel_84 potential propagation from isolated axons in culture. Lab the two time series (b) on a Chip. 2009:404-410. 3. Ding, M., Chen, Y., & Bressler, S.L. Granger causality: 400 200 Fig 5 (a) Granger Causal Values between different electrodes under the Counts/bin Counts/bin Pre-processing for Granger Analysis (Fig 3c) 100 200 microtunnels and microwells for different values of bin size and tau. Basic theory and application to neuroscience • Spikes detected – Threshold crossing – Threshold = 5σ (b) Connectivity Diagrams for different bin size and tau. Connectivity Diagram Winterhalder, N., & Timmer, J. Schelter. S. Handbook of • Spiketimes  Spiketrains (Bin size = 1ms or 10ms) 0 -2 -1 0 1 2 0 -2 -1 0 1 2 shows only stronger connections (GC values >0.025) Time Series Analysis. Wienheim : Wiley, 2006. • Spiketrains smoothed with exponential curve (τ = 4ms or 40ms) 4. Seth AK. A MATLAB toolbox for Granger causal Time (ms) Time (ms) to get a continuous waveform (b) Fig 4(a) Granger Causal Values from source(columns) to targets(rows) (b) connectivity analysis. Journal of neuroscience methods. • Conditional Granger analysis using GCCA Toolbox4 Cross Correlograms for 2 examples showing unidirectional (left) and 2010;186(2):262-73 bidirectional (right) propagation TEMPLATE DESIGN © 2008 www.PosterPresentations.com