12 Salt testing: Low deviatoric stress data
•Als PPTX, PDF herunterladen•
0 gefällt mir•345 views

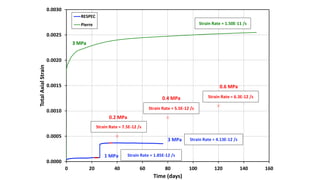
This document contains a graph showing the change in total axial strain over time for different materials under various levels of stress ranging from 0.2 to 3 MPa. The graph also includes lines for the calculated strain rates, which range from 1.5x10^-11 to 4.13x10^-12 per second. The data was collected by RESPEC over a period of up to 160 days.

Empfohlen
Weitere ähnliche Inhalte
Mehr von Sandia National Laboratories: Energy & Climate: Renewables
Mehr von Sandia National Laboratories: Energy & Climate: Renewables (20)
Kürzlich hochgeladen
Kürzlich hochgeladen (20)
12 Salt testing: Low deviatoric stress data
- 1. 0.0000 0.0005 0.0010 0.0015 0.0020 0.0025 0.0030 0 20 40 60 80 100 120 140 160 TotalAxialStrain Time (days) RESPEC Pierre Strain Rate = 1.85E-12 /s Strain Rate = 4.13E-12 /s Strain Rate = 1.50E-11 /s 3 MPa 1 MPa 3 MPa Strain Rate = 7.5E-12 /s Strain Rate = 5.5E-12 /s Strain Rate = 6.3E-12 /s 0.2 MPa 0.4 MPa 0.6 MPa