The stellar orbit distribution in present-day galaxies inferred from the CALIFA survey

Galaxy formation entails the hierarchical assembly of mass, along with the condensation of baryons and the ensuing, selfregulating star formation1,2 . The stars form a collisionless system whose orbit distribution retains dynamical memory that can constrain a galaxy’s formation history3 . The orbits dominated by ordered rotation, with near-maximum circularity λz≈ 1, are called kinematically cold, and the orbits dominated by random motion, with low circularity λz≈ 0, are kinematically hot. The fraction of stars on ‘cold’ orbits, compared with the fraction on ‘hot’ orbits, speaks directly to the quiescence or violence of the galaxies’ formation histories4,5 . Here we present such orbit distributions, derived from stellar kinematic maps through orbit-based modelling for a well-defined, large sample of 300 nearby galaxies. The sample, drawn from the CALIFA survey6, includes the main morphological galaxy types and spans a total stellar mass range from 108.7 to 1011.9 solar masses. Our analysis derives the orbit-circularity distribution as a function of galaxy mass and its volume-averaged total distribution. We find that across most of the considered mass range and across morphological types, there are more stars on ‘warm’ orbits defined as 0.25 ≤λz≤ 0.8 than on either ‘cold’ or ‘hot’ orbits. This orbit-based ‘Hubble diagram’ provides a benchmark for galaxy formation simulations in a cosmological context.

Empfohlen
Empfohlen
Weitere ähnliche Inhalte
Was ist angesagt?
Was ist angesagt? (20)
Ähnlich wie The stellar orbit distribution in present-day galaxies inferred from the CALIFA survey
Ähnlich wie The stellar orbit distribution in present-day galaxies inferred from the CALIFA survey (20)
Mehr von Sérgio Sacani
Mehr von Sérgio Sacani (20)
Kürzlich hochgeladen
Kürzlich hochgeladen (20)
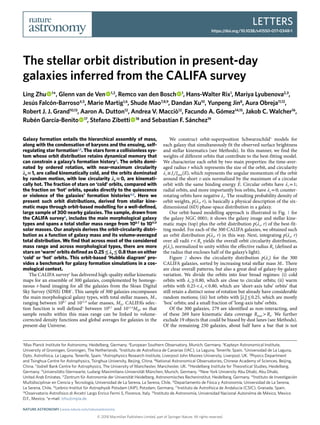
The stellar orbit distribution in present-day galaxies inferred from the CALIFA survey
- 1. Letters https://doi.org/10.1038/s41550-017-0348-1 © 2018 Macmillan Publishers Limited, part of Springer Nature. All rights reserved. 1 Max Planck Institute for Astronomy, Heidelberg, Germany. 2 European Southern Observatory, Munich, Germany. 3 Kapteyn Astronomical Institute, University of Groningen, Groningen, The Netherlands. 4 Instituto de Astrofísica de Canarias (IAC), La Laguna, Tenerife, Spain. 5 Universidad de La Laguna, Dpto. Astrofísica, La Laguna, Tenerife, Spain. 6 Astrophysics Research Institute, Liverpool John Moores University, Liverpool, UK. 7 Physics Department and Tsinghua Centre for Astrophysics, Tsinghua University, Beijing, China. 8 National Astronomical Observatories, Chinese Academy of Sciences, Beijing, China. 9 Jodrell Bank Centre for Astrophysics, The University of Manchester, Manchester, UK. 10 Heidelberg Institute for Theoretical Studies, Heidelberg, Germany. 11 Universitäts-Sternwarte, Ludwig-Maximilians-Universität München, Munich, Germany. 12 New York University Abu Dhabi, Abu Dhabi, United Arab Emirates. 13 Zentrum für Astronomie der Universität Heidelberg, Astronomisches Recheninstitut, Heidelberg, Germany. 14 Instituto de Investigación Multidisciplinar en Ciencia y Tecnología, Universidad de La Serena, La Serena, Chile. 15 Departamento de Física y Astronomía, Universidad de La Serena, La Serena, Chile. 16 Leibniz-Institut für Astrophysik Potsdam (AIP), Potsdam, Germany. 17 Instituto de Astrofísica de Andalucía (CSIC), Granada, Spain. 18 Osservatorio Astrofisico di Arcetri Largo Enrico Fermi 5, Florence, Italy. 19 Instituto de Astronomía, Universidad Nacional Autonóma de México, Mexico D.F., Mexico. *e-mail: lzhu@mpia.de Galaxy formation entails the hierarchical assembly of mass, along with the condensation of baryons and the ensuing, self- regulating star formation1,2 . The stars form a collisionless sys- tem whose orbit distribution retains dynamical memory that can constrain a galaxy’s formation history3 . The orbits domi- nated by ordered rotation, with near-maximum circularity λz ≈ 1, are called kinematically cold, and the orbits dominated by random motion, with low circularity λz ≈ 0, are kinemati- cally hot. The fraction of stars on ‘cold’ orbits, compared with the fraction on ‘hot’ orbits, speaks directly to the quiescence or violence of the galaxies’ formation histories4,5 . Here we present such orbit distributions, derived from stellar kine- matic maps through orbit-based modelling for a well-defined, large sample of 300 nearby galaxies. The sample, drawn from the CALIFA survey6 , includes the main morphological galaxy types and spans a total stellar mass range from 108.7 to 1011.9 solar masses. Our analysis derives the orbit-circularity distri- bution as a function of galaxy mass and its volume-averaged total distribution. We find that across most of the considered mass range and across morphological types, there are more stars on ‘warm’ orbits defined as 0.25 ≤ λz ≤ 0.8 than on either ‘cold’ or ‘hot’ orbits. This orbit-based ‘Hubble diagram’ pro- vides a benchmark for galaxy formation simulations in a cos- mological context. The CALIFA survey6 has delivered high-quality stellar kinematic maps for an ensemble of 300 galaxies, complemented by homoge- neous r-band imaging for all the galaxies from the Sloan Digital Sky Survey (SDSS) DR87 . This sample of 300 galaxies encompasses the main morphological galaxy types, with total stellar masses, M*, ranging between 108.7 and 1011.9 solar masses, M⊙. CALIFA’s selec- tion function is well defined8 between 109.7 and 1011.4 M⊙, so that sample results within this mass range can be linked to volume- corrected density functions and global averages for galaxies in the present-day Universe. We construct orbit-superposition Schwarzschild9 models for each galaxy that simultaneously fit the observed surface brightness and stellar kinematics (see Methods). In this manner, we find the weights of different orbits that contribute to the best-fitting model. We characterize each orbit by two main properties: the time-aver- aged radius r which represents the size of the orbit, and circularity λz ≡ Jz/Jmax(E), which represents the angular momentum of the orbit around the short z-axis normalized by the maximum of a circular orbit with the same binding energy E. Circular orbits have λz = 1; radial orbits, and more importantly box orbits, have λz = 0; counter- rotating orbits have negative λz. The resulting probability density of orbit weights, p(λz, r), is basically a physical description of the six- dimensional (6D) phase-space distribution in a galaxy. Our orbit-based modelling approach is illustrated in Fig. 1 for the galaxy NGC 0001; it shows the galaxy image and stellar kine- matic maps (top) plus the orbit distribution p(λz, r) of the best-fit- ting model. For each of the 300 CALIFA galaxies, we obtained such an orbit distribution p(λz, r) in this way. Next, integrating p(λz, r) over all radii r < Re yields the overall orbit circularity distribution, p(λz), normalized to unity within the effective radius Re (defined as the radius that encloses half of the galaxy’s light). Figure 2 shows the circularity distribution p(λz) for the 300 CALIFA galaxies, sorted by increasing total stellar mass M*. There are clear overall patterns, but also a great deal of galaxy-by-galaxy variation. We divide the orbits into four broad regimes: (i) cold orbits with λz ≥ 0.80, which are close to circular orbits; (ii) warm orbits with 0.25 < λz < 0.80, which are ‘short-axis tube’ orbits’ that still retain a distinct sense of rotation but already have considerable random motions; (iii) hot orbits with |λz| ≤ 0.25, which are mostly ‘box’ orbits; and a small fraction of ‘long-axis tube’ orbits. Of the 300 galaxies, 279 are identified as non-interacting, and of these 269 have kinematic data coverage Rmax > Re. We further exclude 19 objects that could be biased by dust lanes (see Methods). Of the remaining 250 galaxies, about half have a bar that is not The stellar orbit distribution in present-day galaxies inferred from the CALIFA survey Ling Zhu 1 *, Glenn van de Ven 1,2 , Remco van den Bosch 1 , Hans-Walter Rix1 , Mariya Lyubenova2,3 , Jesús Falcón-Barroso4,5 , Marie Martig1,6 , Shude Mao7,8,9 , Dandan Xu10 , Yunpeng Jin8 , Aura Obreja11,12 , Robert J. J. Grand10,13 , Aaron A. Dutton12 , Andrea V. Macciò12 , Facundo A. Gómez14,15 , Jakob C. Walcher16 , Rubén García-Benito 17 , Stefano Zibetti 18 and Sebastian F. Sánchez19 Nature Astronomy | www.nature.com/natureastronomy
- 2. © 2018 Macmillan Publishers Limited, part of Springer Nature. All rights reserved. Letters Nature Astronomy explicitly modelled. However, our tests with simulated galaxies (see Methods) indicate no significant effect in the recovered orbit distribution. We thus keep 250 galaxies, of which 221 fall within the total stellar mass range 9.7 < log(M*/M⊙) < 11.4 (indicated by the red box in Fig. 2), where the CALIFA sample is statistically rep- resentative. We use these 221 galaxies to calculate volume-averaged properties, f(x), for those properties represented by functions, fi(x), which can be ensemble-averaged: ∑ ∑ = ∕ ∕ f x f x M V M V ( ) ( ) (1) i i i i i i i , , * * where M*,i is the total stellar mass and Vi is the volume for each galaxy i (ref. 8 ). If fi(x) = pi(λz), then the resulting p(λz) is the average orbital distribution of present-day galaxies as shown in the subpanel on the right side of Fig. 2. We can now characterize the importance (within Re) of cold, warm, hot and counter-rotating orbits in galaxies of different M*. To this end, we divide the 250 isolated galaxies with enough data cover- age into eight comparably populated mass bins, and then calculate the average orbital distributions in each bin based on equation (1). Note that the bins with the lowest and highest stellar mass are out- side the completeness range of the CALIFA sample even after vol- ume-correction. The resulting averaged luminosity fractions (SDSS r-band) of the cold, warm, hot and counter-rotating components as a function of M* are shown in Fig. 3. The values are listed in the Supplementary Table 1 and include asymmetric errors bars which, in addition to statistical uncertainties, include systematic biases and systematic uncertainties based on careful calibration against galaxy simulations (see Methods). We find that the cold component (blue) rarely dominates within Re, but is most prevalent among galaxies with total stellar mass M* ≈ 1 × 10¹⁰ M⊙ to 2 × 10¹⁰ M⊙ and decreases for more massive gal- axies. In most galaxies, substantially more stars within Re are on warm orbits (orange) that still have distinct angular momentum. The hot component (red) rises rapidly with increasing stellar mass and dominates in the most massive galaxies with M* > 1011 M⊙. The counter-rotating component (black) is roughly constant at about 10% in all galaxies, except in low-mass M* < 1010 M⊙ galaxies where the counter-rotating component increases, seemingly in favour of a decreasing cold component fraction. Such stellar orbit distributions have not previously been derived explicitly for a large sample of galaxies. Instead, the ratio of ordered-to-random motion and the flattening of galaxies are two commonly used proxies for the angular momentum of galaxies. To have a more direct comparison with current results, we determine from our models two similar proxies and compare them to the orbital circularity. First, we compute the ordered-to-random motion σ∕ϕV i per bin in λz for each galaxy i. Here, Vϕ is the intrinsic rotation velocity around the minor axis and σ σ σ σ= + +x y z 2 2 2 is the intrinsic velocity dispersion. Taking σ λ= ∕ϕf x V( ) ( )i i z in equation (1) yields σ λ∕ϕV ( )z shown in the top panel of Fig. 4. As expected, σ∕ϕV strongly correlates with λz, and is thus a good indicator of the underlying orbit distribution. However, the observed ratio of ordered-to-random motion σ∕Vlos los is a projected quantity along an often-unknown line-of-sight viewing angle. Therefore, the combination with the observed galaxy ellipticity ε is used to con- strain the internal dynamics of galaxies10 . The resulting (Vlos/σlos, ε) diagram allows slow-rotator early-type galaxies to be distinguished from fast-rotator galaxies11 . Slow rotators are found to be more 1.0 a d b c V (km s –1 ) σ (km s –1 ) Circularityλz –114 0 59114 93 128 0.5 0 10 r (arcsec) 20 0.000.16 –0.5 0.0 –1.0 Fig. 1 | Our orbit-based modelling illustrated for galaxy NGC 0001. a, SDSS multi-colour image of NGC 0001. b,c, The CALIFA maps of stellar mean velocity V and velocity dispersion σ, respectively. Each of the top panels measures 1 arcmin on the side, and the dashed ellipse with semi- major axis radius Re encloses half of the galaxy’s light in the SDSS r-band. d, The orbit-based model that best fits the SDSS r-band image and CALIFA stellar kinematic maps of NGC 0001 yields the orbital distribution p(λz, r) shown here as a function of circularity λz and intrinsic radius r. The vertical dashed line denotes the SDSS r-band half-light or effective radius Re. Darker colour indicates higher probability density as indicated by the grey-scale bar, with maximum value (0.16) chosen such that the sum of all orbital weights is normalized to unity. 50 100 150 200 250 300 CALIFA galaxies sorted by total stellar mass M* –1.0 –0.5 0.0 0.5 1.0 Circularityλz(<Re) 0.60 8.7 9.7 10.0 10.5 11.0 11.4 11.9 0.0 0.1 0.2 CR 9% Hot 31% Warm 40% Cold 20% log (M* /M◉) 0.00 Fig. 2 | The orbit-circularity λz distribution for each of 300 CALIFA galaxies. Each thin slice vertically represents the λz distribution of one galaxy normalized to unity within the half-light (or effective) radius Re. Darker colour indicates higher probability as illustrated by the grey-scale bar, with maximum value chosen such that per galaxy the orbital weights add up to unity over the 21 bins across the range in λz. From left to right, the galaxies are sorted with increasing total stellar mass M* as indicated at the top. The red box delineates the range of 9.7 < log(M*/M⊙) < 11.4 where the CALIFA sample is statistically representative. The right panel shows the volume-corrected average orbit-circularity distribution within this mass range. The right panel shares the y axis of the left panel, while its x axis is probability per bin (with total probability normalized to unity). The cold, warm, hot and counter-rotating (CR) components are divided in λz as indicated by the three horizontal dashed lines. Nature Astronomy | www.nature.com/natureastronomy
- 3. © 2018 Macmillan Publishers Limited, part of Springer Nature. All rights reserved. LettersNature Astronomy triaxial and more massive12,13 , dominating above 2 × 10¹¹ M⊙. This is in agreement with our more direct orbit-based finding of a gradual increase of the hot component with galaxy mass and dominance above 2 × 10¹¹ M⊙. Second, when considering the flattening of galaxies, it is plausi- ble that stars on cold orbits form thin disks as a consequence of gal- axy formation. However, from galaxy dynamics per se, a spherical galaxy could consist of randomly oriented high-angular momentum orbits—that is, still dynamically cold with high λ λ λ λ= + +z x ytotal 2 2 2 2 , but random λz. To quantify the relation between flattening and λtotal, we calculate for each galaxy with luminosity density ρ the geo- metric flattening ∫ ∫ρ ρ= ∕ + ∕( ) ( )q z x y( ) 22 2 2 2 . At all galaxy masses, there is a correlation between flattening q i and λtotal. We take λ=f x q( ) ( )i i total in equation (1) to derive a ‘universal’ mean relation λq ( )total shown in the bottom panel of Fig. 4. As expected, the previously defined four components in λz are consistent with the transition from a flat to a spheroidal distribution. We have a few per cent of long-axis tube orbits in triaxial galaxies, with small but non- zero λtotal, causing the peak >q 1 at λtotal ≈ 0.2. Our Schwarzschild models thus imply that the cold orbits with high λtotal in galaxies always form a highly flattened configuration and only the hot orbits with low λtotal form a spheroidal configu- ration. Consequently, the bulge-disk morphology of a galaxy is indeed generally an indicator of the underlying orbit types, but still an inaccurate proxy14 owing to the significant scatter of q as a function of λtotal or λz. Even so, photometric bulge-disk decom- positions15 show that the bulge fraction of spiral galaxies increases with mass above M* ≈ 1010 M⊙ (ref. 16 ), which is consistent with the relative increase that we find for the hot component. From photometric decomposition of edge-on disk galaxies, low-mass spiral galaxies are found to have disks that are thicker than the main thin-disk component in high-mass spiral galaxies17 . This is also consistent with our result that for galaxies with M* < 1010 M⊙, despite being mainly disk-dominated Sc and Sd galaxies, the cold orbit fraction drops, while the warm orbit fraction remains high and the fraction of counter-rotating orbits increases. Our finding that warm orbits constitute the majority within 1Re for all galax- ies, except for the very most massive ellipticals, is a new result and insight. But this may be a natural consequence of galaxies grow- ing from the inside out, with those stars born earlier having lower angular momentum5,18,19 . We find that high-λz orbits generally form flat and rapidly rotat- ing disks, whereas low-λz orbits form near-spherical and slow-rotat- ing spheroids. Our distributions p(λz) are therefore a (conceptually improved) alternative to geometric and photometric bulge-disk decompositions, or to the qualitative measures of ‘galaxy morphol- ogy’. In this sense, our results present an orbit-based alternative to 0.2 0.4 0.6 a b Luminosityfraction(<Re) Cold Warm Hot CR 109 1010 1011 Total stellar mass M* 0.0 0.1 0.2 Fig. 3 | The distribution of orbital components as function of galaxy mass. The CALIFA galaxies are divided into eight bins in total stellar mass M* as indicated by the extent of the horizontal error bars. For each bin in M*, the volume-corrected average SDSS r-band luminosity fraction within the effective radius Re is computed for each of four orbital components based on a selection in orbital-circularity λz as indicated by the horizontal dashed lines in Fig. 2. a, b, The blue asterisks, orange triangles and red diamonds in panel a show the resulting fractions for the cold, warm and hot components, respectively, whereas that of the counter-rotating (CR) component is shown with black upside-down triangles separately in panel b for clarity. The vertical error bars indicate the 1σ uncertainties, including both statistical uncertainties as well as systematic biases and uncertainties as inferred from tests with simulated galaxies (see Methods). 5 a b 0 –5 –1.0 0.0 0.2 0.4 0.6 0.8 1.0 CR Hot Warm Cold –0.5 0.0 1.5 1.0 0.5 0.0 Circularity λz λtotal 0.5 1.0 〈Vϕ/σ〉〈q〉 Fig. 4 | The relation between intrinsic orbital angular momentum and its two proxies, a galaxy’s ordered-to-random motion and geometric flattening. a, The intrinsic ordered-to-random motion σ∕ϕ⟨ ⟩V as function of circularity λz. Our division into cold, warm, hot and counter-rotating (CR) components is indicated by the blue, orange, red and white regions, respectively. b, The average geometric flattening ⟨ ⟩q as a function of the total angular momentum λtotal. The horizontal error bars indicate the range covered in λz (a) and λtotal (b), whereas the vertical error bars represent the standard deviation. Nature Astronomy | www.nature.com/natureastronomy
- 4. © 2018 Macmillan Publishers Limited, part of Springer Nature. All rights reserved. Letters Nature Astronomy the ‘Hubble-sequence’, an alternative that characterizes the internal dynamical structure for a large sample of galaxies. Given that CALIFA’s selection function allows the correction of the sample to volume averages, our results represent an observa- tionally determined orbit distribution of galaxies in the present-day Universe. They lend themselves thus to direct comparison with samples of cosmological simulations of galaxies in a cosmological context20–23 ; p(λz), averaged within Re, can be extracted directly from simulations. In this sense, our results open a quantitative way—and at a qualitatively new window—for comparing galaxy simulations to the observed galaxy population in the present-day Universe. Methods We describe below in more detail the orbit-based modelling as well as calibration of systematic biases and uncertainties based on a suite of galaxy simulations. Stellar kinematics. The stellar kinematics are extracted from the spectral range 3,750–4,550 Å for the CALIFA V1200 grating, with nominal instrumental resolution of 66 km s−1 (refs 24,25 ). Two-dimensional Voronoi tessellation26 is used to create spatial bins with a minimum signal-to-noise ratio S/N = 20. The radial extent of the stellar kinematics reaches at least one (SDSS r-band) half-light radius Re for 95% of the sample, while 77% reach 1.5Re and 39% extend beyond 2Re. Stellar masses. The total stellar mass M* is not inferred from our best-fitting dynamical model, but instead is derived8 by fitting the spectral energy distributions from multi-band photometry using a linear combination of single-stellar-population synthetic spectra of different ages and metallicities, adopting a Kroupa27 initial mass function. Although our dynamical models yield precise measurements of the total enclosed mass, the separation into stellar, gas and dark matter masses is much less certain, owing to degeneracies and unavailability of cold gas measurements. At the same time, stellar mass obtained through spectral energy distribution fitting is also relatively straightforward to infer from observed and simulated galaxies and thus convenient for comparison of our results with simulated galaxies. Dynamical models. The orbit-based Schwarzschild28 method, which builds galactic models by superposing stellar orbits generated in a gravitational potential, is widely used to model the dynamics of all kind of stellar systems. We assume the system is in steady-state equilibrium with the stars phase-mixed. Rather than single stars evolving with time, an orbit represents multiple stars on different positions along the orbit at the ‘snapshot’ in which we observe the galaxy. We construct triaxial Schwarzschild models28,29 of 300 CALIFA galaxies in an uniform way as described elsewhere30 . In brief, the gravitational potential is constructed with a triaxial stellar component embedded in a spherical dark matter halo. We first describe a galaxy’s image (SDSS r-band image is adopted) by an axisymmetric 2D multiple Gaussian expansion (MGE) model31 ; that is, the bar, spiral arms, disk warps or dust lanes are not explicitly fitted30 . Then by adopting a set of viewing angles (θ, ψ, ϕ) of the galaxy, we de-project the 2D MGE to a triaxial 3D MGE which describes the stellar luminosity31 . By multiplying a constant stellar mass-to-light ratio Υ* by the 3D luminosity, we obtain the intrinsic mass density of stars. The three viewing angles relate directly to (q, p, u) describing the intrinsic shape of the 3D stellar system29,31 . We leave (p, q) as free parameters to allow intrinsic triaxial shapes, but fix u = 0.9999 so that the intrinsic major axis projects onto the projected major axis. Although the latter is formally only valid for oblate axisymmetric systems like most galaxies, there is no significant change in the results in case of the mildly triaxial giant elliptical galaxies. A spherical Navarro– Frenk–White (NFW) halo is adopted, with concentration c fixed according to its relation with virial mass M200 from cosmological simulations32 . Thus we have four free parameters in the model: the stellar mass-to-light ratio Υ*; q and p describing the intrinsic triaxial shape of the galaxy; and a spherical NFW dark-matter halo mass M200. It is a static potential, and figure rotation is not allowed in the model. The orbit weights are then determined by fitting the orbit-superposition models to the projected and de-projected luminosity density and the 2D line-of-sight stellar kinematics, here the mean velocity and velocity dispersion maps33 . We do not use regularization in the model so that the orbit weights are independent from each other and fully determined by the least linear χ2 fitting. Statistical uncertainties. We find these best-fitting models by an iterative search on the 4D parameter space. In the end, we select all the models, across the 4D space, within χ χ− < Nmin( ) 22 2 obs. In this manner, we find the galaxy’s mass distribution, its intrinsic shape, and the weights of different orbits that contribute to the best-fitting model. We adopt N2 obs as 1σ confidence level30 , where Nobs is the amount of kinematic data constraints. The mean value of orbit distribution of these models, which is usually consistent with that from the single best-fitting model, is taken as the orbit distribution of the galaxy used in Figs. 2, 3, although we illustrate only the orbit distribution of the best-fitting model in Fig. 1. The scatter in the orbit distribution among these models is taken as the 1σ statistical error (σstat). The error bars in Fig. 3 are a combination of the latter statistical uncertainties as well as systematic bias and uncertainties, which we determine next with the help of galaxy simulations. Galaxy simulations. We evaluate the reliability of our dynamical modelling approach by applying it to simulated galaxies and comparing the resulting orbit distribution to the true orbit distribution directly calculated from the full 6D information of particles in the simulated galaxies. We use 15 simulated galaxies with different properties (summarized in Supplementary Table 2). Of these, eight are massive spiral galaxies with a range of features including warm or cold disks, with or without bars, spiral arms, disk warps or gas; two are axisymmetric ellipticals (S0s), two triaxial elliptical galaxies, and another three low-mass spiral galaxies which are dynamically warmer than the massive spiral galaxies. They are from different simulations: one is a pure N-body simulation without gas34 , while the others are hydrodynamical cosmological simulations, five from NIHAO22 , five from Auriga35 and four from Illustris36 . Cold gas is included in the galaxies from NIHAO and Auriga37,38 . Each simulated galaxy (with long, medium and short axes x, y, z) is then projected to the observational plane in the following way: we first rotate the galaxy on the plane (x, y) with an angle ψ (ψ only matters when the galaxy is triaxial or has a structure deviating from axisymmetric, such as a bar); then we project it to the observation plane with an inclination angle θ (the projected angle between the z axis and line-of-sight); and finally we rotate the projected galaxy to have the projected major axis horizontally aligned. We consider projections with different viewing angles (θ, ψ) just as the case of CALIFA galaxies. For each spiral, we randomly choose a ψ and create seven mock data sets with inclination angle θ = 30°–90°. For S1, however, we choose three different ψ to test the effect of bar orientation. For each elliptical galaxy, we randomly produce ten mock data sets with ten pairs of (ψ, ϑ). Finally, we ‘observe’ each projected galaxy and create mock data with CALIFA-like properties30 . With these 15 different simulated galaxies, we create 131 mock data sets in total, having data qualities and orientations generally representative of the CALIFA sample. Each of these 131 mock data set is then taken as an independent galaxy, and Schwarzschild models are constructed to fit the mock observations and infer the best-fit orbit distribution. Next, we calculate the true orbit distribution from the particles with known full 6D information. For the simulated spiral galaxies, we use a single snapshot and select those particles that are close in energy E, angular momentum Lz and the total angular momentum amplitude L. Under the assumption that these particles are on similar orbits in an axisymmetric system, we then compute the corresponding phase-space averages of r and λz. For the elliptical galaxies that are triaxial, we instead take a time-average approach. We take single-snapshot positions of all particles to calculate the corresponding smooth gravitational potential with a tree code39 . Within this ‘frozen’ gravitational potential, we then compute for each particle its orbit starting from the 6D position–velocity values of the particle in the snapshot. After about 200 orbital periods, we then calculate the time-averaged radius r and circularity λz. We checked for two near-axisymmeric simulated galaxies that the phase-space average yields a very similar orbit distribution p(λz, r) to the time-average method, which is computationally costly. For each of the 131 mock data sets, the orbit distributions p(λz, r) obtained by our models generally match well the true orbit distribution of the simulated galaxies (Supplementary Figs. 1 and 2). To quantitatively evaluate the uncertainties of our results, we integrate p(λz, r) over r < Re and obtain p(λz) within Re. We then further divide the orbit distribution p(λz) into cold, warm, hot and counter-rotating (CR) components and calculate the orbit fraction of each component (fcold, fwarm, fhot, fCR). The model-recovered orbit fraction of the four components generally matches the true values one-to-one (Supplementary Fig. 3). Systematic biases and uncertainties. The 15 simulated galaxies include galaxies with different features and Hubble types. To summarize the model uncertainties for different types of galaxies, we define the relative deviation d = (fmodel − ftrue)/fmodel for each single mock data set. The average and standard variations of d are calculated with d = − ∕( )f f fmodel true model and σ σ= − ∕( )d f f f( ) model true model , for each type of galaxy. We consider d d d d, , ,cold warm hot CR as the relative systematic model bias, and σ(dcold), σ(dwarm), σ(dhot), σ(dCR) as the relative systematic error to be added to the statistical uncertainty for each galaxy of a given type. We do not find a clear relationship between the deviations d and the complicated features of spiral galaxies; bars, spiral arms, warps or gaseous disk do not seem to bias our recovery of the whole orbit distributions (Supplementary Fig. 4). We divide the galaxies into four groups: three low-mass spiral galaxies (with total stellar M* ≲ 1010 M⊙), eight high-mass spiral galaxies, two near-axisymmetric lenticular galaxies, and two triaxial elliptical galaxies. For each group of galaxies, we calculate the average d and standard deviation σ(d) for the cold, warm, hot and counter-rotating components as shown in Supplementary Table 3; we consider them representative of the relative systemic bias and relative systemic errors of the corresponding types of CALIFA galaxies. The model-derived orbit distributions of the three simulated low-mass spiral galaxies are similar to those of the low-mass CALIFA galaxies. Nature Astronomy | www.nature.com/natureastronomy
- 5. © 2018 Macmillan Publishers Limited, part of Springer Nature. All rights reserved. LettersNature Astronomy The fit is uncertain for simulated galaxy g2.42e11: this shows an off-centre non-symmetric maximum velocity dispersion, which may or may not be physical, but cannot be fitted irrespective of the reason. For very face-on spiral galaxies with θ < 30°, the uncertainty caused by de-projection is higher; we have roughly a 50% chance of significantly over-estimating the cold and counter-rotating component fraction, while under-estimating the warm and hot components. In the CALIFA sample, we have only two spiral galaxies with θ < 20° and another five with 20° < θ < 30°. The stellar orbit distributions of these seven galaxies do not show a typical biased pattern, and there is no noticeable difference in our results by excluding them. Overall uncertainties. The final uncertainties of orbit fractions shown in Fig. 3 include statistical errors, systematic biases and systemic errors. The scatters of orbit fractions in the models within the previously estimated 1σ confidence level are used as statistical errors with typically σstat ≈ 0.2fmodel. We obtained systematic biases D= dfmodel and systematic errors σsys = σ(d)fmodel from the above tests representing a typical low-mass spiral, high-mass spiral, lenticular or elliptical galaxy. There are n ≈ 30 galaxies in each bin in Fig. 3. We then first take equal length for the lower and upper error bar σ σ= ∕ ni 2 with σ σ σ= +i 2 stat 2 sys 2 for each galaxy. Then we include the systematic bias D D= i in the upper or lower error bar according to its sign. For instance, if D< 0, it means the model under-estimates the value, and thus we increase the upper error bar by D to cover the true value. Caveats. In the final sample of 250 galaxies, there are 69 galaxies with strong bars, 52 with weak bars and 129 with no bar, classified by eye. Generally, we find that the barred and unbarred galaxies have similar orbit distributions as a function of total stellar mass, although galaxies with strong bars have a slightly higher fraction of cold orbits. This, however, is a result of bars being more frequent in late-type galaxies with cold disks and less likely in early-type galaxies. We select 31 galaxies with dust lanes by eye within the 269 isolated galaxies with Rmax > Re. We find that for the 12 near-edge-on galaxies (with inclination angle θ > 70°), their orbit distributions are comparable to the dust-free galaxies at the same inclination angle regions and same mass ranges. The 19 dusty galaxies that are more face-on have a significantly lower fraction of cold orbits and more counter-rotating orbits than the dust-free galaxies of similar inclination angles and masses. We presume that the orbit distributions of the 19 dusty (more face-on) galaxies are biased by our modelling process, which does not include the effect of dust. It is hard either to correct the effects of dust in our model or to evaluate the effect by testing with simulated galaxies. Thus we exclude these 19 galaxies from the sample and keep only the remaining 250 galaxies for further consideration. There are some spuriously high-velocity dispersion bins in the outer region of CALIFA data, owing to the limited spectral resolution33 . We created new kinematic maps by removing the points with S/N < 20 but simultaneously dσ/σ < 0.2; they usually have a significantly higher dispersion than other bins in the galaxy. Removing these points makes a notable difference in the kinematic map for 50 galaxies, which are mostly late-type spirals. We run the models with the original kinematic maps (no data points excluded) and with the new kinematic maps (points excluded), for these 50 galaxies. Nearly 90% of the spuriously high dispersion points are in outer regions r > Re of galaxies. The orbital distribution within Re are only mildly affected by these points and do not affect the inferred orbital distribution. For the 50 selected galaxies, we take the orbital distribution from the best-fitting models constrained by the data with these points excluded. Because of the limited data coverage, we present only the orbit distribution within Re. The overall orbit distribution of a galaxy could be different in two aspects: first, the near-circular cold orbits may be more prominent in the outer regions, and second, we use the time-averaged radius r to describe each orbit; therefore, in particular, low-angular momentum orbits at their apocentres extend well beyond r, and hence Re. We need kinematic maps extending to larger radii to overcome these caveats. However, the present results could be used for direct comparison with the inner regions of simulated galaxies. Data availability. The data of Fig. 3 are included in the Supplementary Information. Other related data that support this study are available from the corresponding author upon reasonable request. Received: 2 May 2017; Accepted: 23 November 2017; Published: xx xx xxxx References 1. Mo, H., van den Bosch, F. C. & White, S. Galaxy Formation and Evolution (Cambridge Univ. Press, Cambridge, 2010). 2. White, S. D. M. & Rees, M. J. Core condensation in heavy halos—a two-stage theory for galaxy formation and clustering. Mon. Not. R. Astron. Soc. 183, 341–358 (1978). 3. Lagos, C. d. P. et al. Quantifying the impact of mergers on the angular momentum of simulated galaxies. Preprint available at https://arxiv.org/ abs/1701.04407 (2017). 4. Röttgers, B., Naab, T. & Oser, L. Stellar orbits in cosmological galaxy simulations: the connection to formation history and line-of-sight kinematics. Mon. Not. R. Astron. Soc. 445, 1065–1083 (2014). 5. Bird, J. C. et al. Inside out and upside down: tracing the assembly of a simulated disk galaxy using mono-age stellar populations. Astrophys. J. 773, 43 (2013). 6. Sánchez, S. F. et al. CALIFA, the calar alto legacy integral field area survey. I. Survey presentation. Astron. Astrophys. 538, A8 (2012). 7. Aihara, H. et al. The eighth data release of the sloan digital sky survey: first data from SDSS-III. Astrophys. J. Suppl. Ser. 193, 29 (2011). 8. Walcher, C. J. et al. CALIFA: a diameter-selected sample for an integral field spectroscopy galaxy survey. Astron. Astrophys. 569, A1 (2014). 9. Schwarzschild, M. Self-consistent models for galactic halos. Astrophys. J. 409, 563–577 (1993). 10. Binney, J. Rotation and anisotropy of galaxies revisited. Mon. Not. R. Astron. Soc. 363, 937–942 (2005). 11. Cappellari, M. et al. The SAURON project—X. The orbital anisotropy of elliptical and lenticular galaxies: revisiting the (V/σ, ε) diagram with integral-field stellar kinematics. Mon. Not. R. Astron. Soc. 379, 418–444 (2007). 12. Emsellem, E. et al. The ATLAS3D project—III. A census of the stellar angular momentum within the effective radius of early-type galaxies: unveiling the distribution of fast and slow rotators. Mon. Not. R. Astron. Soc. 414, 888–912 (2011). 13. Brough, S. et al. The SAMI Galaxy Survey: mass as the driver of the kinematic morphology–density relation in clusters. https://arxiv.org/ abs/1704.01169 (2017). 14. Obreja, A. et al. NIHAO VI. The hidden discs of simulated galaxies. Mon. Not. R. Astron. Soc. 459, 467–486 (2016). 15. Freeman, K. C. On the disks of spiral and S0 galaxies. Astrophys. J. 160, 811 (1970). 16. Weinzirl, T., Jogee, S., Khochfar, S., Burkert, A. & Kormendy, J. Bulge n and B/T in high-mass galaxies: constraints on the origin of bulges in hierarchical models. Astrophys. J. 696, 411–447 (2009). 17. Comerón, S. et al. Breaks in thin and thick disks of edge-on galaxies imaged in the Spitzer Survey of Stellar Structure in Galaxies (S4 G). Astrophys. J. 759, 98 (2012). 18. Lagos, C.d. P. et al. Angular momentum evolution of galaxies in EAGLE. Mon. Not. R. Astron. Soc. 464, 3850–3870 (2017). 19. Stinson, G. S. et al. Making galaxies in a cosmological context: the need for early stellar feedback. Mon. Not. R. Astron. Soc. 428, 129–140 (2013). 20. Vogelsberger, M. et al. Introducing the illustris project: simulating the coevolution of dark and visible matter in the Universe. Mon. Not. R. Astron. Soc. 444, 1518–1547 (2014). 21. Schaye, J. et al. The EAGLE project: simulating the evolution and assembly of galaxies and their environments. Mon. Not. R. Astron. Soc. 446, 521–554 (2015). 22. Wang, L. et al. NIHAO project—I. Reproducing the inefficiency of galaxy formation across cosmic time with a large sample of cosmological hydrodynamical simulations. Mon. Not. R. Astron. Soc. 454, 83–94 (2015). 23. Hopkins, P. F. et al. Galaxies on FIRE (Feedback In RealisticEnvironments): stellar feedback explains cosmologically inefficient star formation. Mon. Not. R. Astron. Soc. 445, 581–603 (2014). 24. Falcón-Barroso, J. et al. Stellar kinematics across the Hubble sequence in the CALIFA survey: general properties and aperture corrections. Astron. Astrophys. 597, A48 (2017). 25. Sánchez, S. F. et al. CALIFA, the Calar Alto legacy integral field area survey. IV. Third public data release. Astron. Astrophys. 594, A36 (2016). 26. Cappellari, M. & Copin, Y. Adaptive spatial binning of integral-field spectroscopic data using Voronoi tessellations. Mon. Not. R. Astron. Soc. 342, 345–354 (2003). 27. Kroupa, P. On the variation of the initial mass function. Mon. Not. R. Astron. Soc. 322, 231–246 (2001). 28. Schwarzschild, M. A numerical model for a triaxial stellar system in dynamical equilibrium. Astrophys. J. 232, 236–247 (1979). 29. van den Bosch, R. C. E., van de Ven, G., Verolme, E. K., Cappellari, M. & de Zeeuw, P. T. Triaxial orbit based galaxy models with an application to the (apparent) decoupled core galaxy NGC 4365. Mon. Not. R. Astron. Soc. 385, 647–666 (2008). 30. Zhu, L., van den Bosch, R. & van de Ven, G. Orbital decomposition of CALIFA spiral galaxies. Mon. Not. R. Astron. Soc. 473, 3000–3018 (2018). 31. Cappellari, M. Efficient multi-Gaussian expansion of galaxies. Mon. Not. R. Astron. Soc. 333, 400–410 (2002). 32. Dutton, A. A. & Macciò, A. V. Cold dark matter haloes in the Planck era: evolution of structural parameters for Einasto and NFW profiles. Mon. Not. R. Astron. Soc. 441, 3359–3374 (2014). 33. Falcón-Barroso, J. et al. Stellar kinematics across the Hubble sequence in the CALIFA survey: General properties and aperture corrections. Astron. Astrophys. 597, A48 (2017). Nature Astronomy | www.nature.com/natureastronomy
- 6. © 2018 Macmillan Publishers Limited, part of Springer Nature. All rights reserved. Letters Nature Astronomy 34. Shen, J. et al. Our Milky Way as a pure-disk galaxy: a challenge for galaxy formation. Astrophys. J. Lett. 720, L72–L76 (2010). 35. Grand, R. J. J. et al. The Auriga Project: the properties and formation mechanisms of disc galaxies across cosmic time. Mon. Not. R. Astron. Soc. 467, 179–207 (2017). 36. Nelson, D. et al. The Illustris simulation: public data release. Astron. Comput. 13, 12–37 (2015). 37. Stinson, G. S. et al. NIHAO III: the constant disc gas mass conspiracy. Mon. Not. R. Astron. Soc. 454, 1105–1116 (2015). 38. Marinacci, F. et al. Properties of H i discs in the Auriga cosmological simulations. Mon. Not. R. Astron. Soc. 466, 3859–3875 (2017). 39. Barnes, J. & Hut, P. A hierarchical O(N log N) force-calculation algorithm. Nature 324, 446–449 (1986). Acknowledgements This study uses the data provided by the Calar Alto Legacy Integral Field Area (CALIFA) survey (http://califa.caha.es) based on observations collected at the Centro Astronómico Hispano Alemán at Calar Alto, operated jointly by the Max-Planck Institut für Astronomie and the Instituto de Astrofísica de Andalucía. We thank A. van der Wel, K. Jahnke, V. Debattista and M. Fouesneau for discussions. G.v.d.V. and J.F.-B. acknowledge support from the DAGAL network from the People Programme (Marie Curie Actions) of the European Unions Seventh Framework Programme FP7/2007–2013 under REA grant agreement number PITN-GA-2011-289313. G.v.d.V. also acknowledges support from the Sonderforschungsbereich SFB 881 “The Milky Way System” (subprojects A7 and A8) funded by the German Research Foundation, and funding from the European Research Council under the European Union’s Horizon 2020 research and innovation programme under grant agreement no. 724857 (Consolidator grant ‘ArcheoDyn’). This work was supported by the National Science Foundation of China (grant no. 11333003, 11390372 to SM). A.O. has been funded by the Deutsche Forschungsgemeinschaft (German Research Foundation) – MO 2979/1–1. J.F.-B. acknowledges support from grant AYA2016-77237-C3-1-P from the Spanish Ministry of Economy and Competitiveness. R.J.J.G. acknowledges support by the DFG Research Centre SFB-881 ‘The Milky Way System’ through project A1. Author contributions Text, figures and interpretation are by L.Z., G.v.d.V., H.-W.R., M.M. and S.M. Modelling is by L.Z., R.v.d.B. and G.v.d.V. Observational data are from J.F.B., M.L., G.v.d.V., J.C.W., R.G.B., S.Z. and S.F.S. Methodology is by L.Z., D.X., Y.J., A.O., R.J.J.G., A.V.M., A.A.D. and F.A.G. Competing interests The authors declare no competing financial interests. Additional information Supplementary information is available for this paper at https://doi.org/10.1038/ s41550-017-0348-1. Reprints and permissions information is available at www.nature.com/reprints. Correspondence and requests for materials should be addressed to L.Z. Publisher’s note: Springer Nature remains neutral with regard to jurisdictional claims in published maps and institutional affiliations. Nature Astronomy | www.nature.com/natureastronomy