1. arXiv:astro-ph/0410081v14Oct2004
To appear in “1604-2004: Supernovae as Cosmological Lighthouses,” a conference held June
2004 in Padua, Italy; to be published as an ASP Conference Proceedings.
Kepler’s Supernova Remnant: The View at 400 Years
W. P. Blair
Department of Physics & Astronomy, The Johns Hopkins University,
3400 N Charles St., Baltimore, MD, 21218 USA
Abstract. October 2004 marks the 400th anniversary of the sighting of
SN 1604, now marked by the presence of an expanding nebulosity known as
Kepler’s supernova remnant. Of the small number of remnants of historical
supernovae, Kepler’s remnant remains the most enigmatic. The supernova type,
and hence the type of star that exploded, is still a matter of debate, and even the
distance to the remnant is uncertain by more than a factor of two. As new and
improved multiwavength observations become available, and as the time baseline
of observations gets longer, Kepler’s supernova remnant is slowly revealing its
secrets. I review recent and current observations of Kepler’s supernova remnant
and what they indicate about this intriguing object.
1. Introduction
Four hundred years ago, when Johannes Kepler and others observed the “new
star” of 1604, those observing the event had no concept of what it was that
they were observing. Today we know that supernovae are exploding stars and
that they even come in different varieties. The type Ia SNe, which have become
so important for cosmology because they are standard candles, arise from the
incineration of white dwarf stars. The other main class, core collapse SNe, come
from more massive stars and produce the sub-classes called type Ib, type Ic,
and type II. Of the six historical SNe in our Galaxy that have occurred over
the last millennium (including Cas A for which the SN itself apparently escaped
detection), only Kepler’s SN has remained uncertain as to the type of the star
that exploded.
Today of course, what we observe is the expanding young supernova rem-
nant (SNR) that resulted from the explosion. By studying this SNR across the
electromagnetic spectrum, modern astronomers are still trying to discern a clear
picture of the precursor star of this event. In doing so, they are hindered by the
lack of an accurate distance to the object, which makes the derivation of even
basic properties like the diameter or mean expansion velocity uncertain. In this
paper, I will review the current observational status of this enigmatic object and
point out some of the apparent inconsistencies in existing interpretations.
2. Observational Parameters
Kepler’s SNR is located at galactic coordinates l = 4.5◦ and b = 6.8◦ (i.e.,
nearly directly toward the galactic center from the sun but significantly out of
the plane). The full extent of the remnant is most visible in radio and X-ray
1
2. 2 Blair
regimes, where a circle of diameter 200′′ encompasses the entire shell except for
two “ears” of emission on the east and west sides (see Figure 1).
Unfortunately, the distance to Kepler’s SNR is only poorly constrained by
observations to date. Most recent literature cites the study by Reynoso & Goss
(1999) and adopts a distance near 5 kpc. However, a careful reading of this
paper shows that many authors misquote or misunderstand Reynoso & Goss’s
result. These authors use the H I kinematics with a galactic rotation model
to place a rather inaccurate “lower limit” of 4.8 ± 1.4 kpc on the distance,
and independently place an “upper limit” of 6.4 kpc based on the proposed
association of the SNR with an H I cloud. Kinematic distances are inherently
uncertain along the line toward the galactic center. Table 1 shows how some
basic parameters for the SNR depend critically on the assumed distance. In
particular, note that the larger distances imply a very large distance off the
galactic plane and, when combined with the observed current shock velocity,
apparently require a very significant deceleration, which is not consistent with
the absence of a well-defined reverse shock in the X-ray data.
Table 1. Kepler’s SNR: The Affect of the Distance Uncertainty
Parameter D=3.0 kpc D=4.5 kpc D=6.0 kpc
Z Distance (pc) 355 533 710
Radius (pc) 1.45 2.18 2.90
< Vexp > (km s−1
) 3540 5310 7080
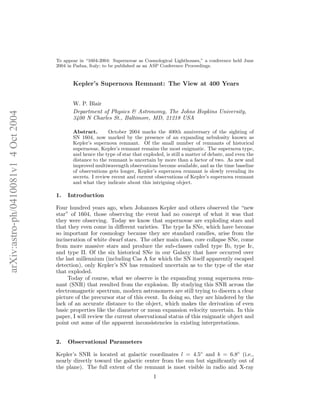
In Figure 1, I show 6 cm VLA radio (DeLaney et al. 2002) and 0.2 - 10
keV Chandra X-ray observations (Hwang et al. 2000) of Kepler’s SNR. The
overall similarity is striking, showing a roughly spherical thick shell of emission
brightest in the north. The apparent band of emission cutting across the middle
from NW to SE is largely an illusion, caused by projection effects from material
on the front and back sides of the shell (see optical section below).
Figure 1. (left) VLA 6 cm radio map of Kepler’s SNR, from DeLaney et al.
(2002). (right) Chandra 0.2 - 10 keV X-ray data from Hwang et al. (2000).
3. Kepler at 400 3
However, this apparent similarity may be deceiving. Flat and steep radio
spectrum deconvolutions look quite different from the total intensity maps, and
soft (0.3 - 1.4 keV) and hard (4 - 6 keV) X-ray bands, either from Chandra or
XMM-Newton (Cassam-Chena¨i et al. 2004) also show different structures. (In
particular, the harder X-rays form a distinct outer rim likely associated with
the primary shock wave.) Also, when one looks at the dynamics of the SNR,
discrepancies are seen. Both radio and X-ray observations extend over a long
enough baseline that expansion of the SNR has been measured. Hughes (1999)
finds an X-ray expansion rate of R ∝ t0.93, which is nearly free expansion. This
is almost twice that found in the radio (R ∝ t0.50, Dickel et al. 1988; DeLaney
et al. 2002). The reason for this discrepancy is not understood.
Optical observations (Blair, Long, & Vancura 1991) are brightest in the
NW, with the northern cap and isolated central patches of emission also visible
(see Figure 2). The optical data indicate substantial and variable foreground
extinction, with E(B-V) = 1.0 ± 0.2, consistent with and X-ray determined
N(H) = 5.0 × 1021 cm−2. Bandiera & van den Bergh (1991) performed a careful
study of the space velocity of the object, finding a value of 278 km s−1 toward
the NW, which is away from the galactic plane. Assuming this motion is due
to the precursor star, this would account for the large angular distance off the
galactic plane and the observed morphology in all bands, showing the brightest
emission in the N and NW.
Figure 2. Ground-based Hα image of Kepler’s SNR (from Blair et al. 1991)
is shown. A continuum image has been subtracted although some stellar
residuals remain. Insets show Hα + [N II] region optical spectra of the regions
indicated. Note the broad and narrow components on the Hα line at some
positions. Blue-shifted broad components indicate approaching (near side of
shell) emission while red-shifted material is from the back of the shell.
The optical emission comes from two components: radiative shocks into
dense, knotty structures (presumably circumstellar mass loss), and smoother
filamentary emission visible only in Hα from so-called nonradiative shocks (e.g.
Blair et al. 1991; Sollerman et al. 2003). The radiative knots show enhanced
[N II]/Hα, indicative of probable enrichment from the precursor. Interpretation
4. 4 Blair
of the broad line components in the nonradiative shocks (e.g. Chevalier, Kirsh-
ner, & Raymond 1980) indicate a current shock velocity of about 1750 ± 250
km s−1.
Relatively little information is available in the infrared. The SNR is small
enough in angular size that IRAS data are not useful. However, Douvion et
al. (2001) observed Kepler’s SNR with thr Infrared space Observatory’s ISO-
CAM (see Figure 3). The morphology of the ∼12 µm emission is very similar to
the optical, and 6 - 16 µm spectra are well-fitted by shock-heated dust models
with Tdust = 95 - 145 K, ne of several thousand (similar to optical [S II] densi-
ties), and Te of several hundred thousand K. This makes it very likely that the
ISO emission arises primarily from dust heated directly by the primary shock
front. SCUBA sub-mm observations at 450 µM and 850 µm by Morgan et al.
(2003) were interpretted as indicating a large mass (∼ 1 M⊙ of cold (T = 17 K)
dust in the remnant, but this result has been called into question (Dwek 2004).
Upcoming Spitzer Space Telescope observations may resolve this issue.
Figure 3. ISOCAM 14 - 16 µm image of Kepler’s SNR (from Douvion et
al. 2001). Boxes mark regions for extracted spectra, which show warm (95
-145 K) thermal dust emission. The emission in boxes a-e accounted for 92%
of the detected emission. Note the similarity to the distribution of optical
emission in Figure 2.
3. Whither the SN Type?
The literature is extremely confusing on the issue of the SN type. Baade (1943)
reconstructed the historical light curve and claimed a type Ia designation, a
5. Kepler at 400 5
result that is still quoted in many recent papers. However, Doggett & Branch
(1985) showed consistency with a type II-L light curve, and Schaefer (1996) has
also called the historical curve and type Ia designation into question.
A decade ago, the preponderance of evidence seemed to point toward a
core-collapse event, and much of this evidence is still relevant. A large distance
off the galactic plane might be suggestive of a white dwarf precursor, but high
space motion away from the plane and N-rich circumstellar material points to
a massive runaway star from an earlier SN as the precursor for Kepler’s SNR.
Borkowski et al. (1992, 1994) developed a massive star model that was consistent
with observations available at that time. However, X-ray analyses in particular,
from Exosat (Smith et al. 1989; Decourchelle & Ballet 1994; Rothenflug et al.
1994), ASCA (Kinugasa & Tsunemi 1999), Chandra (Hwang et al. 2000), and
now XMM-Newton (Cassam-Chena¨i et al. 2004) have alternately claimed better
fits to type Ia or core collapse models.
Figure 4. Two sub-fields in the northwestern portion of Kepler’s SNR,
as seen with the HST Advanced Camera for Surveys, using filter F680N
(Hα+[N II]). Bright knots (left panel) show the encounter of the blast wave
with dense circumstellar knots. The fainter wispy filaments, especially visible
at right, are nonradiative shocks delineating the actual shock front position.
The black square at lower left in each panel is 2′′
. Comparison of the motion
of the wispy filaments to the ground-based data in Figure 2, with assump-
tions about the shock velocity, will yield a much better distance estimate in
the near future. (Figure courtesy R. Sankrit, JHU.)
The modelling of XMM-Newton data by Cassam-Chena¨i et al. (2004) is the
most careful and accurate to date. Although these authors do not claim to have
determined the SN type, their determination of Si and Fe abundances similar
to type Ia models and their lack of detection of overabundances of O, Ne, Ar, S
as seen in core collapse objects such as Cas A (Hughes et al. 2000), is a strong
indicator of a type Ia event. I also note that, even with its exquisite sensitivity
and resolving power, the Chandra observation has failed to detect any hint of
a stellar remnant (quite in contrast to the situation with Cas A!). While the
6. 6 Blair
issue may not be closed, the pendulum has swung back toward a white dwarf
precursor star. This is not an entirely comfortable situation. If the type Ia
designation is correct, then the closest example of our cosmological standard
candle has some very peculiar properties!
At least one significant near term advance is in the offing. Recent optical
HST ACS images have been obtained (see Figure 4) that not only show the
bright optical filaments in exquisite detail, but will permit the proper motion
of key filaments to be measured. With a refined estimate of the shock velocity
from X-ray and optical data, it should soon be possible to measure the distance
to Kepler’s SNR with relative precision.
Johannes Kepler was an intriguing personality (Ferguson 2002). He came
from extremely humble beginnings, he possessed a fierce and staunch religious
faith that was entwined with his world view but at odds with his contemporary
culture, and he was a visionary scientist. While understanding the new star of
1604 was a sidelight for him, I think he would be secretly pleased to know that
his name has been attached to this equally intriguing supernova remnant.
Acknowledgments. I thank the conference organizers for inviting me to
present this review and for partial support. This work was also supported by
STScI grant GO-09731A to the Johns Hopkins University.
References
Baade, W. 1943, ApJ, 97, 119
Bandiera, R., & van den Bergh, S. 1991, ApJ, 374, 186
Blair, W. P., Long, K. S., & Vancura, O. 1991, ApJ, 366, 484
Borkowski, K. J., Sarazin, C. L., & Blondin, J. 1992, ApJ, 400, 222
Borkowski, K. J., Sarazin, C. L., & Blondin, J. 1994, ApJ, 429, 710
Cassam-Chena¨i, G. Decourchelle, A., Ballet, J., Hwang, U., Hughes, J., & Petre, R.
2004, A&A, 414, 545
Chevalier, R. A., Kirshner, R. P., & Raymond, J. C. 1980, ApJ, 235, 186
Decourchelle, A., & Ballet, J. 1994, A&A, 287, 206
DeLaney, T., Koralesky, B., Rudnick, L. & Dickel, J. R. 2002, ApJ, 580, 914
Dickel, J. R., Sault, R. Arendt, R. G., Maysui, Y., & Korista. K. T. 1988, ApJ, 330,
254
Doggett, J. B., & Branch, D. 1985, AJ, 90, 2303
Douvion, T., Lagage, P. O., Cesarsky, C. J., & Dwek, E. 2001, A&A, 373, 281
Dwek, E. 2004, ApJ, 607, 848
Ferguson, K. 2002, “Tycho and Kepler,” (New York: Walker & Company)
Hughes, J. P. 1999, ApJ, 527, 309
Hughes, J. P., Rakowski, C., Burrows, D. N., & Slane, P. O. 2000, ApJ, 528, 109
Hwang, U., Holt, S. S., Petre, R., Szymkowiak, A. E., Borkowski, K. J. 2000, BAAS,
32, 1236
Kinugasa, K., & Tsunemi, H. 1999, PASJ, 51, 239
Morgan, H. L., Dunne, L., Eales, S. A., Ivison, R. J., & Edmunds, M. G. 2003, ApJ,
597, L33
Reynoso, E. M., & Goss, W. M. 1999, AJ, 118, 926
Rothenflug, R., Magne, B., Chieze, J. P., & Ballet, J. 1994, A&A, 291, 271
Schaefer, B. E. 1996, ApJ, 459, 438
Smith, A., Peacock, A., Arnaud, M., Ballet, J., Rothenflug, R., & Rocchia, R. 1989,
ApJ, 347, 925
Sollerman, J., Ghavamian, P., Lundqvist, P., & Smith, R. C. 2003, A&A, 407, 249