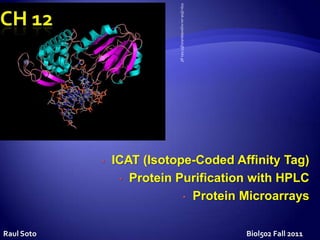
3. Identification and quantification of complex
protein mixtures (quantitative proteomics)
Uses chemical labeling reagents that specifically
label a Cys residues
in vitro method
Gel – free
4. Biotin Affinity tag: enables Thiol-Specific Reactive group: binds
the isolation of the covalently and labels Cysteine residues
peptide/protein by affinity
chromatography
O
Linker:
Heavy version will have deuteriums at *
NH Light version will have hydrogens at *
NH
H H
N * O O * N
*
I
* O
O
S O
5. 4 Main Steps: 1
Gygi S, et al (1999)
1 Lyse and Label: Side chains of Cys
1.
residues in reduced protein sample for
one cell state are tagged with light ICAT. 2
Equivalent groups in protein sample for
the second cell state are tagged with the
heavy ICAT. 3
4
2 Proteolysis: The two samples are
2.
combined and enzymatically cleaved to
produce peptide fragments. Some of
these fragments will be tagged
3 Affinity isolation: Tagged, Cys-
3.
containing fragments are isolated using
avidin chromatography
4 ID and quantification: Isolated peptides
4.
are separated and analyzed using LC-
MS/MS
6. 1 Lyse and Label
Label sample 1 (cell state 1) with
isotopically light probe (d0)
Label sample 2 (cell state 2) with
isotopically heavy probe (d8)
http://oscar.iitb.ac.in/oscarHome.do
7. 2 Proteolysis
Mix the samples together
Cleave enzymatically to
generate peptide
fragments. Some fragments
will contain the ICAT tag
http://oscar.iitb.ac.in/oscarHome.do
8. 3
Affinity isolation
Subject both samples to avidin affinity chromatography
Isolates fragments labeled with isotope-coded tags
Uses specific interaction between immobilized avidin on the column and
biotin on the linker
http://oscar.iitb.ac.in/oscarHome.do
9. Biotin Affinity tag: enables Thiol-Specific Reactive group: binds
the isolation of the covalently and labels Cysteine residues
peptide/protein by affinity
chromatography
O
Linker: Heavy version will have
deuteriums at *
NH Light version will have hydrogens at *
NH
H H
N * O O * N
*
I
* O
O
S O
10. ID and quantification
4
http://oscar.iitb.ac.in/oscarHome.do
LC-MS/MS (Liquid chromatography – tandem mass
spectrometry):
Determines quantity and sequence identity of proteins from which
the tagged peptides were obtained
Technique can be used for complex protein mixture
http://oscar.iitb.ac.in/oscarHome.do
11. ICAT Helps you answer questions such as:
Which proteins are being expressed in
Experimental vs Control?
Which proteins are up-regulated or down-regulated
in Experimental vs Control?
How much are proteins A, B, C being up/down-
regulated?
12. Advantages Disadvantages
Accurate: Relative protein Bias for Cys-rich proteins
levels between samples can be
estimated within 10% accuracy Large ICAT reagent interferes
with MS fragmentation
Can be used on complex
New: Cleavable reagent that can
mixtures of proteins be removed after separation,
before MS
Highly automated
Tag size reduces the quality of
Peptides sequenced directly
MS data
using MS/MS
Expensive
13. Example (Gygi, 1999)
Compared protein expression in yeast S. cerevisiae, using ethanol or
galactose as carbon source
Detected differences in protein expression were consistent with known
metabolic function in yeast under glucose-repressed conditions.
Gygi S, et al (1999)
16. What is it?
Process to isolate a single type of protein from a complex mixture
Why?
Research: Purified protein necessary to characterize the function,
structure, and interactions of a protein of interest
Drug Development : Protein-based drug formulation development
Drug Manufacturing: at significantly larger volumes
How?
Using differences in protein size, charge, physical and chemical
properties, binding affinity, biological activity.
17. Flasks 5 mL
Spinner flasks (roller bottles) 50-200mL
Bench Top Bioreactors 5-10 L
http://www-ext.amgen.com/science/biotechnology_introduction.html
Pilot Scale Bioreactors 50-200L
Production Vessels 20,000 L
18. Protein molecules in a solution (mobile phase) are
separated based on differences in chemical or
C
physical interaction with a stationary material (solid
phase). O
Gel filtration (size) L
Size-exclusion (size) U
Ion-exchange (charge)
Affinity chromatography : (binding affinity) M
Receptor / ligand
N
Enzyme / substrate
Immunoaffinity : antigen / antibody
Metal Binding : covalent bond of residues (esp.
histidine) to metals (Ni2+, Cu2+, Zn2+, Bi3+)
19. STEP 1 : prepare solid phase: a solid
matrix with a ligand coupled (usually
covalently)
Matrix: agarose, sephadex, cellulose, other
polymers)
STEP 2: pass mobile phase through the
solid phase
the target protein will bind noncovalently to
the ligand molecules in the solid phase’s
resin matrix.
The rest of the mobile phase elutes out of
http://www.molecular-
the colum modelling.ch/images/projects/DD-EADock-large.jpg
20. STEP 3 : Unbind protein of interest from the
solid phase.
An elution buffer disrupts protein-ligand
interaction (pH extremes, high salt,
detergents, chaotrophic agents, etc.)
Denaturing agents like urea can also break
protein-ligand interaction by changing the
configuration of the protein active site.
A single pass through an affinity column can
achieve 1,000 – 10,000 fold purification of
a ligand from a mixture
http://fig.cox.miami.edu/~cmallery/255/255hist/ecbxp4x3_c
hrom.jpg
21. HPLC : High performance/pressure liquid
chromatography
A highly improved form of column chromatography
Substance is forced to elute through the column
under high pressures (up to 400 bar in HPLC, up
to 6,800 bar in Ultra HPLC).
FPLC : Fast Protein Liquid Chromatography
Standard working pressure is “only” 3 – 5 MPa
http://www.testequipmentconnection.com/images
(approx 30 – 50 bar) /products/Agilent-
HP_1100_Series_HPLC_MWD_System.JPG
22. Advantages of using HPLCs over regular
column chromatography:
Higher throughput
Faster
Can use much smaller particle size for
http://www.mournetrainingservices.co.uk/ESW/Ima
ges/HPLC_vials_on_autosampler.jpg
column packing material, which means
greater surface area for interactions
between mobile and solid phases
Highly automated, can use extremely
sensitive detection methods
Autosampler: HPLC can run several
samples in order
http://www.dreamstime.com/hplc-autosampler-thumb13805169.jpg
23. http://en.wikipedia.org/wiki/File:HPLC_apparatus.svg
text
HPLC Apparatus Overview
1. Solvent reservoirs 7. Sample injection loop
2. Solvent degasser 8. Pre-column (guard column)
3. Gradient valve 9. Analytical column
4. Mixing vessel for delivery of the mobile 10. Detector (IR, UV)
phase 11. Data acquisition (PC)
5. High pressure pump 12. Waste or fraction collector
6. Switching valve in “inject” position
6’. Switching valve in “load” position
24. Bottle tray kits
Solvent
reservoirs PC: processing,
display, file
C Pre-heaters (LIMS, CDS)
O Heaters / Coolers
L Multiple columns Raw data
U Auto-switching
Pump
M
N
Detector
Sample
Purified protein
injector
Autosamplers
Heaters / coolers
• Mass Spec
• sample storage
25. Different peaks correspond to different components in the mixture
Y axis – absorbance
X axis – time, % concentration, flow rate
Qualitative assessments:
compare peak positions vs
standard
Quantitative assessments:
assessment of relative
concentrations of components
can be obtained from peak area
comparisons
Column performance: indicated
by comparison against standards
http://www.mtr-ltd.com/chem/chromatogram1.gif
26. Normal Phase: Reversed Phase (most common):
Hydrophilic silica particles in solid Hydrophobic hydrocarbon chains
phase in solid phase
Hydrophobic solvent Hydrophilic solvent
Hydrophilic molecules in mobile Hydrophobic molecules in the
phase bind to solid phase mobile phase form van der Waals
Hydrophobic molecules flow out bonds with hydrophobic
first hydrocarbons in solid phase
Elution: from most to least Hydrophilic molecules in the
hydrophobic. mobile phase interact with
hydrophilic solvent and flow out
first
Elution: from least to most
hydrophobic
27. Process Step
Column Process Step
down
Flow direction
Equilibration
(equilibration / wash 1 buffer) Column
up
Flow direction
Regeneration
(regeneration buffer)
down
Load
(harvest filtrate w/ protein)
down
Wash 1 Blank Elution
4 – 6 cycles
(equilibration/ wash 1 buffer)
Sequence
down
(after last cycle, if required)
STORAGE
down
Wash 2 EQUILIBRIUM
(wash 2 buffer)
down
Elution
down
(elution buffer)
Column Storage
(storage buffer)
down
Cleaning
(cleaning solution)
30. A high density array containing
100’s – 1,000’s of proteins
positioned in an addressable
format
Proteins or peptides are
individually purified and arrayed
on a surface (i.e. glass slide)
Can screen multiple proteins
simultaneously
2 main types: Functional and
Analytical http://www.whatman.com/FASTSlides.aspx
31. Diffusion
Protein suspended in
Diffusion
random orientation, but
presumably active
Adsorption/
Absorption
Adsorption/Absorption
Some proteins inactive
Covalent
Covalent attachment
Some proteins inactive
Affinity
Affinity
Orientation of protein
precisely controlled
videocast.nih.gov/pdf/rm/Snyder.pdf
32. Antigen–
Different capture molecules antibody
must be used to study
different interactions
Protein–
protein
Examples
Antibodies (or antigens) for
detection Aptamers
Proteins for protein-protein
Enzyme–
interaction
substrate
Enzyme-substrate for
biochemical function Receptor–
ligand
Aptamer = single-stranded short oligonucleotides videocast.nih.gov/pdf/rm/Snyder.pdf
34. Can be used to identify substrates of
enzymes of interest
Identify protein targets of biologically
active small molecules (drug and drug
target ID)
Protein – protein interactions
Post-translational modifications
Useful for rapid high-throughput
videocast.nih.gov/pdf/rm/Snyder.pdf analysis of proteomes and other large
collections of proteins
35. Different types of ligands (antibodies,
antigens, nucleic acid aptamers,
carbohydrates, small molecules) with high
affinity and specificity, are arrayed onto a
surface
Quantify levels of different proteins by
binding exact proteins to microarray
Monitoring protein expression levels,
protein profiling
Clinical diagnostics
videocast.nih.gov/pdf/rm/Snyder.pdf Similar to DNA arrays, protein samples
from two biological states can be compared
by labeling with red and green fluorescent
dyes
Aptamer = single-stranded short oligonucleotides
36. Characteristic Protein MA DNA MA
Target Large 3D molecule Smaller 2D molecule
Binding 3D affinity 2D sequence
Stability Low High
Amplification Cloning PCR
Biochemical Behavior Proteins behave in DNA will behave similarly
diverse and unique under single hybridization
ways condition
Cost $500-$1000 per $10 per oligo
antibody
37. Non-specific binding:
Adjust solute conditions: salt concentration, pH, etc
Protein on array surface not in the right conformation
The protein should be folded, not denatured
The protein orientation should be correct (anchored by the same aminoacid)
The protein should be kept away from the surface by a linker, to avoid steric
hindrance
Denaturation
Solution conditions
Different proteins like different conditions, no binding may be caused by
inappropriate conditions (pH, temperature, etc.)
Variability in results may be reduced by using an efficient lysis buffer,
maintaining consistent sample processing conditions
39. [1] Gygi SP, Rist B, Gerber SA, Turecek F, Gelb MH, Aebersold R (October 1999). "Quantitative analysis of complex protein
mixtures using isotope-coded affinity tags".Nature Biotechnology 1999. 17 (10): 994-9. PMID 10504701.
[2] Isotope-coded affinity tags (ICATs) – Wikipedia
http://en.wikipedia.org/wiki/Isotope-coded_affinity_tag Accessed 03 Dec 2011.
[3] Project OSCAR : Quantitative Proteomics – ICAT
http://oscar.iitb.ac.in/onsiteDocumentsDirectory/Quantitative%20Proteomics%20-
%20ICAT/Quantitative%20Proteomics%20-%20ICAT/Contents/print.pdf Accessed 03 Dec 2011.
[4] Sethuraman M, et al. Isotope-coded Affinity Tag Approach to Identify and Quantify Oxidant-sensitive Protein Thiols.
Molecular & Cellular Proteomics 2004. 3:273-278. PMID: 14726493.
[5] Sethuraman M, et al. Isotope-coded Affinity Tag (ICAT) Approach to Redox Proteomics: Identification and Quantitation of
Oxidant-Sensitive Cysteine Thiols in Complex Protein Mixtures. Journal of Promeome Research. 2004. 3: 1228-1233.
PMID: 15595732.
[6] Turecek, J. Mass spectrometry in coupling with affinity capture-release and isotope-coded affinity tags for quantitative
protein analysis. Mass Spectrom. 2002, 37, 1-14. PMID 11813306.
[7] US 6670194 "Rapid quantitative analysis of proteins or protein function in complex mixtures," Rudolf Hans Aebersold et
al. (PATENT)
http://worldwide.espacenet.com/publicationDetails/biblio?CC=US&NR=6670194&KC=&FT=E&locale=en_EP Accessed
03 Dec 2011.
40. [1] Affinity Chromatography, University College London
http://www.ucl.ac.uk/~ucbcdab/enzpur/affinity.htm Accessed 03 Dec 11
[2] Chromatography: The Chromatogram, Rensselaer Polytechnic Institute
http://www.rpi.edu/dept/chem-eng/Biotech-Environ/CHROMO/chromgram.html Accessed 03 Dec 11
[3] Chromatography – Wikipedia
http://en.wikipedia.org/wiki/Chromatography Accessed 03 Dec 11
[4] High Performance Liquid Chromatography HPLC, Chemguide
http://www.chemguide.co.uk/analysis/chromatography/hplc.html Accessed 03 Dec 11
[5] High Performance Liquid Chromatography – Wikipedia
http://en.wikipedia.org/wiki/High_performance_liquid_chromatography Accessed 03 Dec 11
[6] Protein Purification – Wikipedia
http://en.wikipedia.org/wiki/Protein_purification Accessed 03 Dec 11
[7] Protein Purification in One Day
http://proteincrystallography.org/protein-purification/ Accessed 03 Dec 11
[8] The Protein Purification Facility, Hebrew University of Jerusalem
http://wolfson.huji.ac.il/purification/ Accessed 03 Dec 11
[9] Thermo Scientific Pierce Protein Purification Technical Handbook
http://www.piercenet.com/files/1602015_PurifHB_INT.pdf Accessed 03 Dec 11
41. [1] Antibody Microarray – Wikipedia.
http://en.wikipedia.org/wiki/Protein_microarray Accessed 03 Dec 11
[2] Chandra H, Reddy PJ, and Srivastava S. Protein Microarrays and Novel Detection Platforms. Expert Rev
Proteomics. 2011; 8:61-79. PMID: 21329428
[3] Fasolo J, Snyder M. Protein Microarrays. Methods in Molecular Biology. 2009; 548:290-222. PMID: 19521827
[4] Merbl Y, Kirschner M. Protein Microarrays for Genome-Wide PostTranslational Modification Analysis. Wiley
Interdiscip Rev Syst Biol Med. 2011; 3(3): 347-56. PMID : 20865779
[5] Phizicky E, Bastiaens PIH, Zhu H, Snyder M and Fields S. Protein Analysis on a Proteomic Scale. Nature. 2003;
422:208-205. PMID: 12634794
[6] Protein Microarray – Wikipedia.
http://en.wikipedia.org/wiki/Protein_microarray Accessed 03 Dec 11
[7] Talapatra A, Rouse R and Hardiman G. Protein Microarrays: Challenges and Promises. Pharmacogenomics. 2002;
3(4). PMID: 12164775
[8] Zhu H and Snyder M. Protein Chip Technology. Current Opinion in Chemical Biology. 2003. 7:55-63. PMID:
12547427
44. “… to define the identities, quantities, structures,
and functions of complete complements of
proteins, and to characterize how these
properties vary in different cellular contexts.”
(Phizicky 2003)
45. More complex than genomics
Organism’s genome remains more or less constant
Proteome changes depending on
Cell type
Tissue
Organ
Development stage (embryo, fetus, child, adult)
Dynamic responses to environmental signals
Disease state
Gene activity
Post-translational modifications
46. Time it takes a particular compound
to travel through the column
Depends on:
Pressure used
Temperature of column
Nature of stationary phase
Solvent composition
You must control all these
conditions carefully if you are using
retention time as a way to identify
compounds.
http://www.waters.com/webassets/cms/library/docs/720000604en.pdf
Editor's Notes
EXTRA NOTES: Reservoir holds the solvent. Usually min 2 reservoirs, each with up to 1,000 cc of solvent. Each reservoir usually fitted with diffuser /degasser through which He is bubbled, dissolve gases from mobile phases Pump generates the specific flow of the mobile phase Sample injection loop : can be manual and/or automated. Autosampler introduces the solvent into phase stream that carries it into the high pressure column Column contains the stationary phase where separation occurs Detector sees the separation bands as they elute out of the column Detector sends info to computer that generates and stores the chromatogram Mobile phase exits detector and is sent to waste or collected.