SlideShare ist ein Scribd-Unternehmen logo
1 von 7
Downloaden Sie, um offline zu lesen
2012 3rd Quarter
                                                                        Market Report
 The voice of real estate in Central Virginia                        CAAR Member Copy – Expanded Edition


Charlottesville Area 3rd Quarter 2012 Highlights:
                                                  2011 Year End Market Report Market
 Overall sales in Greater Charlottesville were up 22.7% over the same quarter last year.
                                                  ReportReport
 The average sales price of $313,445 in the 3rd Quarter was up 6.8% from Q3-2011 and 1.4% from Q2-2012.
 Homes took 23 fewer days to sell on average in Q3-2012 than Q2-2012, and active inventory was down 18.9%
  over Q3-2011.
 Median short sale price in Q3 increases to $176,000 representing a 20.5% jump from $146,000 at the same
  time last year.


                                  Copyright (c) 2012 RealEstate Business Intelligence, LLC. All Rights Reserved
                                             Data Source: CAAR MLS. Statistics calculated October 4, 2012.
3rd Quarter 2012 Sales & Contract Activity

There were 675 homes sold in the Charlottesville area in the third quarter, which was up 22.7% (+125 sales) from the
third quarter last year and the highest Q3 sales pace since 2009. Total units sold in this quarter are strong as compared
over the same time in 2010 and 2011, with 593 and 550 units sold in the same period.


Albemarle County (+28%) had the largest year-over-year increased (+72) sales at 329 during the quarter, while Fluvanna
(+37.1%) picked up 23 more sales to record 85, and Charlottesville (+12.4%), Greene (+4.2%), and Nelson (+73.1% or 19
sales) also showed annual gains for the quarter. Only Louisa County (-11.4%) experienced a decline in sales volume from
Q3-2011 levels.


                             Copyright (c) 2012 RealEstate Business Intelligence, LLC. All Rights Reserved
                                   Data Source: CAAR MLS. Statistics calculated October 4, 2012.

Days on Market (DOM)

Homes took 23 fewer days to sell on average in Q3-2012 than Q2-2012, down in average days on market (DOM) to 127
from 150 days in last quarter. Homes sold fastest on average in Louisa (101 days), Charlottesville (103 days) and
Albemarle (112 days). Greene (170 days), Fluvanna (143 days) and Nelson (256 days) each had a higher average DOM
than the region at large.

For the Greater Charlottesville region, attached homes continue to sell faster on average than detached homes. The
average DOM of 108 for attached homes was down 23 days (-17.6%) over the Q3-2011 level, and dropped by 20.6% over
the average DOM of 136 last quarter. The average DOM of 134 days for detached homes is a noticeable drop of 13% over
the last quarter, selling in 20 fewer days.

There was 16.7% year-over-year improvement in the median DOM for Greater Charlottesville, with half the homes sold in
the 3rd Quarter taking 70 days or less, 10 days faster than the median DOM in Q3-2011.

Sales Price Activity & Decreasing Inventory of Homes for Sale

Pending sales of 547 are the highest of this quarter since 2006 (569). Q3 pending sales also rose 27.5% over last quarter.
“Overlaying closed sales and average sale price with new pending sales is a useful comparison between forward leading
indicators and past activity, and when both the actual and forecasted sales are trending upward along with sales price, it
is an indicator of future demand,” says Brad Conner, CAAR 2012 President. Conner explains, “a layered approach to
forecasting demand, as opposed to relying solely on the rise and fall in listing inventory, accounts for other mitigating
circumstances which can impact sales.”
New Listing inventory is down in the majority of the
                                                                   market area, most notably in Albemarle and
                                                                   Charlottesville, with upticks in the counties of Greene,
                                                                   Louisa and Nelson. The drop in new listings is apparent
                                                                   also in the foreclosure and short sale categories, with
                                                                   foreclosures dropping from 11.5% of new listings in
                                                                   Q3- 2011 to 5.8% in Q3. There are noticeably fewer
                                                                   short sales listings coming on market, with a drop from
                                                                   6.2% to 3.6% year-over-year.

                                                                    The 2,101 homes for sale to end the quarter represent
                                                                    18.9% fewer active listings than at this time last year
                                                                    and a decrease of 8.3% over Q2-2012. Of active
                                                                    listings, 132 are foreclosures or short sales, the same
                                                                    number as were active at the end of Q2-2012, but
35.6% less than the 205 active distressed listings at this time last year. “With distressed properties accounting for just
6.3% of the active market, down from the 7.9% share at this time last year, we are pleased with this positive trend,” says
CAAR 2012 President-Elect Denise Ramey. The 60 active foreclosure listings at the end of Q3 represent a 40.6% decrease
from this time last year and the 72 active short sales are 32.1% less than the 106 at the end of Q3-2011.


Home Prices

The average sales price of $313,445 in the 3rd Quarter was up a slight 1.4% over Q2-2012 and an impressive 6.8% from
the same period one year ago. The sales price increases in this quarter are attributed to an increase of 3.2% in Q3 in
detached home prices (+$10,806) over last quarter. This gain is tempered by a decrease in the attached sales price by
1.3% (-$2,791).

“The continued strength in pace of sales and stable median sales prices are positive indicators,” reports CAAR 2012
President Brad Conner. “There is a balance in the sales, supported by our analysis of purchase financing with 25% cash,
44% conventional and 31% FHA, VA and other sources funding this quarter’s sales.”
Nelson, Albemarle, and Greene counties all posted positive gains in average sales price, with Nelson also leading in
median sales price gain of 25% (+$50,000) since last quarter, and nearly matching the impressive gain year over year from
$201,500 (+24.1%) in Q3-2011. Albemarle is credited with the area’s highest median sales price of $284,900 which is
unchanged from the same period last year and down 5% from last quarter at $299,900. Greene rounded out the counties
with year-over-year gains in both average and median sales price, with an average sales price of $266,678, up 15.7% from
Q2-2012 and 9.3% from Q3-2011. City of Charlottesville (-2.7%), Fluvanna (-15.3%) and Louisa (-5.4%) all experienced
year-over-year declines in the median sale price for the 3rd Quarter, however, Louisa’s median price of $175,000 is a
13.6% gain over Q2-2012 median of $154,000.
Analysis of Charlottesville Short Sale and Foreclosures

Of active listings, 132 are foreclosures or short sales, the same number as were active at the end of Q2-2012, but 35.6%
less than the 205 active distressed listings at this time last year. “Distressed properties accounted for just 6.3% of the
active market, down from the 7.9% share at this time last year. We are pleased with the downward trend in new listings
of distressed properties as indicated by Q3 ending numbers,” says CAAR 2012 President-Elect Denise Ramey.

Only 78 of the 675 sales in the 3rd Quarter, or 11.6%, were foreclosures. This represents 19 more foreclosure sales versus
Q3-2011, when foreclosures accounted for 10.7% of sales. The number of short sales increased slightly in the 3rd
Quarter, with 31 short sales making up 4.6% of all sales.
Breakdown of Average Sales Price of Detached and Attached Units in Greater Charlottesville

The breakdown detached and attached homes sold are also strong. Q3 sales of detached homes in the area were up 25%
(+102) from 408 in Q3-2011 to 510. There were 165 attached homes (condos and townhouses) sold, representing a 16.2%
increase over the 142 attached homes sold in Q3-2011. Attached properties sold in Q3 also outpaced Q2 sales by 2.5%.

Detached homes saw year-over-year pricing gains with the $347,406 average sale price representing a 6.4% increase over
Q3-2011. The corresponding detached median sales price of $266,625 is a 1.3% decline from $270,000 in Q3-2011. With a
median sale price of $180,000, attached home prices declined both on a quarter-over-quarter (-4.8%) and year-over-year
(-3.7%) basis.


If you plan to sell a home in 2012, be sure to have a REALTOR® prepare a comparative market analysis (CMA) so that you
can price it to sell. And, if you are looking to buy, a REALTOR® can help you understand the current market and evaluate
your options.


This 2012 3rd Quarter Market Report is produced by the Charlottesville Area Association of REALTORS® using data from
the CAAR MLS. For more information on this report or the real estate market, pick up a copy of the CAAR Real Estate
Weekly, visit www.caar.com, or contact your REALTOR®.

Weitere ähnliche Inhalte

Empfohlen

2024 State of Marketing Report – by Hubspot
2024 State of Marketing Report – by Hubspot2024 State of Marketing Report – by Hubspot
2024 State of Marketing Report – by HubspotMarius Sescu
 
Everything You Need To Know About ChatGPT
Everything You Need To Know About ChatGPTEverything You Need To Know About ChatGPT
Everything You Need To Know About ChatGPTExpeed Software
 
Product Design Trends in 2024 | Teenage Engineerings
Product Design Trends in 2024 | Teenage EngineeringsProduct Design Trends in 2024 | Teenage Engineerings
Product Design Trends in 2024 | Teenage EngineeringsPixeldarts
 
How Race, Age and Gender Shape Attitudes Towards Mental Health
How Race, Age and Gender Shape Attitudes Towards Mental HealthHow Race, Age and Gender Shape Attitudes Towards Mental Health
How Race, Age and Gender Shape Attitudes Towards Mental HealthThinkNow
 
AI Trends in Creative Operations 2024 by Artwork Flow.pdf
AI Trends in Creative Operations 2024 by Artwork Flow.pdfAI Trends in Creative Operations 2024 by Artwork Flow.pdf
AI Trends in Creative Operations 2024 by Artwork Flow.pdfmarketingartwork
 
PEPSICO Presentation to CAGNY Conference Feb 2024
PEPSICO Presentation to CAGNY Conference Feb 2024PEPSICO Presentation to CAGNY Conference Feb 2024
PEPSICO Presentation to CAGNY Conference Feb 2024Neil Kimberley
 
Content Methodology: A Best Practices Report (Webinar)
Content Methodology: A Best Practices Report (Webinar)Content Methodology: A Best Practices Report (Webinar)
Content Methodology: A Best Practices Report (Webinar)contently
 
How to Prepare For a Successful Job Search for 2024
How to Prepare For a Successful Job Search for 2024How to Prepare For a Successful Job Search for 2024
How to Prepare For a Successful Job Search for 2024Albert Qian
 
Social Media Marketing Trends 2024 // The Global Indie Insights
Social Media Marketing Trends 2024 // The Global Indie InsightsSocial Media Marketing Trends 2024 // The Global Indie Insights
Social Media Marketing Trends 2024 // The Global Indie InsightsKurio // The Social Media Age(ncy)
 
Trends In Paid Search: Navigating The Digital Landscape In 2024
Trends In Paid Search: Navigating The Digital Landscape In 2024Trends In Paid Search: Navigating The Digital Landscape In 2024
Trends In Paid Search: Navigating The Digital Landscape In 2024Search Engine Journal
 
5 Public speaking tips from TED - Visualized summary
5 Public speaking tips from TED - Visualized summary5 Public speaking tips from TED - Visualized summary
5 Public speaking tips from TED - Visualized summarySpeakerHub
 
ChatGPT and the Future of Work - Clark Boyd
ChatGPT and the Future of Work - Clark Boyd ChatGPT and the Future of Work - Clark Boyd
ChatGPT and the Future of Work - Clark Boyd Clark Boyd
 
Getting into the tech field. what next
Getting into the tech field. what next Getting into the tech field. what next
Getting into the tech field. what next Tessa Mero
 
Google's Just Not That Into You: Understanding Core Updates & Search Intent
Google's Just Not That Into You: Understanding Core Updates & Search IntentGoogle's Just Not That Into You: Understanding Core Updates & Search Intent
Google's Just Not That Into You: Understanding Core Updates & Search IntentLily Ray
 
Time Management & Productivity - Best Practices
Time Management & Productivity -  Best PracticesTime Management & Productivity -  Best Practices
Time Management & Productivity - Best PracticesVit Horky
 
The six step guide to practical project management
The six step guide to practical project managementThe six step guide to practical project management
The six step guide to practical project managementMindGenius
 
Beginners Guide to TikTok for Search - Rachel Pearson - We are Tilt __ Bright...
Beginners Guide to TikTok for Search - Rachel Pearson - We are Tilt __ Bright...Beginners Guide to TikTok for Search - Rachel Pearson - We are Tilt __ Bright...
Beginners Guide to TikTok for Search - Rachel Pearson - We are Tilt __ Bright...RachelPearson36
 

Empfohlen (20)

2024 State of Marketing Report – by Hubspot
2024 State of Marketing Report – by Hubspot2024 State of Marketing Report – by Hubspot
2024 State of Marketing Report – by Hubspot
 
Everything You Need To Know About ChatGPT
Everything You Need To Know About ChatGPTEverything You Need To Know About ChatGPT
Everything You Need To Know About ChatGPT
 
Product Design Trends in 2024 | Teenage Engineerings
Product Design Trends in 2024 | Teenage EngineeringsProduct Design Trends in 2024 | Teenage Engineerings
Product Design Trends in 2024 | Teenage Engineerings
 
How Race, Age and Gender Shape Attitudes Towards Mental Health
How Race, Age and Gender Shape Attitudes Towards Mental HealthHow Race, Age and Gender Shape Attitudes Towards Mental Health
How Race, Age and Gender Shape Attitudes Towards Mental Health
 
AI Trends in Creative Operations 2024 by Artwork Flow.pdf
AI Trends in Creative Operations 2024 by Artwork Flow.pdfAI Trends in Creative Operations 2024 by Artwork Flow.pdf
AI Trends in Creative Operations 2024 by Artwork Flow.pdf
 
Skeleton Culture Code
Skeleton Culture CodeSkeleton Culture Code
Skeleton Culture Code
 
PEPSICO Presentation to CAGNY Conference Feb 2024
PEPSICO Presentation to CAGNY Conference Feb 2024PEPSICO Presentation to CAGNY Conference Feb 2024
PEPSICO Presentation to CAGNY Conference Feb 2024
 
Content Methodology: A Best Practices Report (Webinar)
Content Methodology: A Best Practices Report (Webinar)Content Methodology: A Best Practices Report (Webinar)
Content Methodology: A Best Practices Report (Webinar)
 
How to Prepare For a Successful Job Search for 2024
How to Prepare For a Successful Job Search for 2024How to Prepare For a Successful Job Search for 2024
How to Prepare For a Successful Job Search for 2024
 
Social Media Marketing Trends 2024 // The Global Indie Insights
Social Media Marketing Trends 2024 // The Global Indie InsightsSocial Media Marketing Trends 2024 // The Global Indie Insights
Social Media Marketing Trends 2024 // The Global Indie Insights
 
Trends In Paid Search: Navigating The Digital Landscape In 2024
Trends In Paid Search: Navigating The Digital Landscape In 2024Trends In Paid Search: Navigating The Digital Landscape In 2024
Trends In Paid Search: Navigating The Digital Landscape In 2024
 
5 Public speaking tips from TED - Visualized summary
5 Public speaking tips from TED - Visualized summary5 Public speaking tips from TED - Visualized summary
5 Public speaking tips from TED - Visualized summary
 
ChatGPT and the Future of Work - Clark Boyd
ChatGPT and the Future of Work - Clark Boyd ChatGPT and the Future of Work - Clark Boyd
ChatGPT and the Future of Work - Clark Boyd
 
Getting into the tech field. what next
Getting into the tech field. what next Getting into the tech field. what next
Getting into the tech field. what next
 
Google's Just Not That Into You: Understanding Core Updates & Search Intent
Google's Just Not That Into You: Understanding Core Updates & Search IntentGoogle's Just Not That Into You: Understanding Core Updates & Search Intent
Google's Just Not That Into You: Understanding Core Updates & Search Intent
 
How to have difficult conversations
How to have difficult conversations How to have difficult conversations
How to have difficult conversations
 
Introduction to Data Science
Introduction to Data ScienceIntroduction to Data Science
Introduction to Data Science
 
Time Management & Productivity - Best Practices
Time Management & Productivity -  Best PracticesTime Management & Productivity -  Best Practices
Time Management & Productivity - Best Practices
 
The six step guide to practical project management
The six step guide to practical project managementThe six step guide to practical project management
The six step guide to practical project management
 
Beginners Guide to TikTok for Search - Rachel Pearson - We are Tilt __ Bright...
Beginners Guide to TikTok for Search - Rachel Pearson - We are Tilt __ Bright...Beginners Guide to TikTok for Search - Rachel Pearson - We are Tilt __ Bright...
Beginners Guide to TikTok for Search - Rachel Pearson - We are Tilt __ Bright...
 

Caar 3 q2012-member expanded edition_final

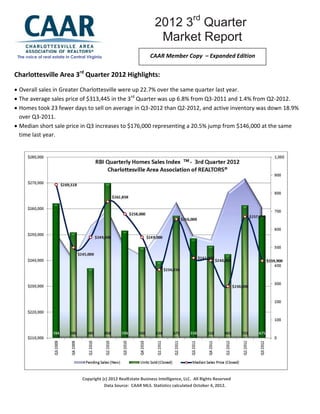
  • 1. 2012 3rd Quarter Market Report The voice of real estate in Central Virginia CAAR Member Copy – Expanded Edition Charlottesville Area 3rd Quarter 2012 Highlights: 2011 Year End Market Report Market  Overall sales in Greater Charlottesville were up 22.7% over the same quarter last year. ReportReport  The average sales price of $313,445 in the 3rd Quarter was up 6.8% from Q3-2011 and 1.4% from Q2-2012.  Homes took 23 fewer days to sell on average in Q3-2012 than Q2-2012, and active inventory was down 18.9% over Q3-2011.  Median short sale price in Q3 increases to $176,000 representing a 20.5% jump from $146,000 at the same time last year. Copyright (c) 2012 RealEstate Business Intelligence, LLC. All Rights Reserved Data Source: CAAR MLS. Statistics calculated October 4, 2012.
  • 2. 3rd Quarter 2012 Sales & Contract Activity There were 675 homes sold in the Charlottesville area in the third quarter, which was up 22.7% (+125 sales) from the third quarter last year and the highest Q3 sales pace since 2009. Total units sold in this quarter are strong as compared over the same time in 2010 and 2011, with 593 and 550 units sold in the same period. Albemarle County (+28%) had the largest year-over-year increased (+72) sales at 329 during the quarter, while Fluvanna (+37.1%) picked up 23 more sales to record 85, and Charlottesville (+12.4%), Greene (+4.2%), and Nelson (+73.1% or 19 sales) also showed annual gains for the quarter. Only Louisa County (-11.4%) experienced a decline in sales volume from Q3-2011 levels. Copyright (c) 2012 RealEstate Business Intelligence, LLC. All Rights Reserved Data Source: CAAR MLS. Statistics calculated October 4, 2012. Days on Market (DOM) Homes took 23 fewer days to sell on average in Q3-2012 than Q2-2012, down in average days on market (DOM) to 127 from 150 days in last quarter. Homes sold fastest on average in Louisa (101 days), Charlottesville (103 days) and Albemarle (112 days). Greene (170 days), Fluvanna (143 days) and Nelson (256 days) each had a higher average DOM than the region at large. For the Greater Charlottesville region, attached homes continue to sell faster on average than detached homes. The average DOM of 108 for attached homes was down 23 days (-17.6%) over the Q3-2011 level, and dropped by 20.6% over the average DOM of 136 last quarter. The average DOM of 134 days for detached homes is a noticeable drop of 13% over the last quarter, selling in 20 fewer days. There was 16.7% year-over-year improvement in the median DOM for Greater Charlottesville, with half the homes sold in the 3rd Quarter taking 70 days or less, 10 days faster than the median DOM in Q3-2011. Sales Price Activity & Decreasing Inventory of Homes for Sale Pending sales of 547 are the highest of this quarter since 2006 (569). Q3 pending sales also rose 27.5% over last quarter. “Overlaying closed sales and average sale price with new pending sales is a useful comparison between forward leading indicators and past activity, and when both the actual and forecasted sales are trending upward along with sales price, it is an indicator of future demand,” says Brad Conner, CAAR 2012 President. Conner explains, “a layered approach to forecasting demand, as opposed to relying solely on the rise and fall in listing inventory, accounts for other mitigating circumstances which can impact sales.”
  • 3. New Listing inventory is down in the majority of the market area, most notably in Albemarle and Charlottesville, with upticks in the counties of Greene, Louisa and Nelson. The drop in new listings is apparent also in the foreclosure and short sale categories, with foreclosures dropping from 11.5% of new listings in Q3- 2011 to 5.8% in Q3. There are noticeably fewer short sales listings coming on market, with a drop from 6.2% to 3.6% year-over-year. The 2,101 homes for sale to end the quarter represent 18.9% fewer active listings than at this time last year and a decrease of 8.3% over Q2-2012. Of active listings, 132 are foreclosures or short sales, the same number as were active at the end of Q2-2012, but 35.6% less than the 205 active distressed listings at this time last year. “With distressed properties accounting for just 6.3% of the active market, down from the 7.9% share at this time last year, we are pleased with this positive trend,” says CAAR 2012 President-Elect Denise Ramey. The 60 active foreclosure listings at the end of Q3 represent a 40.6% decrease from this time last year and the 72 active short sales are 32.1% less than the 106 at the end of Q3-2011. Home Prices The average sales price of $313,445 in the 3rd Quarter was up a slight 1.4% over Q2-2012 and an impressive 6.8% from the same period one year ago. The sales price increases in this quarter are attributed to an increase of 3.2% in Q3 in detached home prices (+$10,806) over last quarter. This gain is tempered by a decrease in the attached sales price by 1.3% (-$2,791). “The continued strength in pace of sales and stable median sales prices are positive indicators,” reports CAAR 2012 President Brad Conner. “There is a balance in the sales, supported by our analysis of purchase financing with 25% cash, 44% conventional and 31% FHA, VA and other sources funding this quarter’s sales.”
  • 4. Nelson, Albemarle, and Greene counties all posted positive gains in average sales price, with Nelson also leading in median sales price gain of 25% (+$50,000) since last quarter, and nearly matching the impressive gain year over year from $201,500 (+24.1%) in Q3-2011. Albemarle is credited with the area’s highest median sales price of $284,900 which is unchanged from the same period last year and down 5% from last quarter at $299,900. Greene rounded out the counties with year-over-year gains in both average and median sales price, with an average sales price of $266,678, up 15.7% from Q2-2012 and 9.3% from Q3-2011. City of Charlottesville (-2.7%), Fluvanna (-15.3%) and Louisa (-5.4%) all experienced year-over-year declines in the median sale price for the 3rd Quarter, however, Louisa’s median price of $175,000 is a 13.6% gain over Q2-2012 median of $154,000.
  • 5.
  • 6. Analysis of Charlottesville Short Sale and Foreclosures Of active listings, 132 are foreclosures or short sales, the same number as were active at the end of Q2-2012, but 35.6% less than the 205 active distressed listings at this time last year. “Distressed properties accounted for just 6.3% of the active market, down from the 7.9% share at this time last year. We are pleased with the downward trend in new listings of distressed properties as indicated by Q3 ending numbers,” says CAAR 2012 President-Elect Denise Ramey. Only 78 of the 675 sales in the 3rd Quarter, or 11.6%, were foreclosures. This represents 19 more foreclosure sales versus Q3-2011, when foreclosures accounted for 10.7% of sales. The number of short sales increased slightly in the 3rd Quarter, with 31 short sales making up 4.6% of all sales.
  • 7. Breakdown of Average Sales Price of Detached and Attached Units in Greater Charlottesville The breakdown detached and attached homes sold are also strong. Q3 sales of detached homes in the area were up 25% (+102) from 408 in Q3-2011 to 510. There were 165 attached homes (condos and townhouses) sold, representing a 16.2% increase over the 142 attached homes sold in Q3-2011. Attached properties sold in Q3 also outpaced Q2 sales by 2.5%. Detached homes saw year-over-year pricing gains with the $347,406 average sale price representing a 6.4% increase over Q3-2011. The corresponding detached median sales price of $266,625 is a 1.3% decline from $270,000 in Q3-2011. With a median sale price of $180,000, attached home prices declined both on a quarter-over-quarter (-4.8%) and year-over-year (-3.7%) basis. If you plan to sell a home in 2012, be sure to have a REALTOR® prepare a comparative market analysis (CMA) so that you can price it to sell. And, if you are looking to buy, a REALTOR® can help you understand the current market and evaluate your options. This 2012 3rd Quarter Market Report is produced by the Charlottesville Area Association of REALTORS® using data from the CAAR MLS. For more information on this report or the real estate market, pick up a copy of the CAAR Real Estate Weekly, visit www.caar.com, or contact your REALTOR®.