SlideShare ist ein Scribd-Unternehmen logo
1 von 13
Downloaden Sie, um offline zu lesen
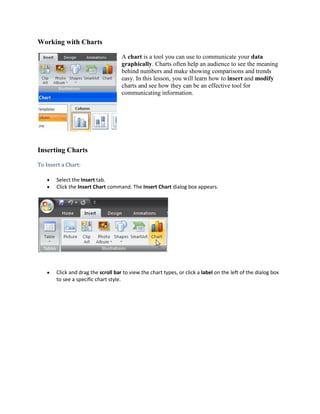
Working with Charts<br />19050-2510A chart is a tool you can use to communicate your data graphically. Charts often help an audience to see the meaning behind numbers and make showing comparisons and trends easy. In this lesson, you will learn how to insert and modify charts and see how they can be an effective tool for communicating information. <br />Inserting Charts<br />To Insert a Chart:<br />Select the Insert tab.<br />Click the Insert Chart command. The Insert Chart dialog box appears. <br />Click and drag the scroll bar to view the chart types, or click a label on the left of the dialog box to see a specific chart style.<br />Click a chart to select it.<br />Click OK. Excel will open. Usually, Excel will appear on one side of the screen, while PowerPoint appears on the other side of the screen. <br />If a slide layout has a content placeholder, click the Insert Chart command to insert a new chart.<br />Enter Chart Data<br />The data that appears in the Excel spreadsheet is placeholder source data that you will replace with your own information. The Excel source data is used to create the PowerPoint chart. <br />To Enter Chart Data:<br />Select a cell in the Excel spreadsheet.<br />Enter your data in the cell. If the cell contains placeholder data, the placeholder data will disappear. As you enter your data, it will appear in the Excel spreadsheet and the PowerPoint chart.<br />Move to another cell.<br />Repeat the above steps until all your data is entered.<br />Click and drag the lower-right corner of the blue line to increase or decrease the data range for columns. The data enclosed by the blue lines will appear in the chart.<br />Click and drag the lower-right corner of the blue line to increase or decrease the data range for rows. <br />Select any cells with placeholder data remaining. In the example, the column with Series 3 data was not needed.<br />Press the Delete key to delete the remaining placeholder data.<br />Close Excel. You do not need to save the spreadsheet. The new Excel source data appears in the PowerPoint chart.<br />Formatting Charts<br />When you insert a chart, three new tabs will appear on the Ribbon. The three tabs -- Design, Layout, and Format -- contain various chart tools and commands that allow you to modify and format the chart.<br />To Change the Chart Type:<br />Select the chart.<br />Select the Design tab.<br />Click the Change Chart Type command. The Insert Chart dialog box will appear.<br />Select the chart you would like. <br />Click OK. The chart will change on the slide to the new chart type.<br />To Edit Source Data:<br />Select the chart.<br />Select the Design tab.<br />Click the Edit Data command. An Excel spreadsheet with the current source data will appear.<br />Edit the data in the spreadsheet. The changes will appear on the slide.<br />Close Excel without saving the spreadsheet.<br />To Change the Chart Style:<br />Select the chart.<br />Select the Design tab.<br />Scroll through the options in the Chart Style group, or click the More drop-down arrow to see all the chart style options.<br />Click a chart style to select it. The chart style will change on the slide.<br />Identifying the Parts of a Chart<br />Have you ever read something you didn't fully understand, but when you saw a chart or graph, the concept became clear and understandable? Charts are a visual representation of data. Charts make it easy to see comparisons, patterns, and trends in the data.<br />Source Data<br />The range of cells that make up a chart. The chart is updated automatically whenever the information in these cells change.<br />Title<br />The title of the chart.<br />Legend<br />The chart key, which identifies what each color on the chart represents.<br />Axis<br />The vertical and horizontal parts of a chart. The vertical axis is often referred to as the Y axis, and the horizontal axis is referred to as the X axis.<br />Modifying the Chart Layout<br />To Change the Chart Layout:<br />Select the chart.<br />Select the Design tab.<br />Scroll through the options in the Chart Layout group, or click the More drop-down arrow to see all the chart layout options.<br />Click a chart layout to select it. The chart layout will change on the slide.<br />The chart layout determines how specific chart information will appear. For example, some layouts include chart titles, legends, and axis labels. <br />To Modify Specific Areas of the Chart Layout:<br />Select the chart.<br />Select the Layout tab.<br />Locate the Labels group.<br />Chart Titles: Click this command to remove or add a chart title. <br />Axis Titles: Click this command and choose to hide or display the horizontal, or x axis, label; hide or display the vertical, or y axis, labels; and change the direction of the axis labels to horizontal or vertical.<br />Legend: Click this command to select a location for the legend to appear, or choose to not display a legend.<br />Data Labels: Click this command to display or hide data values next to each chart element.<br />Other Important Commands on the Layout Tab<br />In the Axes group, there are several commands that control both axes and whether the gridlines are visible. In the Background group, there are several commands that control the visual aspects of the chart. Some commands in the Analysis group will appear active only if the selected chart is a line, area, or bubble chart. <br />Additional Chart Formatting<br />Use the commands on the Format tab to modify the chart in additional ways. For example, from this tab you can change the chart outline, format chart text as WordArt, and more. <br />Challenge!<br />Use the Company Overview presentation or any other PowerPoint presentation you choose to complete this challenge.<br />Open a presentation.<br />Insert a bar chart.<br />Change the chart to a line chart.<br />Change the chart layout.<br />Apply a different chart style.<br />Add axis labels if they are not included on the layout you chose.<br />
Lesson11 working with charts

Weitere ähnliche Inhalte

Was ist angesagt?

Module 6 component of excel chart
Module 6 component of excel chartModule 6 component of excel chart
Module 6 component of excel chartDr. Shalini Pandey
 
How to Insert a Graph into Microsoft Excel 2007
How to Insert a Graph into Microsoft Excel 2007How to Insert a Graph into Microsoft Excel 2007
How to Insert a Graph into Microsoft Excel 2007nfasano
 
Creating a graph in excel
Creating a graph in excelCreating a graph in excel
Creating a graph in excelorthms
 
Lesson 16 Working With Charts
Lesson 16   Working With ChartsLesson 16   Working With Charts
Lesson 16 Working With Chartsguevarra_2000
 
Excel Crash Course: Pivot Tables
Excel Crash Course: Pivot TablesExcel Crash Course: Pivot Tables
Excel Crash Course: Pivot TablesBobby Jones
 
Lesson 18 Creating Pivot Tables
Lesson 18 Creating Pivot TablesLesson 18 Creating Pivot Tables
Lesson 18 Creating Pivot Tablesguevarra_2000
 
MS Excel Pivot Table Reports & Charts
MS Excel Pivot Table Reports & ChartsMS Excel Pivot Table Reports & Charts
MS Excel Pivot Table Reports & Chartsdnbakhan
 
Charts in EXCEL
Charts in EXCELCharts in EXCEL
Charts in EXCELpkottke
 
Computer skills excel2010 5
Computer skills excel2010 5Computer skills excel2010 5
Computer skills excel2010 5zahraa F.Muhsen
 
Pivot Table & Chart_Parakramesh Jaroli_Pacific University
Pivot Table & Chart_Parakramesh Jaroli_Pacific UniversityPivot Table & Chart_Parakramesh Jaroli_Pacific University
Pivot Table & Chart_Parakramesh Jaroli_Pacific UniversityParakramesh Jaroli
 
4 4 making changes to graphs
4 4 making changes to graphs4 4 making changes to graphs
4 4 making changes to graphsQondileRamokgadi
 
Lesson 10 working with charts
Lesson 10   working with chartsLesson 10   working with charts
Lesson 10 working with chartsguevarra_2000
 

Was ist angesagt? (20)

Module 6 component of excel chart
Module 6 component of excel chartModule 6 component of excel chart
Module 6 component of excel chart
 
How to Insert a Graph into Microsoft Excel 2007
How to Insert a Graph into Microsoft Excel 2007How to Insert a Graph into Microsoft Excel 2007
How to Insert a Graph into Microsoft Excel 2007
 
Creating a graph in excel
Creating a graph in excelCreating a graph in excel
Creating a graph in excel
 
MS Excel - Charts
MS Excel - ChartsMS Excel - Charts
MS Excel - Charts
 
Lesson 16 Working With Charts
Lesson 16   Working With ChartsLesson 16   Working With Charts
Lesson 16 Working With Charts
 
excel charts
excel chartsexcel charts
excel charts
 
Charts and pivot tables
Charts and pivot tablesCharts and pivot tables
Charts and pivot tables
 
Excel Crash Course: Pivot Tables
Excel Crash Course: Pivot TablesExcel Crash Course: Pivot Tables
Excel Crash Course: Pivot Tables
 
Pivot Tables
Pivot TablesPivot Tables
Pivot Tables
 
Pivot Tables
Pivot TablesPivot Tables
Pivot Tables
 
Lesson 18 Creating Pivot Tables
Lesson 18 Creating Pivot TablesLesson 18 Creating Pivot Tables
Lesson 18 Creating Pivot Tables
 
Excel Pivot Tables
Excel Pivot TablesExcel Pivot Tables
Excel Pivot Tables
 
MS Excel Pivot Table Reports & Charts
MS Excel Pivot Table Reports & ChartsMS Excel Pivot Table Reports & Charts
MS Excel Pivot Table Reports & Charts
 
Charts in EXCEL
Charts in EXCELCharts in EXCEL
Charts in EXCEL
 
Spreadsheets 2
Spreadsheets 2Spreadsheets 2
Spreadsheets 2
 
Computer skills excel2010 5
Computer skills excel2010 5Computer skills excel2010 5
Computer skills excel2010 5
 
Pivot table
Pivot tablePivot table
Pivot table
 
Pivot Table & Chart_Parakramesh Jaroli_Pacific University
Pivot Table & Chart_Parakramesh Jaroli_Pacific UniversityPivot Table & Chart_Parakramesh Jaroli_Pacific University
Pivot Table & Chart_Parakramesh Jaroli_Pacific University
 
4 4 making changes to graphs
4 4 making changes to graphs4 4 making changes to graphs
4 4 making changes to graphs
 
Lesson 10 working with charts
Lesson 10   working with chartsLesson 10   working with charts
Lesson 10 working with charts
 

Andere mochten auch

Word Lesson11 working with shapes
Word Lesson11 working with shapesWord Lesson11 working with shapes
Word Lesson11 working with shapesricsanmae
 
Society of Camera Operators to Make a Documentary Film and Two PSA About The ...
Society of Camera Operators to Make a Documentary Film and Two PSA About The ...Society of Camera Operators to Make a Documentary Film and Two PSA About The ...
Society of Camera Operators to Make a Documentary Film and Two PSA About The ...filmcastlive
 
Word Lesson10 inserting clip art
Word Lesson10 inserting clip artWord Lesson10 inserting clip art
Word Lesson10 inserting clip artricsanmae
 
Transcendentalism
TranscendentalismTranscendentalism
TranscendentalismOmar Graham
 
GARDEN PRINT DESIGNS
GARDEN PRINT DESIGNSGARDEN PRINT DESIGNS
GARDEN PRINT DESIGNSmeringolo
 
XSS filter on Server side
XSS filter on Server sideXSS filter on Server side
XSS filter on Server sidecuteboysmith
 

Andere mochten auch (6)

Word Lesson11 working with shapes
Word Lesson11 working with shapesWord Lesson11 working with shapes
Word Lesson11 working with shapes
 
Society of Camera Operators to Make a Documentary Film and Two PSA About The ...
Society of Camera Operators to Make a Documentary Film and Two PSA About The ...Society of Camera Operators to Make a Documentary Film and Two PSA About The ...
Society of Camera Operators to Make a Documentary Film and Two PSA About The ...
 
Word Lesson10 inserting clip art
Word Lesson10 inserting clip artWord Lesson10 inserting clip art
Word Lesson10 inserting clip art
 
Transcendentalism
TranscendentalismTranscendentalism
Transcendentalism
 
GARDEN PRINT DESIGNS
GARDEN PRINT DESIGNSGARDEN PRINT DESIGNS
GARDEN PRINT DESIGNS
 
XSS filter on Server side
XSS filter on Server sideXSS filter on Server side
XSS filter on Server side
 

Ähnlich wie Lesson11 working with charts

Excel Graphs Charts
Excel Graphs ChartsExcel Graphs Charts
Excel Graphs Chartssimply_coool
 
Basics of Creating Graphs / Charts using Microsoft Excel
Basics of Creating Graphs / Charts using Microsoft ExcelBasics of Creating Graphs / Charts using Microsoft Excel
Basics of Creating Graphs / Charts using Microsoft ExcelTope Osanyintuyi
 
Introduction to Excel
Introduction to ExcelIntroduction to Excel
Introduction to ExcelNajma Alam
 
03 microsoft office (creating charts)
03 microsoft office (creating charts)03 microsoft office (creating charts)
03 microsoft office (creating charts)benchhood
 
excel charts and graphs.ppt
excel charts and graphs.pptexcel charts and graphs.ppt
excel charts and graphs.pptChemOyasan1
 
Excel 2003 tutorial 2
Excel 2003 tutorial 2Excel 2003 tutorial 2
Excel 2003 tutorial 2catacata1976
 
Linking chart from excel with power point
Linking chart from excel with power pointLinking chart from excel with power point
Linking chart from excel with power pointSAMUEL BARNABAS IFITUMI
 
Excel 2007 create a chart
Excel 2007    create a chartExcel 2007    create a chart
Excel 2007 create a chartrezaulslide
 
Excel 2007 create a chart
Excel 2007    create a chartExcel 2007    create a chart
Excel 2007 create a chartkhankamrul
 
Exp2003 exl ppt_03
Exp2003 exl ppt_03Exp2003 exl ppt_03
Exp2003 exl ppt_03lonetree
 
Creating charts and graphics
Creating charts and graphicsCreating charts and graphics
Creating charts and graphicsum5ashm
 

Ähnlich wie Lesson11 working with charts (20)

MS Excel 2010 tutorial 6
MS Excel 2010 tutorial 6MS Excel 2010 tutorial 6
MS Excel 2010 tutorial 6
 
Excel Graphs Charts
Excel Graphs ChartsExcel Graphs Charts
Excel Graphs Charts
 
Computer midterms
Computer midtermsComputer midterms
Computer midterms
 
Basics of Creating Graphs / Charts using Microsoft Excel
Basics of Creating Graphs / Charts using Microsoft ExcelBasics of Creating Graphs / Charts using Microsoft Excel
Basics of Creating Graphs / Charts using Microsoft Excel
 
Microsoft Excel Tutorial
Microsoft Excel TutorialMicrosoft Excel Tutorial
Microsoft Excel Tutorial
 
Introduction to Excel
Introduction to ExcelIntroduction to Excel
Introduction to Excel
 
excell.pdf
excell.pdfexcell.pdf
excell.pdf
 
03 microsoft office (creating charts)
03 microsoft office (creating charts)03 microsoft office (creating charts)
03 microsoft office (creating charts)
 
Advanced excel
Advanced excelAdvanced excel
Advanced excel
 
Excel 2007 - Create a chart
Excel 2007 - Create a chartExcel 2007 - Create a chart
Excel 2007 - Create a chart
 
excel charts and graphs.ppt
excel charts and graphs.pptexcel charts and graphs.ppt
excel charts and graphs.ppt
 
excel.ppt
excel.pptexcel.ppt
excel.ppt
 
Excel 2003 tutorial 2
Excel 2003 tutorial 2Excel 2003 tutorial 2
Excel 2003 tutorial 2
 
ms_excel.pdf
ms_excel.pdfms_excel.pdf
ms_excel.pdf
 
Linking chart from excel with power point
Linking chart from excel with power pointLinking chart from excel with power point
Linking chart from excel with power point
 
Excel 2007 create a chart
Excel 2007    create a chartExcel 2007    create a chart
Excel 2007 create a chart
 
Excel 2007 create a chart
Excel 2007    create a chartExcel 2007    create a chart
Excel 2007 create a chart
 
Exp2003 exl ppt_03
Exp2003 exl ppt_03Exp2003 exl ppt_03
Exp2003 exl ppt_03
 
Creating charts and graphics
Creating charts and graphicsCreating charts and graphics
Creating charts and graphics
 
Excel training create a chart
Excel training create a chartExcel training create a chart
Excel training create a chart
 

Mehr von ricsanmae

Powerpoint Lesson10 working with tables
Powerpoint Lesson10 working with tablesPowerpoint Lesson10 working with tables
Powerpoint Lesson10 working with tablesricsanmae
 
Lesson9 working with basic functions
Lesson9 working with basic functionsLesson9 working with basic functions
Lesson9 working with basic functionsricsanmae
 
Lesson8 creating complex formulas
Lesson8 creating complex formulasLesson8 creating complex formulas
Lesson8 creating complex formulasricsanmae
 
CPUs, Form Factor And Sockets
CPUs, Form Factor And SocketsCPUs, Form Factor And Sockets
CPUs, Form Factor And Socketsricsanmae
 
Chapter 2: Inside the Computer
Chapter 2: Inside the ComputerChapter 2: Inside the Computer
Chapter 2: Inside the Computerricsanmae
 
Chapter 1: Intro to Funds of Programming
Chapter 1: Intro to Funds of ProgrammingChapter 1: Intro to Funds of Programming
Chapter 1: Intro to Funds of Programmingricsanmae
 
Troubleshooting And Maintenance Fundamentals
Troubleshooting And Maintenance FundamentalsTroubleshooting And Maintenance Fundamentals
Troubleshooting And Maintenance Fundamentalsricsanmae
 
Schools in the Future
Schools in the FutureSchools in the Future
Schools in the Futurericsanmae
 
Who Wants To Be A Millionaire
Who Wants To Be A MillionaireWho Wants To Be A Millionaire
Who Wants To Be A Millionairericsanmae
 

Mehr von ricsanmae (10)

Powerpoint Lesson10 working with tables
Powerpoint Lesson10 working with tablesPowerpoint Lesson10 working with tables
Powerpoint Lesson10 working with tables
 
Lesson9 working with basic functions
Lesson9 working with basic functionsLesson9 working with basic functions
Lesson9 working with basic functions
 
Lesson8 creating complex formulas
Lesson8 creating complex formulasLesson8 creating complex formulas
Lesson8 creating complex formulas
 
Routers
RoutersRouters
Routers
 
CPUs, Form Factor And Sockets
CPUs, Form Factor And SocketsCPUs, Form Factor And Sockets
CPUs, Form Factor And Sockets
 
Chapter 2: Inside the Computer
Chapter 2: Inside the ComputerChapter 2: Inside the Computer
Chapter 2: Inside the Computer
 
Chapter 1: Intro to Funds of Programming
Chapter 1: Intro to Funds of ProgrammingChapter 1: Intro to Funds of Programming
Chapter 1: Intro to Funds of Programming
 
Troubleshooting And Maintenance Fundamentals
Troubleshooting And Maintenance FundamentalsTroubleshooting And Maintenance Fundamentals
Troubleshooting And Maintenance Fundamentals
 
Schools in the Future
Schools in the FutureSchools in the Future
Schools in the Future
 
Who Wants To Be A Millionaire
Who Wants To Be A MillionaireWho Wants To Be A Millionaire
Who Wants To Be A Millionaire
 

Kürzlich hochgeladen

Integumentary System SMP B. Pharm Sem I.ppt
Integumentary System SMP B. Pharm Sem I.pptIntegumentary System SMP B. Pharm Sem I.ppt
Integumentary System SMP B. Pharm Sem I.pptshraddhaparab530
 
Team Lead Succeed – Helping you and your team achieve high-performance teamwo...
Team Lead Succeed – Helping you and your team achieve high-performance teamwo...Team Lead Succeed – Helping you and your team achieve high-performance teamwo...
Team Lead Succeed – Helping you and your team achieve high-performance teamwo...Association for Project Management
 
How to Uninstall a Module in Odoo 17 Using Command Line
How to Uninstall a Module in Odoo 17 Using Command LineHow to Uninstall a Module in Odoo 17 Using Command Line
How to Uninstall a Module in Odoo 17 Using Command LineCeline George
 
Q-Factor HISPOL Quiz-6th April 2024, Quiz Club NITW
Q-Factor HISPOL Quiz-6th April 2024, Quiz Club NITWQ-Factor HISPOL Quiz-6th April 2024, Quiz Club NITW
Q-Factor HISPOL Quiz-6th April 2024, Quiz Club NITWQuiz Club NITW
 
Scientific Writing :Research Discourse
Scientific  Writing :Research  DiscourseScientific  Writing :Research  Discourse
Scientific Writing :Research DiscourseAnita GoswamiGiri
 
BIOCHEMISTRY-CARBOHYDRATE METABOLISM CHAPTER 2.pptx
BIOCHEMISTRY-CARBOHYDRATE METABOLISM CHAPTER 2.pptxBIOCHEMISTRY-CARBOHYDRATE METABOLISM CHAPTER 2.pptx
BIOCHEMISTRY-CARBOHYDRATE METABOLISM CHAPTER 2.pptxSayali Powar
 
An Overview of the Calendar App in Odoo 17 ERP
An Overview of the Calendar App in Odoo 17 ERPAn Overview of the Calendar App in Odoo 17 ERP
An Overview of the Calendar App in Odoo 17 ERPCeline George
 
CLASSIFICATION OF ANTI - CANCER DRUGS.pptx
CLASSIFICATION OF ANTI - CANCER DRUGS.pptxCLASSIFICATION OF ANTI - CANCER DRUGS.pptx
CLASSIFICATION OF ANTI - CANCER DRUGS.pptxAnupam32727
 
MS4 level being good citizen -imperative- (1) (1).pdf
MS4 level   being good citizen -imperative- (1) (1).pdfMS4 level   being good citizen -imperative- (1) (1).pdf
MS4 level being good citizen -imperative- (1) (1).pdfMr Bounab Samir
 
Satirical Depths - A Study of Gabriel Okara's Poem - 'You Laughed and Laughed...
Satirical Depths - A Study of Gabriel Okara's Poem - 'You Laughed and Laughed...Satirical Depths - A Study of Gabriel Okara's Poem - 'You Laughed and Laughed...
Satirical Depths - A Study of Gabriel Okara's Poem - 'You Laughed and Laughed...HetalPathak10
 
ARTERIAL BLOOD GAS ANALYSIS........pptx
ARTERIAL BLOOD  GAS ANALYSIS........pptxARTERIAL BLOOD  GAS ANALYSIS........pptx
ARTERIAL BLOOD GAS ANALYSIS........pptxAneriPatwari
 
Indexing Structures in Database Management system.pdf
Indexing Structures in Database Management system.pdfIndexing Structures in Database Management system.pdf
Indexing Structures in Database Management system.pdfChristalin Nelson
 
Beauty Amidst the Bytes_ Unearthing Unexpected Advantages of the Digital Wast...
Beauty Amidst the Bytes_ Unearthing Unexpected Advantages of the Digital Wast...Beauty Amidst the Bytes_ Unearthing Unexpected Advantages of the Digital Wast...
Beauty Amidst the Bytes_ Unearthing Unexpected Advantages of the Digital Wast...DhatriParmar
 
Congestive Cardiac Failure..presentation
Congestive Cardiac Failure..presentationCongestive Cardiac Failure..presentation
Congestive Cardiac Failure..presentationdeepaannamalai16
 
Healthy Minds, Flourishing Lives: A Philosophical Approach to Mental Health a...
Healthy Minds, Flourishing Lives: A Philosophical Approach to Mental Health a...Healthy Minds, Flourishing Lives: A Philosophical Approach to Mental Health a...
Healthy Minds, Flourishing Lives: A Philosophical Approach to Mental Health a...Osopher
 
How to Make a Duplicate of Your Odoo 17 Database
How to Make a Duplicate of Your Odoo 17 DatabaseHow to Make a Duplicate of Your Odoo 17 Database
How to Make a Duplicate of Your Odoo 17 DatabaseCeline George
 
ClimART Action | eTwinning Project
ClimART Action    |    eTwinning ProjectClimART Action    |    eTwinning Project
ClimART Action | eTwinning Projectjordimapav
 

Kürzlich hochgeladen (20)

Integumentary System SMP B. Pharm Sem I.ppt
Integumentary System SMP B. Pharm Sem I.pptIntegumentary System SMP B. Pharm Sem I.ppt
Integumentary System SMP B. Pharm Sem I.ppt
 
Team Lead Succeed – Helping you and your team achieve high-performance teamwo...
Team Lead Succeed – Helping you and your team achieve high-performance teamwo...Team Lead Succeed – Helping you and your team achieve high-performance teamwo...
Team Lead Succeed – Helping you and your team achieve high-performance teamwo...
 
Paradigm shift in nursing research by RS MEHTA
Paradigm shift in nursing research by RS MEHTAParadigm shift in nursing research by RS MEHTA
Paradigm shift in nursing research by RS MEHTA
 
How to Uninstall a Module in Odoo 17 Using Command Line
How to Uninstall a Module in Odoo 17 Using Command LineHow to Uninstall a Module in Odoo 17 Using Command Line
How to Uninstall a Module in Odoo 17 Using Command Line
 
Q-Factor HISPOL Quiz-6th April 2024, Quiz Club NITW
Q-Factor HISPOL Quiz-6th April 2024, Quiz Club NITWQ-Factor HISPOL Quiz-6th April 2024, Quiz Club NITW
Q-Factor HISPOL Quiz-6th April 2024, Quiz Club NITW
 
Scientific Writing :Research Discourse
Scientific  Writing :Research  DiscourseScientific  Writing :Research  Discourse
Scientific Writing :Research Discourse
 
BIOCHEMISTRY-CARBOHYDRATE METABOLISM CHAPTER 2.pptx
BIOCHEMISTRY-CARBOHYDRATE METABOLISM CHAPTER 2.pptxBIOCHEMISTRY-CARBOHYDRATE METABOLISM CHAPTER 2.pptx
BIOCHEMISTRY-CARBOHYDRATE METABOLISM CHAPTER 2.pptx
 
An Overview of the Calendar App in Odoo 17 ERP
An Overview of the Calendar App in Odoo 17 ERPAn Overview of the Calendar App in Odoo 17 ERP
An Overview of the Calendar App in Odoo 17 ERP
 
CLASSIFICATION OF ANTI - CANCER DRUGS.pptx
CLASSIFICATION OF ANTI - CANCER DRUGS.pptxCLASSIFICATION OF ANTI - CANCER DRUGS.pptx
CLASSIFICATION OF ANTI - CANCER DRUGS.pptx
 
MS4 level being good citizen -imperative- (1) (1).pdf
MS4 level   being good citizen -imperative- (1) (1).pdfMS4 level   being good citizen -imperative- (1) (1).pdf
MS4 level being good citizen -imperative- (1) (1).pdf
 
Satirical Depths - A Study of Gabriel Okara's Poem - 'You Laughed and Laughed...
Satirical Depths - A Study of Gabriel Okara's Poem - 'You Laughed and Laughed...Satirical Depths - A Study of Gabriel Okara's Poem - 'You Laughed and Laughed...
Satirical Depths - A Study of Gabriel Okara's Poem - 'You Laughed and Laughed...
 
ARTERIAL BLOOD GAS ANALYSIS........pptx
ARTERIAL BLOOD  GAS ANALYSIS........pptxARTERIAL BLOOD  GAS ANALYSIS........pptx
ARTERIAL BLOOD GAS ANALYSIS........pptx
 
Indexing Structures in Database Management system.pdf
Indexing Structures in Database Management system.pdfIndexing Structures in Database Management system.pdf
Indexing Structures in Database Management system.pdf
 
Beauty Amidst the Bytes_ Unearthing Unexpected Advantages of the Digital Wast...
Beauty Amidst the Bytes_ Unearthing Unexpected Advantages of the Digital Wast...Beauty Amidst the Bytes_ Unearthing Unexpected Advantages of the Digital Wast...
Beauty Amidst the Bytes_ Unearthing Unexpected Advantages of the Digital Wast...
 
Congestive Cardiac Failure..presentation
Congestive Cardiac Failure..presentationCongestive Cardiac Failure..presentation
Congestive Cardiac Failure..presentation
 
Spearman's correlation,Formula,Advantages,
Spearman's correlation,Formula,Advantages,Spearman's correlation,Formula,Advantages,
Spearman's correlation,Formula,Advantages,
 
Healthy Minds, Flourishing Lives: A Philosophical Approach to Mental Health a...
Healthy Minds, Flourishing Lives: A Philosophical Approach to Mental Health a...Healthy Minds, Flourishing Lives: A Philosophical Approach to Mental Health a...
Healthy Minds, Flourishing Lives: A Philosophical Approach to Mental Health a...
 
How to Make a Duplicate of Your Odoo 17 Database
How to Make a Duplicate of Your Odoo 17 DatabaseHow to Make a Duplicate of Your Odoo 17 Database
How to Make a Duplicate of Your Odoo 17 Database
 
ClimART Action | eTwinning Project
ClimART Action    |    eTwinning ProjectClimART Action    |    eTwinning Project
ClimART Action | eTwinning Project
 
Introduction to Research ,Need for research, Need for design of Experiments, ...
Introduction to Research ,Need for research, Need for design of Experiments, ...Introduction to Research ,Need for research, Need for design of Experiments, ...
Introduction to Research ,Need for research, Need for design of Experiments, ...
 

Lesson11 working with charts

  • 1. Working with Charts<br />19050-2510A chart is a tool you can use to communicate your data graphically. Charts often help an audience to see the meaning behind numbers and make showing comparisons and trends easy. In this lesson, you will learn how to insert and modify charts and see how they can be an effective tool for communicating information. <br />Inserting Charts<br />To Insert a Chart:<br />Select the Insert tab.<br />Click the Insert Chart command. The Insert Chart dialog box appears. <br />Click and drag the scroll bar to view the chart types, or click a label on the left of the dialog box to see a specific chart style.<br />Click a chart to select it.<br />Click OK. Excel will open. Usually, Excel will appear on one side of the screen, while PowerPoint appears on the other side of the screen. <br />If a slide layout has a content placeholder, click the Insert Chart command to insert a new chart.<br />Enter Chart Data<br />The data that appears in the Excel spreadsheet is placeholder source data that you will replace with your own information. The Excel source data is used to create the PowerPoint chart. <br />To Enter Chart Data:<br />Select a cell in the Excel spreadsheet.<br />Enter your data in the cell. If the cell contains placeholder data, the placeholder data will disappear. As you enter your data, it will appear in the Excel spreadsheet and the PowerPoint chart.<br />Move to another cell.<br />Repeat the above steps until all your data is entered.<br />Click and drag the lower-right corner of the blue line to increase or decrease the data range for columns. The data enclosed by the blue lines will appear in the chart.<br />Click and drag the lower-right corner of the blue line to increase or decrease the data range for rows. <br />Select any cells with placeholder data remaining. In the example, the column with Series 3 data was not needed.<br />Press the Delete key to delete the remaining placeholder data.<br />Close Excel. You do not need to save the spreadsheet. The new Excel source data appears in the PowerPoint chart.<br />Formatting Charts<br />When you insert a chart, three new tabs will appear on the Ribbon. The three tabs -- Design, Layout, and Format -- contain various chart tools and commands that allow you to modify and format the chart.<br />To Change the Chart Type:<br />Select the chart.<br />Select the Design tab.<br />Click the Change Chart Type command. The Insert Chart dialog box will appear.<br />Select the chart you would like. <br />Click OK. The chart will change on the slide to the new chart type.<br />To Edit Source Data:<br />Select the chart.<br />Select the Design tab.<br />Click the Edit Data command. An Excel spreadsheet with the current source data will appear.<br />Edit the data in the spreadsheet. The changes will appear on the slide.<br />Close Excel without saving the spreadsheet.<br />To Change the Chart Style:<br />Select the chart.<br />Select the Design tab.<br />Scroll through the options in the Chart Style group, or click the More drop-down arrow to see all the chart style options.<br />Click a chart style to select it. The chart style will change on the slide.<br />Identifying the Parts of a Chart<br />Have you ever read something you didn't fully understand, but when you saw a chart or graph, the concept became clear and understandable? Charts are a visual representation of data. Charts make it easy to see comparisons, patterns, and trends in the data.<br />Source Data<br />The range of cells that make up a chart. The chart is updated automatically whenever the information in these cells change.<br />Title<br />The title of the chart.<br />Legend<br />The chart key, which identifies what each color on the chart represents.<br />Axis<br />The vertical and horizontal parts of a chart. The vertical axis is often referred to as the Y axis, and the horizontal axis is referred to as the X axis.<br />Modifying the Chart Layout<br />To Change the Chart Layout:<br />Select the chart.<br />Select the Design tab.<br />Scroll through the options in the Chart Layout group, or click the More drop-down arrow to see all the chart layout options.<br />Click a chart layout to select it. The chart layout will change on the slide.<br />The chart layout determines how specific chart information will appear. For example, some layouts include chart titles, legends, and axis labels. <br />To Modify Specific Areas of the Chart Layout:<br />Select the chart.<br />Select the Layout tab.<br />Locate the Labels group.<br />Chart Titles: Click this command to remove or add a chart title. <br />Axis Titles: Click this command and choose to hide or display the horizontal, or x axis, label; hide or display the vertical, or y axis, labels; and change the direction of the axis labels to horizontal or vertical.<br />Legend: Click this command to select a location for the legend to appear, or choose to not display a legend.<br />Data Labels: Click this command to display or hide data values next to each chart element.<br />Other Important Commands on the Layout Tab<br />In the Axes group, there are several commands that control both axes and whether the gridlines are visible. In the Background group, there are several commands that control the visual aspects of the chart. Some commands in the Analysis group will appear active only if the selected chart is a line, area, or bubble chart. <br />Additional Chart Formatting<br />Use the commands on the Format tab to modify the chart in additional ways. For example, from this tab you can change the chart outline, format chart text as WordArt, and more. <br />Challenge!<br />Use the Company Overview presentation or any other PowerPoint presentation you choose to complete this challenge.<br />Open a presentation.<br />Insert a bar chart.<br />Change the chart to a line chart.<br />Change the chart layout.<br />Apply a different chart style.<br />Add axis labels if they are not included on the layout you chose.<br />