1. CCA I TEMS OF I NTEREST
September 2011
We are in the business of sharing information and knowledge. We hope that you will find a few items of value in this brief
missive. Right click your mouse to open the underlying hyperlinks.
SELECTED METRICS
Index or Net Change1 YTD YOY
Yield1 Last Qtr. Qtr. Ave. 1 Yr. Ago M&A Activity4 US$B5 Deals5 Change5
S&P 500 1173.97 −10.58% −6.82% 7.69% Worldwide $1,837.6 25,261 31%
MSCI AC World Index 979.60 −11.72& −7.17% 5.33% US: Total 784.0 5,095 73%
3‐month LIBOR2 0.331% +8BP +7BP +4BP US: Cross‐border 129.6 950 17%
10‐year U.S. Treasury3 2.63% −81BP −59BP −48BP US: Strategic 711.5 4,342 79%
Moody’s Aaa bonds3 4.33% −55BP −41BP −12BP US: Private equity 72.5 753 32%
Moody’s Baa bonds3 5.38% −26BP −23BP −27BP Europe 500.0 1,088 29%
1 2 3 4 5
As of or for the period ended 9/2/11 FHLB of Des Moines Federal Reserve Board Thomson Reuters YTD 8/18/11
Mergers & Acquisitions
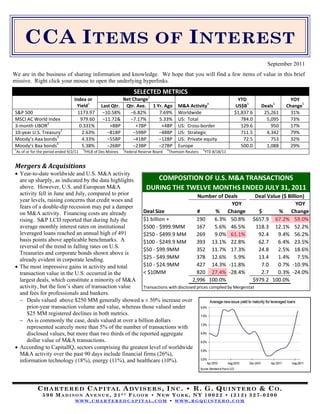
Year-to-date worldwide and U.S. M&A activity
are up sharply, as indicated by the data highlights COMPOSITION OF U.S. M&A TRANSACTIONS
above. However, U.S. and European M&A DURING THE TWELVE MONTHS ENDED JULY 31, 2011
activity fell in June and July, compared to prior Number of Deals Deal Value ($ Billion)
year levels, raising concerns that credit woes and
YOY YOY
fears of a double-dip recession may put a damper
on M&A activity. Financing costs are already Deal Size # % Change $ % Change
rising. S&P LCD reported that during July the $1 billion + 190 6.3% 50.8% $657.9 67.2% 59.0%
average monthly interest rates on institutional $500 ‐ $999.9MM 167 5.6% 46.5% 118.3 12.1% 52.2%
leveraged loans reached an annual high of 491 $250 ‐ $499.9 MM 269 9.0% 61.1% 92.4 9.4% 56.2%
basis points above applicable benchmarks. A $100 ‐ $249.9 MM 393 13.1% 22.8% 62.7 6.4% 23.5%
reversal of the trend in falling rates on U.S.
$50 ‐ $99.9MM 352 11.7% 17.3% 24.8 2.5% 18.6%
Treasuries and corporate bonds shown above is
already evident in corporate lending. $25 ‐ $49.9MM 378 12.6% 5.9% 13.4 1.4% 7.5%
The most impressive gains in activity and total $10 ‐ $24.9MM 427 14.3% ‐11.8% 7.0 0.7% ‐10.9%
transaction value in the U.S. occurred in the < $10MM 820 27.4% ‐28.4% 2.7 0.3% ‐24.0%
largest deals, which constitute a minority of M&A 2,996 100.0% $979.2 100.0%
activity, but the lion’s share of transaction value Transactions with disclosed prices compiled by Mergerstat
and fees for professionals and bankers.
Deals valued above $250 MM generally showed a ± 50% increase over
prior-year transaction volume and value, whereas those valued under
$25 MM registered declines in both metrics.
As is commonly the case, deals valued at over a billion dollars
represented scarcely more than 5% of the number of transactions with
disclosed values, but more than two thirds of the reported aggregate
dollar value of M&A transactions.
According to CapitalIQ, sectors comprising the greatest level of worldwide
M&A activity over the past 90 days include financial firms (26%),
information technology (18%), energy (11%), and healthcare (10%).
CHARTERED CAPITAL ADVISERS, INC. • R. G. QUINTERO & CO.
590 MADISON AVENUE, 21ST FLOOR • NEW YORK, NY 10022 • (212) 327-0200
WWW.CHARTEREDCAPITAL.COM • WWW.RGQUINTERO.COM
2. CCA I T E M S OF INTEREST Page 2 Septermber 2011
Private Equity
Private equity continues to offer returns STATE STREET PRIVATE EQUITY INDEX AS OF MARCH 31, 2011
that compare favorably to returns Number of Commitments Since Inception
available in the public equity markets. Strategy Funds ($Billion US) IRR
The first decade of this century has been a Buyout 910 $1,264.4 13.34%
lost decade for U. S. equity market Venture capital 813 261.8 10.07%
returns. Notwithstanding two good years Mezzanine and distressed 238 221.7 12.67%
during 2009 and 2010, the compounded Total 1,961 1,748.0 12.74%
annual total return of large-company U.S. 1,588 1,317.3 12.76%
stocks was 0.40%/year from 2000 Europe 216 331.6 14.50%
through 2010, according to Morningstar. Rest of the world 157 99.1 7.45%
Market efficiency and slow growth in the
public equity markets are among the justifications used by
managers of private equity funds for management fees and
carried interests that far exceed those charged by managers of
public stock and bond portfolios. During the past two years
Prequin reports that the median management fee during the
investment period was 2% of fund commitments. If a fund is
successful, the carried interest earned by the manager—
commonly 20% of profits earned by the fund in excess of the
fund’s hurdle rate—can far exceed fees charged based on
committed capital. Successful managers can earn up to 20% of
a fund’s profit, even though, according to Prequin data, the
median commitment by fund managers during 2010/11
amounted to 2½% of the assets of the funds that they managed.
U.S. Economic Growth (?)
A factor contributing to the lackluster
performance of the stock market has been
the declining rate of U.S. economic growth.
A logarithmic trendline analysis dating
back to 1950 reveals that the growth rate
in real GDP is declining.
The geometric mean of the compounded
annual growth rate of real GDP:
Exceeded 4% per year during the 1950s
and 1960s;
Exceeded 3% per year during the last 3
decades of the 20th century; and
Amounted to just 1.56% per year
between 2000 and 2010.
From 1950 through 1999 each decade had at
least 4 years with real GDP growth in excess
of 4%. We’ve only had a single year—
2000—during this century in which real
GDP growth exceeded 4%.
The U.S. stock market is commonly regarded by economists to be one of the best leading indicators of U.S. economic
performance. It also manifests positive and negative aspects of the economy.
Investors should not despair that returns in the U.S. stock market will be constrained by the declining economic growth rate
of the U.S. An investment in large-cap stocks provides a way of investing in the global economy. 47% of the earnings of
the S&P 500 are derived from outside the U.S.
CHARTERED CAPITAL ADVISERS, INC. • R. G. QUINTERO & CO.
590 MADISON AVENUE, 21ST FLOOR • NEW YORK, NY 10022 • (212) 327-0200
WWW.CHARTEREDCAPITAL.COM • WWW.RGQUINTERO.COM
3. CCA I T E M S OF INTEREST Page 3 Septermber 2011
IPOs
Notwithstanding the excitement generated by
the LinkedIn IPO and the Facebook IPO
anticipated for next year, it is not likely that
the U.S. IPO market will reach the frenzied
levels during the tech bubble of the late
1990s. Sarbanes Oxley and other costs have
made it increasingly expensive for companies
to go public in the U.S. Moreover, while our
IPO market is shrinking, the IPO market in
the rest of the world is expanding.
- A study of IPOs in 89 countries issued by
the National Bureau of Economic
Research1 indicates that the U.S. share of
worldwide IPOs has decreased from 27% in
the 1990s to 12% during the 2000s, even
though the U.S. share of global GDP
increased slightly during that period. Source: The Deal
Because U.S. IPOs tend to be larger, its
share of IPO proceeds demonstrated a less severe drop from 30% during the 1990s to only 21% during the 2000s.
Many smaller U.S. companies have elected to go private, “go dark,” or list their shares overseas where public company
compliance costs are lower.
It should come as no surprise that China and Hong Kong have become hottest markets for IPOs.
Law Firm Partner vs. Corporate Counsel Earnings
Gone are the days when the highest and best use of a law school education came from
becoming a partner in a large law firm. While there is no shame in average partner profits of
approximately $1.4MM at the nation’s largest law firms, compensation packages earned by
the 100 highest-paid general counsel compare favorably with that of the attorneys that they
engage. According to the August issue of Corporate Counsel:
- The median cash compensation of the 10 highest-paid general counsel during 2010
amounted $4,285,000, while their median stock-based compensation amounted to an
additional $4,844,000.
- The median cash compensation of the 100 highest-paid general counsel during 2010
amounted to $1,476,000,
excluding stock-based
compensation and other
benefits which often
exceed cash compensation.
Their cash compensation alone exceeds the average
partner profits at the 100 highest grossing law firms.
Corporate Bankruptcy Filings
With the recovery of the U.S. economy, however
modest, and possibly, temporary, the rate of corporate
bankruptcy filings has consistently declined since
reaching a peak level during the second quarter of 2009,
but has not yet fallen to pre-2008 levels.
The average duration of bankruptcies of large public
companies that were reorganized in 2010 reached a 10-
year low of 345 days (Lynn LoPucki).
1
Craig Doidge, G. Andrew Karolyi, and Rene Stulz, “The U.S. Left Behind: The Rise of IPO Activity Around the World” (NBER
Working Paper No. 16916, March 15, 2011)
CHARTERED CAPITAL ADVISERS, INC. • R. G. QUINTERO & CO.
590 MADISON AVENUE, 21ST FLOOR • NEW YORK, NY 10022 • (212) 327-0200
WWW.CHARTEREDCAPITAL.COM • WWW.RGQUINTERO.COM
4. CCA I T E M S OF INTEREST Page 4 Septermber 2011
Certification
The founder of our firm is often regarded to be one of the most credentialed financial professionals in America, with 10
professional licenses (http://charteredcapital.com/12336.html), in addition to an undergraduate and two graduate degrees in
business. In an era of increasing specialization there has been a proliferation of professional designations, as shown below.
A PARTIAL LIST OF FINANCIAL LICENSES
PRIMARY DESIGNATIONS INSURANCE PLANNING
CFA Chartered Financial Analyst cfainstitute.org BCI Board Certified in Insurance icfs.com
CFP Certified Financial Planner cfp‐board.org CAS Certified Annuity Specialist icfs.com
CPA Certified Public Accountant State Accountancy Boards CLTCC Certified in Long‐Term Care ltc‐cltc.com
CLU Chartered Life Underwriter theamericancollege.edu LUTCF Life Underwriter Training Council Fellow naifa.org
ChFC Chartered Financial Consultant theamericancollege.edu RETIREMENT PLANS (BUSINESSES)
BUSINESS VALUATION CEBS Certified Employee Benefits Specialist ifebp.org
ABV Accreditation in Business Valuation aicpa.org CPC Certified Pension Consultant asppa.org
ASA ASA Business Valuation asabv.org CRPS Chartered Retirement Plans Specialist cffp.edu
CBA Certified Business Appraiser go‐iba.org RETIREMENT PLANS (INDIVIDUALS)
CDBV Certification in Distressed Business Valuation aira.org/abv CISP Certified IRA Services Professional aba.com
CVA Certified Valuation Analyst nacva.com CRC Certified Retirement Counselor infre.org
DIVORCE PLANNING CRPC Chartered Retirement Planning Counselorcffp.edu
CDFA Certified Divorce Financial Analyst institutedfa.com CASL Chartered Advisor for Senior Living theamericancollege.edu
CDP Certified Divorce Planner institutedfa.com SENIOR LIVING
ESTATE PLANNING CSS Certified Senior Specialist centerforseniorstudies.com
AEP Accredited Estate Planner naepc.org ECS Elder Care Specialist acatcredentials.org
BCE Board Certified in Estate Planning icfs.com TAX PLANNING
CEPP Certified Estate Planner nicep.org ABA Accredited Business Accountant acatcredentials.org
CEPP Chartered Estate Planning Practitioner cepp‐epi.com CPA Certified Public Accountant State Accountancy Boards
CTEP Chartered Trust and Estate Planner financialanalyst.org CTS Certified Tax Specialist icfs.com
Upcoming Seminars
R. G. Quintero & Co. CFA Review:
- Weekday, weekend, and intensive-review CFA examination prep courses for Levels I, II, and III
- Midtown Manhattan and Stamford, Connecticut beginning July 2011 for the December 2011 CFA Exam, and January
2012 for the June 2012 CFA Exam
Offered at various dates throughout the United States through Center for Professional Education, Inc., (800) 544-1114:
- Business Combinations & Consolidations (emphasis on - Fair Value Accounting: Valuation Techniques
applying FASB 141R and 142) - Financial Restructuring & Bankruptcy
- Due Diligence: Steps to Securing a Good Deal - Mergers & Acquisitions: A Current Guide to Deal-Making
- Fair Value Accounting: Impact of FAS 157 and Beyond - Stock-Based Compensation (FASB 123R)
We also provide in-house training at leading financial institutions, CPA firms, and law firms
Call us at (212) 327-0200 for further information or visit http://www.rgquintero.com/5873.html to see a list of our most
frequent course offerings
Our Services
Chartered Capital Advisers: R. G. Quintero & Co.:
- Valuations of businesses, intangible assets, goodwill, - Bankruptcy, insolvency & financial restructuring services
stock options, and other financial instruments - Forensic accounting
- Transaction advisory services and fairness opinions - Litigation-support services
- Litigation-support services - Financial training
Key Contacts
Ronald G. Quintero, CPA, CFA, ABV (212) 327-0200 q@charteredcapital.com or q@rgquintero.com
Zafar Bin Basher, CPA, CFF, ABV (516) 965-5747 (cell) zbb@charteredcapital.com
William D. Betts, Jr., (508) 207-3309 (cell) betts@charteredcapital.com
George C. Papaionnou, (917) 887-0914 (cell) gp@charteredcapital.com
Postscript
This newsletter is provided at no cost to our friends and clients. It may not be construed as investment, legal, tax, or
accounting advice. Please contact us at info@charteredcapital.com if you wish to add a colleague to our mailing list,
update your email contact, or be removed from our mailing list. Our mission is to be of service.
CHARTERED CAPITAL ADVISERS, INC. • R. G. QUINTERO & CO.
590 MADISON AVENUE, 21ST FLOOR • NEW YORK, NY 10022 • (212) 327-0200
WWW.CHARTEREDCAPITAL.COM • WWW.RGQUINTERO.COM