SlideShare a Scribd company logo
1 of 186
Download to read offline
U.S. Department of the Interior
U.S. Geological Survey
Scientific Investigations Report 2010–5070–B
Porphyry Copper Deposit Model
Cover.  Photographs of porphyry copper deposits and ores. Upper left: Ray Mine, Arizona, one of the largest porphyry copper
	 deposits in the United States. Upper right: High-grade copper ore from the Ray Mine, Arizona. Chalcopyrite veins cut the  
	 Ray diabase. Sample is about 6.5 centimeters wide. Lower left: Chrysocolla (blue) cementing gravel, Black Copper Wash,  
	 Kelvin-Riverside district, Arizona. Small exotic copper deposit in older Holocene gravel deposits that cover Kelvin-Riverside 
	 porphyry copper system. Hammer handle is about 28 centimeters long. Lower right: View of the west side of Red Mountain,  
	 Arizona, showing hydrothermally altered volcanic rocks that overlie porphyry copper deposit that lies about 1,000 meters  
	 below the top of the mountain.
Porphyry Copper Deposit Model
By David A. John, editor, with contributions by Robert A. Ayuso,
Mark D. Barton, Richard J. Blakely, Robert J. Bodnar,
John H. Dilles, Floyd Gray, Fred T. Graybeal, John C. Mars,
Darcy K. McPhee, Robert R. Seal, Ryan D. Taylor,
and Peter G. Vikre
Chapter B of
Mineral Deposit Models for Resource Assessment
Scientific Investigations Report 2010–5070–B
U.S. Department of the Interior
U.S. Geological Survey
U.S. Department of the Interior
KEN SALAZAR, Secretary
U.S. Geological Survey
Marcia K. McNutt, Director
U.S. Geological Survey, Reston, Virginia: 2010
For more information on the USGS—the Federal source for science about the Earth, its natural and living resources,
natural hazards, and the environment, visit http://www.usgs.gov or call 1-888-ASK-USGS
For an overview of USGS information products, including maps, imagery, and publications,
visit http://www.usgs.gov/pubprod
To order this and other USGS information products, visit http://store.usgs.gov
Any use of trade, product, or firm names is for descriptive purposes only and does not imply endorsement by the
U.S. Government.
Although this report is in the public domain, permission must be secured from the individual copyright owners to
reproduce any copyrighted materials contained within this report.
Suggested citation:
John, D.A., Ayuso, R.A., Barton, M.D., Blakely, R.J., Bodnar, R.J., Dilles, J.H., Gray, Floyd, Graybeal, F.T., Mars, J.C.,
McPhee, D.K., Seal, R.R., Taylor, R.D., and Vikre, P.G., 2010, Porphyry copper deposit model, chap. B of Mineral deposit
models for resource assessment: U.S. Geological Survey Scientific Investigations Report 2010–5070–B, 169 p.
iii
Contents
Abstract............................................................................................................................................................1
Summary of Porphyry Copper Deposit Model ..........................................................................................1
Associated Commodities and Deposit Types ...................................................................................1
Regional Environment ..........................................................................................................................1
Physical Description of Deposits........................................................................................................2
Geophysical Characteristics................................................................................................................3
Hypogene Ore Characteristics............................................................................................................3
Supergene Ore Characteristics...........................................................................................................4
Hypogene and Supergene Gangue Characteristics........................................................................4
Hydrothermal Alteration.......................................................................................................................5
Geochemical Characteristics..............................................................................................................6
Petrology of Associated Igneous Rocks............................................................................................7
Theory of Ore Deposit Genesis............................................................................................................8
Sources of Fluids .........................................................................................................................8
Controls on Permeability and Fluid Flow...................................................................................8
Chemical Transport and Transfer Processes...........................................................................9
Heat-Transfer Processes.............................................................................................................9
Pressure Gradients.......................................................................................................................9
Wall-Rock Reaction and Ore-Mineral Deposition Processes...............................................9
Relation between Alteration, Gangue, and Veins..................................................................10
Geoenvironmental Features...............................................................................................................10
Porphyry Copper Deposit Exploration and Resource Assessment Objectives
and Guides...............................................................................................................................10
Broader Implications, Societal Relevance, and Knowledge Gaps of Porphyry
Copper Deposits.....................................................................................................................10
A.  Introduction.............................................................................................................................................11
B.  Deposit Type and Associated Commodities.......................................................................................11
Name	 ...................................................................................................................................................11
Synonyms..............................................................................................................................................11
Brief Description..................................................................................................................................13
Associated and Transitional Deposit Types....................................................................................14
Primary Commodities .........................................................................................................................14
By-Product Commodities ...................................................................................................................14
Trace Constituents...............................................................................................................................14
Example Deposits................................................................................................................................14
C.  History of Porphyry Copper Deposits..................................................................................................14
D.  Regional Environment ...........................................................................................................................15
Geotectonic Environment ..................................................................................................................15
Temporal (Secular) Relations.............................................................................................................18
Variations Through Geologic Time...........................................................................................18
Variation Within Magmatic Cycles..........................................................................................18
Duration of Magmatic-Hydrothermal Systems that Form Porphyry Copper Deposits ............18
Relations to Structures ......................................................................................................................21
iv
Structural Setting(s) and Controls...........................................................................................21
Tectonic Setting..........................................................................................................................21
Structural Control of Magma Emplacement...........................................................................21
Origin of Veins.............................................................................................................................21
Preservation and Dismemberment of Porphyries.................................................................23
Relations to Igneous Rocks................................................................................................................24
Relations to Sedimentary Rocks ......................................................................................................24
Relations to Metamorphic Rocks......................................................................................................24
E.  Physical Description of Deposits..........................................................................................................24
Dimensions in Plan View....................................................................................................................25
Vertical Extent .....................................................................................................................................25
Form/Shape ..........................................................................................................................................25
Size of Hydrothermal Systems Relative to Extent of Economically
Mineralized Rock....................................................................................................................25
Host Rocks ...........................................................................................................................................28
Structural Setting(s) and Controls....................................................................................................28
F.  Geophysical Characteristics .................................................................................................................28
Introduction .........................................................................................................................................28
Regional-Scale Geophysics ..............................................................................................................31
Deposit-Scale Geophysics ................................................................................................................32
Magnetic Anomalies..................................................................................................................32
Electrical and Electromagnetic Methods...............................................................................33
Electrical Methods............................................................................................................35
Electromagnetic Methods................................................................................................36
Examples of Electrical and Electromagnetic Surveys in Porphyry
Copper Exploration...............................................................................................37
Other Geophysical Methods.....................................................................................................37
Self (Spontaneous) Potential ..........................................................................................37
Gravity	.................................................................................................................................37
Seismic Reflection.............................................................................................................38
Limitations ............................................................................................................................................38
VINR-SWIR and TIR Remote Sensing of Porphyry Copper Deposits..........................................38
Introduction.................................................................................................................................38
Porphyry Copper Deposits and Spectral Characteristics....................................................38
Hyperspectral and Multispectral Imaging Systems and Previous
Studies Mapping Porphyry Copper Deposits...........................................................39
Case Study—Mapping Altered Rocks in the Sar Cheshmeh Region
of Iran using ASTER Data.............................................................................................43
Introduction, Geology, and Mapped Alteration............................................................43
Data and Calibration—Mapping Methods—ASTER False Color
Composite Image..................................................................................................45
Description and Interpretation of ASTER468 Image and ASTER
Alteration Minerals Map.....................................................................................46
Conclusions.................................................................................................................................50
G.  Hypogene Ore Characteristics.............................................................................................................50
Grade	 ...................................................................................................................................................50
v
Mineralogy............................................................................................................................................50
Mineral Assemblages.........................................................................................................................51
Paragenesis and Zoning.....................................................................................................................51
Forms and Textures.............................................................................................................................51
H and K.  Hypogene and Supergene Gangue Characteristics..............................................................55
Mineralogy............................................................................................................................................55
Mineral Assemblages and Paragenesis..........................................................................................55
Zoning	...................................................................................................................................................55
Textures and Grain Sizes of Hypogene Gangue ............................................................................56
Textures and Grain Sizes of Supergene Gangue ...........................................................................56
Significance of Gangue......................................................................................................................57
I.  Hydrothermal Alteration..........................................................................................................................57
Mineralogy............................................................................................................................................57
Mineralogy of Assemblages and Associated Veins......................................................................57
Lateral and Vertical Dimensions ......................................................................................................60
Selvages................................................................................................................................................60
Rock Matrix Alteration........................................................................................................................62
Intensity.................................................................................................................................................62
Textures.................................................................................................................................................62
Zoning Patterns....................................................................................................................................62
J.  Supergene Ore Characteristics ...........................................................................................................64
Dimensions, Tonnages, and Grades ................................................................................................65
Formation and Distribution ................................................................................................................65
Mineralogy............................................................................................................................................66
Mineral Associations and Assemblages.........................................................................................66
Textures and Grain Size .....................................................................................................................66
L.  Weathering/Supergene Processes .....................................................................................................66
Introduction..........................................................................................................................................66
Mineralogy............................................................................................................................................68
Rates	 ...................................................................................................................................................68
Effects of Micro and Macro Climates..............................................................................................68
Effects of Hydrologic Setting.............................................................................................................68
M.  Geochemical Characteristics..............................................................................................................70
Lithochemistry .....................................................................................................................................70
Minor Element Zoning Patterns ........................................................................................................70
Mineral Compositions ........................................................................................................................73
Fluid-Inclusion Thermometry and Geochemistry ..........................................................................80
Chemical Compositions of Fluids .....................................................................................................83
Stable Isotope Compositions of Fluids ............................................................................................87
Nontraditional Stable Isotopes—Copper and Molybdenum .......................................................88
N.  Petrology of Associated Igneous Rocks ............................................................................................89
Rock Names..........................................................................................................................................89
Forms of Igneous Rocks and Rock Associations ..........................................................................89
Mineralogy ...........................................................................................................................................89
Textures and Structures.....................................................................................................................89
vi
Grain Size..............................................................................................................................................91
Petrochemistry.....................................................................................................................................91
Trace-Element Geochemistry............................................................................................................97
Isotope Geochemistry.......................................................................................................................100
Radiogenic Isotopes of Ore .............................................................................................................106
Depth of Emplacement......................................................................................................................107
O.  Petrology of Associated Sedimentary Rocks .................................................................................107
P.  Petrology of Associated Metamorphic Rocks ................................................................................107
Q.  Theory of Ore Deposit Formation ......................................................................................................108
Ore Deposit System Affiliations ......................................................................................................108
Controls on Permeability and Fluid Flow........................................................................................109
Sources of Fluids and Metals..........................................................................................................109
Chemical Transport and Transfer Processes................................................................................112
Heat Transport and Transfer Processes........................................................................................113
Time Scale..................................................................................................................................113
Pressure Gradients During Porphyry Copper System Formation..............................................114
Wall-Rock Reaction and Ore-Mineral Deposition Processes ...................................................114
Relation Between Alteration, Gangue and Vein Mineralization................................................115
R.  Porphyry Copper Exploration and Resource Assessment Guides ...............................................116
Hypogene Characteristics of PCDs and Gradients within PCD Systems.................................116
Mapping of Rock Types, Structure, Hydrothermal Minerals, and Zoning.......................116
Fluid Inclusion Zoning and Thermal Gradients ...................................................................117
Mineral Properties....................................................................................................................117
Vein Abundance, Mineralogy, and Paragenesis.................................................................117
Distribution of Sulfide Minerals..............................................................................................117
Minor-Element Geochemistry.................................................................................................117
Spectral Imagery......................................................................................................................120
Supergene-Enriched and Oxidized PCDs......................................................................................120
Supergene Enrichment and Leached Capping Characteristics........................................120
Copper-Oxide Minerals ...........................................................................................................120
Recognition of Permissive Terrain for Porphyry Copper Exploration and Assessment.........121
Postmineralization Cover and Proximity to Porphyry Copper Deposits...........................121
Regional Structure and Intrusion Emplacement.................................................................121
Continental-Scale Permissive Terrains ................................................................................121
Depth Limitations......................................................................................................................121
S.  Geoenvironmental Features ...............................................................................................................122
Weathering Processes.....................................................................................................................122
Pre-Mining Baseline Signatures in Soil, Sediment, and Water ................................................123
Past and Future Mining Methods and Ore Treatment ................................................................124
Volume of Mine Waste and Tailings ..............................................................................................124
Mine Waste Characteristics ...........................................................................................................124
Acid/Base Accounting .....................................................................................................................124
Metal Mobility Related to Mining in Groundwater and Surface Water ...................................124
Pit Lakes .............................................................................................................................................124
Ecosystem Issues .............................................................................................................................125
vii
Human Health Issues .......................................................................................................................125
Climate Effects on Geoenvironmental Signatures ......................................................................125
T.  Knowledge Gaps and Future Research Directions .........................................................................125
U.  Broader Implications and Societal Relevance of Porphyry Copper Systems............................126
References Cited........................................................................................................................................131
Appendix 1.  Grade and tonnage models................................................................................................158
Appendix 2.  Characteristics of Representative Porphyry Copper Deposits ...................................158
Figures
	 A1.  Map showing Phanerozoic porphyry belts, porphyry deposits, and
representative porphyry copper deposits summarized in Appendix 2...............................12
	 B1.  Schematic cross section showing general setting of porphyry copper
and associated deposit types....................................................................................................13
	 D1.  Diagrams showing plate tectonic setting of porphyry copper deposits............................16
	 D2.  Simplified map of porphyry copper belts and major porphyry copper
deposits in the Andes..................................................................................................................17
	 D3.  Cartoon cross section showing optimum conditions for development of
giant porphyry copper deposits................................................................................................18
	 D4.  Map of Southeast Asia and the west Pacific showing major Cenozoic arcs
and copper ± gold and gold deposits.......................................................................................19
	 D5.  Histogram of the ages of known porphyry copper deposits................................................20
	 D6.  Maps showing porphyry veins..................................................................................................22
	 D7.  Cross sections showing offset and tilting of the San Manuel–Kalamazoo
orebody by the San Manuel fault..............................................................................................23
	 E1.  Generalized geologic maps and vertical profiles through several porphyry
copper deposits showing vertical extent of ore and footprints of porphyry
copper deposits...........................................................................................................................26
	 E2.  Maps showing copper ore zones at Batu Hijau, Indonesia, Bingham in Utah,
Pre-Main stage porphyry copper-molybdenum mineralization at Butte,
Montana, Bajo el Alumbrera, Argentina, and Yerington, Nevada.......................................27
	 E3.  Plan map showing geochemical zoning around the Bingham Canyon
deposit, Utah.................................................................................................................................29
	 E4.  Schematic cross section showing relationship of hydrothermal systems
and porphyry copper and related deposits to crystallizing granitic batholith
based on exposed deposits and altered rocks in and near the Yerington
district in western Nevada.........................................................................................................30
	 F1.  Map showing aeromagnetic anomalies from the Quebrada
Blanca–Collahuasi district, northern Chile..............................................................................32
	 F2.  Cross sections showing magnetic anomaly caused by a hypothetical
porphyry copper deposit............................................................................................................34
	 F3.  Map showing aeromagnetic anomalies over the Silver Bell porphyry
copper deposits in Arizona........................................................................................................35
	 F4.  Resistivity, chargeability, and susceptibility of the Mount Milligan porphyry
deposits in British Columbia, as determined through inversion of direct-
current resistivity, induced polarization, and magnetic measurements............................36
	 F5.  Illustrated deposit model of a porphyry copper deposit.......................................................39
viii
	F6–F9.  Graphs showing:
	 F6.  Laboratory spectra of epidote, calcite, muscovite, kaolinite, chlorite,
and alunite, which are common hydrothermal alteration minerals...........................40
	 F7.  TIR laboratory spectra of quartz and opal at full TIR spectrometer
spectral resolution (2600 bands) and resampled to ASTER TIR
spectral resolution (5 bands)............................................................................................41
	 F8.  Comparison of ASTER, AVIRIS, and Landsat Thematic Mapper (TM)
VNIR and SWIR image spatial and spectral characteristics......................................41
	 F9.  (A) VNIR–SWIR AVIRIS (AV), ASTER (AST), and Landsat TM-ETM+ (TM)
resampled spectral pairs of epidote, calcite, muscovite, kaolinite,
chlorite, and alunite. (B) VNIR–SWIR AVIRIS (AV), ASTER (AST), and
Landsat TM-ETM+ (TM) resampled spectral pairs of limonite,
jarosite, hematite, and goethite........................................................................................42
	 F10.  Maps showing TM band 7 image with argillically- and sericitically-altered
rocks of the area around the Meiduk copper mine in Iran and alteration
minerals map of the Infiernillo copper porphyry deposit in Argentina...............................44
	 F11.  Geologic map of the Sar Cheshmeh and Seridune area.......................................................45
	 F12.  Detailed alteration and lithologic map of the Sar-Cheshmeh deposit, Iran.......................46
	 F13.  Detailed lithologic map of the Seridune prospect and hydrothermal
alteration map of the Seridune prospect.................................................................................47
	 F14.  ASTER false color composite image of the Sar Cheshmeh area........................................48
	 F15.  ASTER minerals map of the Sar Cheshmeh area consisting of an ASTER
false color composite image and advanced argillic, sericitic, propylitic,
and silica-rich rocks....................................................................................................................49
	 I1.  Diagram showing AKF–ACF mineral assemblages in major types of
wall-rock alteration.....................................................................................................................58
	 I2.  Schematic cross sections showing hydrothermal alteration zoning
patterns and fluid flow paths for porphyry copper deposits emplaced in
different environments................................................................................................................61
	 I3.  Graph showing temperature relative to mKCl
/mHCl
diagram for the system
K2
O-Al2
O3
-SiO2
-KCl-HCl-H2
O at 1 kilobar with quartz present showing
mineral stability and fields for hydrothermal alteration types common
in porphyry copper deposits......................................................................................................63
	 I4.  Model of fluid circulation and alteration in the root zone environment of
porphyry copper deposits..........................................................................................................64
	 J1.  Schematic cross section showing mature supergene profile based on
porphyry copper deposits in northern Chile............................................................................65
	 L1.  Diagram showing mature gossan profile................................................................................67
	 M1.  Example of lithogeochemistry applied to porphyry copper deposit
identification in the Collahuasi district, Chile..........................................................................71
	M2–M3.  Gain/loss diagrams for:
	 M2.  Major oxides and minor elements in altered rocks in the Bajo de la
Alumbrera porphyry copper deposit, Argentina............................................................72
	 M3.  Major and minor elements in potassic and phyllic alteration zones
in the Sar Chesmeh porphyry copper deposit, Iran, based on
comparisons of least altered to potassically altered rocks, and
potassically altered to phyllically altered rocks............................................................73
	 M4.  Cross sections showing distribution of ore-grade copper and gold in the
porphyry copper-gold deposit at Bajo de la Alumbrera, Argentina....................................73
ix
	M5–M7.  Graphs showing:
	 M5.  Distribution of molybdenum and zinc relative to copper and alteration
zones in the porphyry copper deposit at Red Mountain, Arizona..............................74
	 M6.  Compositions of magmatic and hydrothermal biotite in porphyry
copper-molybdenum deposits, and porphyry molybdenum deposits,
and magmatic biotites from granitic intrusions, based on magnesium,
iron, fluorine, and chlorine concentrations....................................................................75
	 M7.  Manganese oxide in coexisting chlorite and epidote relative to
lateral distance from the outer edge of the biotite alteration zones
in the Silver Bell and Safford porphyry copper deposits, Arizona.............................76
	 M8.  Plan view of illite crystallinity relative to hydrothermal alteration zones
and hypogene and supergene copper grades at various depths in the
Campana Mahuida porphyry copper deposit, Argentina......................................................77
	 M9.  Cathodoluminescence image of bright quartz cut by dark quartz in a
quartz+pyrite vein from the porphyry copper deposit at Butte, Montana..........................78
	 M10.  Map showing distribution of sulfur isotope compositions of hypogene
sulfide minerals relative to alteration zones and gold grade in the Cadia
alkalic porphyry gold-copper deposit, Australia, corrected for temperature
fractionations between pyrite, chalcopyrite, and bornite....................................................79
	 M11.  Photographs showing examples of different types of fluid inclusions found
in porphyry copper deposits......................................................................................................81
	 M12.  Diagram showing phases in fluid inclusions at room temperature and
corresponding entrapment pressures and temperatures for magmatic
fluid inclusions from several porphyry copper deposits.......................................................83
	 M14.  Diagram showing distribution of fluid inclusion types in time and space
along a traverse from the center to the periphery of the system and along
a traverse from shallow to deep in the center of the system...............................................84
	 M13.  Graph showing copper concentration compared to homogenization
temperature for two fluid inclusion groups, and relative to chalcopyrite
solubility, Bingham porphyry copper deposit in Utah............................................................84
	 M15.  South-southeast to north-northwest section through the Bingham
porphyry copper deposit in Utah, showing distribution of fluid inclusion
types, copper orebody with grade contours, quartz vein abundances,
quartz monzonite porphyry, and monzonite............................................................................85
	M16–M17.  Graphs showing:
	 M16.  Partitioning of elements between vapor and liquid, determined by
LA–ICP–MS analysis of coeval, individual vapor-rich and liquid-rich
fluid inclusions from the Bajo de la Alumbrera, Argentina, and
Grasberg, Indonesia, porphyry copper-gold deposits..................................................86
	 M17.  δ18
O and δD compositions of hydrothermal fluids in equilibrium with
hydrothermal minerals and mineral zones, in per mil, for porphyry
copper deposits at El Salvador, Chile, Oyu Tolgoi, Mongolia,
La Caridad, Mexico, Bingham, Utah, and Butte, Montana..........................................88
	 N1.  Histogram of rock types in porphyry copper deposits..........................................................90
	 N2.  Photograph of drill core of quartz feldspar porphyry from Sunnyside
porphyry copper system in Arizona that forms main host rock for
copper-molybdenum resource..................................................................................................90
	 N3.  Plots summarizing whole-rock chemical data for selected suites of
igneous rocks related to porphyry copper systems..............................................................92
x
Tables
	 E1.  Summary statistics of areas of ore, sulfides, and altered rock in porphyry
copper deposits compiled in Singer and others ....................................................................28
	 G1.  Frequency of occurrence (percentage of deposits) of hypogene
hydrothermal (H) and supergene minerals and elements (S) in porphyry
copper deposits...........................................................................................................................52
	 G2.  Some common hypogene vein and disseminated mineral assemblages
in porphyry copper deposits......................................................................................................54
	 L1.  Mineral assemblages in geochemical domains in high and low mass flux
conditions......................................................................................................................................69
	 L2.  Minerals commonly found in the oxide zone of porphyry copper deposits.......................69
	 N1.  Temporal evolution of the definition of adakites ...................................................................94
	 N2.  General chemical characteristics of selected porphyry copper-
molybdenum stocks. ...................................................................................................................96
	N4–N6.  Graphs showing:
	 N4.  Yttrium compared to strontium/yttrium diagram for samples of
plutonic rocks associated with porphyry copper deposits.........................................99
	 N5.  207
Pb/204
Pb-206
Pb/204
Pb diagrams showing generalized fields of granitic
rocks, feldspars, and sulfide minerals associated with porphyry
copper deposits................................................................................................................102
	 N6.  Neodymium-strontium isotope compositions of granitic rocks
associated with porphyry copper deposits..................................................................103
	 N7.  Map showing depth of erosion of Mesozoic plutonic rocks and copper
and tungsten deposits in the Western United States..........................................................108
	 Q1.  Graph showing pressure-temperature diagram for the NaCl-H2
O fluid
system, showing isopleths of solubility of sodium chloride in water and
in steam with approximate depths corresponding to lithostatic pressures
on right vertical axis and hydrostatic pressures on left vertical axis...............................110
	 R1.  Cross sections of a model of a porphyry copper system that shows the
distribution and types of mineral deposits, rocks, and alteration zones in
porphyry copper systems, and lateral profiles of system attributes that
compose exploration guides....................................................................................................118
	 U1.  Diagram showing estimates of the annual flux of elements mined during
the production of porphyry deposits as compared to annual global
consumption of the same elements........................................................................................127
	 U2.  Schematic diagrams showing generalized mass flow in the crust, at the
surface, and during mining in relation to Lifecycles of Porphyry Copper
Deposits project tasks..............................................................................................................128
	 U3.  Map of Arizona showing the distribution of known porphyry copper
deposits, Laramide-age (coeval) igneous rocks, post-Laramide cover,
and areas where mineral development is restricted by population growth
or other land-use restrictions..................................................................................................130
xi
Conversion Factors
SI to Inch/Pound
Multiply By To obtain
Length
centimeter (cm) 0.3937 inch (in.)
millimeter (mm) 0.03937 inch (in.)
meter (m) 3.281 foot (ft)
kilometer (km) 0.6214 mile (mi)
kilometer (km) 0.5400 mile, nautical (nmi)
meter (m) 1.094 yard (yd)
Area
square meter (m2
) 0.0002471 acre
square kilometer (km2
) 247.1 acre
square centimeter (cm2
) 0.001076 square foot (ft2
)
square meter (m2
) 10.76 square foot (ft2
)
square centimeter (cm2
) 0.1550 square inch (ft2
)
square kilometer (km2
) 0.3861 square mile (mi2
)
Volume
cubic meter (m3
) 6.290 barrel (petroleum, 1 barrel = 42 gal)
liter (L) 33.82 ounce, fluid (fl. oz)
liter (L) 2.113 pint (pt)
liter (L) 1.057 quart (qt)
liter (L) 0.2642 gallon (gal)
cubic meter (m3
) 264.2 gallon (gal)
cubic meter (m3
) 0.0002642 million gallons (Mgal)
liter (L) 61.02 cubic inch (in3
)
cubic meter (m3
) 35.31 cubic foot (ft3
)
cubic meter (m3
) 1.308 cubic yard (yd3
)
cubic kilometer (km3
) 0.2399 cubic mile (mi3
)
cubic meter (m3
) 0.0008107 acre-foot (acre-ft)
Weight
gram (g) 0.03527 ounce, avoirdupois (oz)
kilogram (kg) 2.205 pound avoirdupois (lb)
metric ton per year 1.102 ton per year (ton/yr)
Pressure
bar 100 kilopascal (kPa)
kilobar 100 megapascal (mPa)
xii
Temperature in degrees Celsius (°C) may be converted to degrees Fahrenheit (°F) as follows:
°F=(1.8×°C)+32
Temperature in degrees Fahrenheit (°F) may be converted to degrees Celsius (°C) as follows:
°C=(°F-32)/1.8
Altitude, as used in this report, refers to distance above the vertical datum.
*Transmissivity: The standard unit for transmissivity is cubic foot per day per square foot times
foot of aquifer thickness [(ft3
/d)/ft2
]ft. In this report, the mathematically reduced form, foot
squared per day (ft2
/d), is used for convenience.
Specific conductance is given in microsiemens per centimeter at 25 degrees Celsius (µS/cm
at 25°C).
Concentrations of chemical constituents in water are given either in milligrams per liter (mg/L)
or micrograms per liter (µg/L).
NOTE TO USGS USERS: Use of hectare (ha) as an alternative name for square hectometer (hm2
)
is restricted to the measurement of small land or water areas. Use of liter (L) as a special name
for cubic decimeter (dm3
) is restricted to the measurement of liquids and gases. No prefix other
than milli should be used with liter. Metric ton (t) as a name for megagram (Mg) should be
restricted to commercial usage, and no prefixes should be used with it.
Porphyry Copper Deposit Model
By David A. John, editor, with contributions by Robert A. Ayuso, Mark D. Barton, Richard J. Blakely,
Robert J. Bodnar, John H. Dilles, Floyd Gray, Fred T. Graybeal, John C. Mars, Darcy K. McPhee,
Robert R. Seal, Ryan D. Taylor, and Peter G. Vikre
Abstract
This report contains a revised descriptive model of
porphyry copper deposits (PCDs), the world’s largest source
(about 60 percent) and resource (about 65 percent) of copper
and a major source of molybdenum, gold and silver. Despite
relatively low grades (average 0.44 percent copper in 2008),
PCDs have significant economic and societal impacts due to
their large size (commonly hundreds of millions to billions
of metric tons), long mine lives (decades), and high produc-
tion rates (billions of kilograms of copper per year). The
revised model describes the geotectonic setting of PCDs, and
provides extensive regional- to deposit-scale descriptions and
illustrations of geological, geochemical, geophysical, and
geoenvironmental characteristics. Current genetic theories are
reviewed and evaluated, knowledge gaps are identified, and
a variety of exploration and assessment guides are presented.
A summary is included for users seeking overviews of
specific topics.
Summary of Porphyry Copper Deposit
Model
(David A. John, Peter G. Vikre, Richard J. Blakely,
and Robert R. Seal)
Porphyry copper deposits (PCDs) consist of disseminated
copper minerals and copper minerals in veins and breccias
that are relatively evenly distributed in large volumes of rock,
forming high tonnage (greater than 100 million tons), low to
moderate grade (0.3–2.0 percent copper) ores. Host rocks are
altered and genetically related granitoid porphyry intrusions
and adjacent wall rocks. Porphyry copper deposits are the
world’s most important source of copper, accounting for more
than 60 percent of the annual world copper production and
about 65 percent of known copper resources. PCDs also are an
important source of other metals, notably molybdenum, gold,
and silver. Despite their relatively low grades, PCDs have a
significant societal and economic impact due to their large size
(commonly hundreds of millions to billions of metric tons),
long mine lives, and scale of mining operations. Porphyry
copper deposits were the first type of metallic mineral deposit
exploited by large-scale, open-pit mining methods in the early
20th century, a low-cost mining technique since adapted to
other large-tonnage, low-grade mineral deposits (for example,
gold and silver).
Associated Commodities and Deposit Types
Porphyry copper deposits are mined primarily for
copper, although molybdenum and gold are co-products in
some deposits, and with silver a by-product in many deposits.
Rhenium, tellurium, platinum group elements, arsenic, and
zinc are recovered from a few deposits.
With increasing molybdenum/copper, porphyry copper
deposits are transitional to low fluorine (quartz monzonite
type) porphyry molybdenum deposits, and with increasing
gold/copper, they are transitional to porphyry gold deposits.
A variety of mineral deposits may be genetically associ-
ated with porphyry copper deposits, including:
•	 Skarns (including copper, iron, gold, zinc types)
•	 Polymetallic replacement (silver, lead, zinc, copper,
gold)
•	 Polymetallic veins (gold, silver, copper, lead, zinc,
manganese, arsenic)
•	 Distal disseminated gold-silver (gold, silver)
•	 Epithermal vein (intermediate/low sulfidation gold-
silver)
•	 High sulfidation epithermal (gold, silver, copper,
arsenic)
Regional Environment
The regional, deposit-scale, and local-scale environments
of porphyry copper deposits are diverse, and despite much
scientific study, many features are poorly understood in regard
to their relevance as controls of ore formation. Porphyry
copper systems are widespread (fig. A1), but they are mostly
2   Porphyry Copper Deposit Model
localized in time and space within the evolution of magmatic
arcs along convergent plate margins where subduction of
oceanic crust and arc-type magmatism generates hydrous,
oxidized upper crustal granitoids genetically related to ores. In
most cases, arc crust is relatively thick, and there is evidence
for broadly coeval compressional or transpressional tectonism.
Some authors have suggested that many porphyry copper
deposits formed during unusual periods of subduction, includ-
ing flat subduction induced by subduction of buoyant oceanic
structures, such as ridges, ocean plateaus, and seamount
chains, or during episodes of plate reorganization. Within this
broadly compressive environment, transpression is expressed
as strike-slip faults with significant reverse movement, and it
has been suggested that stress relaxation to transtensional or
mildly extensional conditions is associated with emplacement
of mineralized porphyry intrusions.
Some porphyry copper deposits formed in postsubduc-
tion magmatic settings in both extensional and compressional
environments. Magmas formed in postsubduction settings
tend to be small volume, spatially isolated, and mildly alkaline
(high-K ± Na calc-alkaline) to strongly alkaline in composi-
tion, although some of the world’s largest porphyry copper
(gold) deposits are interpreted to have formed in this tectonic
setting (for example, Grasberg, Indonesia).
Porphyry copper deposits have formed throughout most
of Earth’s history, but because they generally form in the
upper crust (less than 5–10 km depth) in tectonically unstable
convergent plate margins and are prone to erosion, more than
90 percent of known deposits are Cenozoic or Mesozoic in age
(see fig. D5). Postmineral faults figure prominently in preser-
vation of porphyry copper deposits, but they also present large
challenges to exploration and assessment.
Fracture and vein systems and breccias are an inevitable
consequence of porphyry magmatism. Ascent of intermediate
and silicic hydrous magmas into the upper crust from deeper
sources is driven by the buoyancy of these magmas that are
less dense than the surrounding crust. Where density contrasts
decrease in the upper crust, buoyancy forces diminish so that
magmas pond to form plutons or batholiths. Hydrous fluids
are produced as magmas cool, crystallize, and solidify causing
volatile exsolution.
Porphyry intrusions may be pluglike and enclosed in both
steeply dipping, radial fractures and gently dipping, concen-
tric fractures, reflecting stress conditions that are magma-
dominated where the two horizontal principal stresses are
nearly equal. However, sets of concentric and radial fractures
are rarely documented in porphyry copper deposits. Rather,
steeply dipping, sheeted, parallel vein and dikelike porphyry
intrusions are more common and presumably reflect condi-
tions where the two principal horizontal stresses are signifi-
cantly different and likely reflect the far-field stress regime.
Physical Description of Deposits
The dimensions and geometries of porphyry copper
deposits vary widely, due in part to post-ore intrusions, the
varied types of host rocks that influence deposit morphology,
the relative amounts of supergene and hypogene ore, each of
which has different configurations, and especially erosion and
post-ore deformation including faulting and tilting. For many
deposits, large uncertainties arising from incomplete exposure
and(or) exploration, post-ore intrusions, and post-ore deforma-
tion preclude accurate determination of the original deposit
geometry and dimensions.
Porphyry copper deposits commonly are centered around
small cylindrical porphyry stocks or swarms of dikes that in
some cases are demonstrably cupolas of larger underlying
plutons or batholiths (see fig. E4). Plan areas of ore-related
intrusions typically range from 0.2 to 0.5 km2
. Undeformed
deposits commonly have circular or elliptical shapes in plan
view, with diameters that typically range from 0.1 to 1.0 km
and have vertical dimensions that are similar to their horizon-
tal dimensions. In cross section, ore zones vary from cylin-
drical shells with altered, but low-grade, interiors referred to
as “barren” cores, to inverted cups around barren cores, to
multiple domes or inverted cups, and to vertically elongate,
elliptical shapes.
The vertical extent of hypogene copper ore in porphyry
copper deposits is generally less than or equal to 1 to 1.5 km.
Because copper-mineralized rock can continue several kilo-
meters deeper, the base of ore is dependent on copper grade,
the price of copper, mining costs, and mine design. In some
deposits, the base of ore represents the limits of drilling. The
vertical extent of supergene enriched copper ore varies consid-
erably, depending on many factors, but seldom exceeds 200 m
(see fig. J1).
The total volume of rock affected by heat and(or) fluid
flow related to porphyry copper systems commonly is much
greater than estimated from the areas of ore zones or visibly
altered rock. Volumes of altered rock may extend 10 km or
farther outward from the center of porphyry copper miner-
alization and to depths as much as 10 km below the paleo-
surface (see fig. E4). Distal signatures of porphyry copper
deposits include thermal effects in wall rocks reflected by
reset fission-track ages, conodont color alteration indices, and
bitumen reflectance, dispersion of “pathfinder” elements such
as arsenic, antimony, and mercury along fractures and veins,
and δ18
O depletion. Distal signatures may extend 10 km or
more away from the center of porphyry mineralization along
structures.
Summary of Porphyry Copper Deposit Model    3
Geophysical Characteristics
Modern geophysical methods are widely used in the
exploration for and characterization of porphyry copper depos-
its (see figs. R1A,B). Regional-scale aeromagnetic, seismic,
gravity, and remote-sensing techniques provide insights into
the broad crustal structure and magmatic framework that hosts
mineralization, whereas deposit-scale aeromagnetic, ground-
magnetic, and electromagnetic studies help to characterize
mineralization in three dimensions.
The very nature of porphyry copper system evolution
concentrates minerals of diverse geophysical properties near
the topographic surface. To first order, alteration associated
with porphyry copper deposition occurs in zones, causing
predictable spatial patterns of magnetic properties. High-
resolution aeromagnetic and ground-based magnetic surveys
can map these zones, thus providing useful exploration tools at
deposit scales. Iron and copper sulfides (pyrite, chalcopyrite,
chalcocite, and bornite) are distributed throughout most ore
and alteration zones. Such minerals typically have low resis-
tivities detectable with modern electrical and electromagnetic
methods. In particular, the dispersed nature of sulfide minerals
in porphyry systems is well suited for induced polarization
methods, which measure the chargeability of crustal materi-
als. Sophisticated inverse methods applied to electrical and
electromagnetic data can help define the three-dimensional
framework of porphyry copper deposits. Seismic-reflection
and seismic-tomographic methods provide three-dimensional
views of seismic velocity, sometimes useful in identifying
lithologies surrounding and capping porphyry copper depos-
its. Depending on the contrast in density between pluton and
host rock, gravity anomalies can help locate and characterize
plutons genetically associated with porphyry copper systems.
Geophysical interpretations are inherently nonunique, and
geology is always complicated. Interpretations must be
constrained by independent geologic information, including
geologic mapping, multiple geophysical datasets, and subsur-
face lithologic and mineralogic information.
In areas of good exposure with limited vegetation,
remote sensing by airborne and spaceborne multispectral and
hyperspectral imaging systems can be used to map alteration
mineral associations and their spatial relationships in porphyry
copper systems. In particular, hydrothermal minerals charac-
teristic of sericitic, intermediate and advanced argillic, and
propylitic alteration, iron oxides and hydroxides, and silica can
be remotely mapped using their distinctive absorption features
in the visible near-infrared through short-wave infrared and
thermal infrared wavelengths.
Hypogene Ore Characteristics
Ore in porphyry copper deposits is rock in which
the concentration, value, location, and recoverability of
copper and molybdenum, and in some deposits gold, enable
mining under predetermined economic requirements. The
predominant copper minerals in hypogene ore are chalco­
pyrite, which occurs in nearly all deposits, and bornite, found
in about 75 percent of deposits. The only molybdenum mineral
of significance, molybdenite, occurs in about 70 percent
of deposits. Gold and silver, co-products or by-products in
about 30 percent of deposits, are thought to reside in bornite
and chalcopyrite; and by-product rhenium is derived from
molybdenite. Other hypogene minerals that commonly occur
with copper and molybdenum minerals are quartz, pyrite,
sericite (muscovite; potassium mica), chlorite, epidote, biotite,
potassium feldspar, magnetite, and anhydrite. In some PCDs,
hypogene ore includes the copper minerals, tennantite/tetra­
hedrite, enargite, and covellite, which occur with quartz,
pyrite, sericite, kaolinite, alunite, and pyrophyllite in sericitic
and advanced argillic alteration zones.
Hypogene copper and molybdenum minerals account
for 1–2 volume percent of hypogene ore and occur in several
forms: (1) disseminated in host rocks as discrete, less than or
equal to 1-mm anhedral to subhedral crystals that replace feld-
spars and other minerals internally and along grain boundaries
or in millimeter-to-centimeter clotlike aggregates with hydro-
thermal biotite and other silicate, sulfate, and oxide miner-
als; (2) in veins, less than 1 millimeter to several centimeters
wide, with micrometer to millimeter quartz, pyrite and other
hypogene minerals; vein aspect varies from sharply planar
veins that are continuous for meters to curvilinear, diffusely
margined and discontinuous veins that pinchout within
centimeters; and (3) in breccia matrices with quartz and other
hypogene minerals, sometimes in millimeter-to-centimeter
subhedrons and euhedrons; breccia clasts and matrices vary
greatly in aspect, dimension and composition. Copper, molyb-
denum, and other hypogene minerals in these three forms are
part of the zoned alteration mineral assemblages superimposed
on intrusions and wall rocks.
Copper grades vary from several tenths of 1 percent to
greater than 1 weight percent; in 2008 the average grade was
0.44 percent. In production compilations, hypogene and super-
gene copper (see next section) grades are not routinely sepa-
rated. Supergene copper sulfide grades are usually higher than
hypogene copper grades because of enrichment, but supergene
oxide (see next section) ore grades are both higher and lower
than hypogene copper grades. The decline in average copper
grade from 0.49 percent in 2002 to 0.44 percent in 2008 likely
reflects smaller mined tonnages of supergene ore, mining of
lower grade ores of both ore types because of increased copper
prices and improved mining efficiencies, and increased mining
of lower grade copper oxide ores from which copper is rela-
tively cheaply recovered by leaching. Thus, an average hypo-
gene grade for PCDs cannot be determined from commonly
available production statistics.
Molybdenum grades vary from less than 0.001 to
0.1 percent; the average molybdenum grade in 2002,
0.018 percent, can be considered average hypogene molyb-
denum grade because molybdenum is not significantly
enriched by supergene processes. The average grade in 2002
of gold and silver in deposits in which gold and silver were
4   Porphyry Copper Deposit Model
recovered was 0.16 gram per ton (g/t) and 2.67 g/t, respec-
tively, and grade ranges were 0 to 0.65 g gold/t and 0 to about
10 g silver/t. There are no published data that distinguish
hypogene and supergene grades of silver and gold.
Supergene Ore Characteristics
Supergene ore contains minable copper minerals and a
large number of other minerals precipitated from descending,
low-pH groundwater that dissolved hypogene copper minerals
and redeposited copper in minerals stable in low-temperature,
oxidizing environments. Numerous dissolution-precipitation
cycles lead to reconcentration of copper in subjacent, later-
ally extensive deposits known as supergene oxide deposits
and chalcocite enrichment blankets or enriched copper sulfide
zones, and less commonly in distal concentrations known as
exotic oxide deposits (see fig. J1). The overlying porous rock
from which hypogene copper minerals and other rock compo-
nents were removed during enrichment is called leached
capping. Weathering and enrichment of PCDs is controlled by
many factors, including the presence of thick hypogene ore
zones; permeability provided by faults, fractures, and stock-
work veins; configuration and mineralogy of hypogene altera-
tion zones, especially pyrite/copper sulfide and acid-buffering
capacity; erosion and oxidation rates (climate), tectonism,
topography, and time.
Supergene copper oxide ore zones are tens to several
hundred meters thick, and consist of tens to several hundred
megatons at 0.3 to greater than 1 percent copper. Exotic
oxide ore zones are tens to several hundred megatons at 0.3
to greater than 1 percent copper. Enriched copper sulfide ore
zones are mostly tens to several hundred meters thick and
consist of tens of megatons to greater than 1.5 gigatons at 0.4
to 1.7 percent copper. Enriched copper sulfide ores are invari-
ably higher grade than underlying hypogene ore or copper-
mineralized rock, whereas grades of copper oxide ore zones
are both lower and higher than grades of hypogene sources.
Relatively low cost recovery of copper from oxide minerals by
acid dissolution and precipitation of copper from solution has
enabled processing of low-grade oxide deposits. The thickness
of leached capping is highly variable and ranges from 0 to
several hundred meters in most PCDs.
Common copper minerals in oxide ores include mala-
chite, azurite, cuprite, tenorite, chrysocolla, native copper,
copper wad, and atacamite; numerous other copper carbon-
ate, oxide, silicate, and sulfate minerals are present in small
amounts. These minerals occur as crystalline aggregates and
crystals that fill fractures and line voids in leached capping,
and in micrometer-to-millimeter aggregates that impregnate
alteration and primary minerals in enriched copper sulfide ore,
and less often, in hypogene ore. The complex paragenetic rela-
tionships and disequilibrium mineral associations common in
copper oxide ores reflect changing chemical conditions during
weathering cycles.
Copper in enriched sulfide ore is mostly in sooty to fine-
grained chalcocite; lesser copper is derived from covellite and
Cux
Sy
minerals. Forms and distribution of chalcocite largely
match the forms and distribution of the sulfide minerals (chal-
copyrite and pyrite) in hypogene ore that are replaced by chal-
cocite, either completely or partially (rims, internal fractures).
Ferrimolybdite is the common molybdenum mineral in copper
oxide ores and leached capping; forms (and enrichment) of
gold and silver in PCDs are not well documented.
Hypogene and Supergene Gangue
Characteristics
Porphyry copper ore consists mostly (more than 98 per-
cent) of valueless minerals, or gangue, that are discarded
during processing for recovery of copper, molybdenum, gold,
and silver. Gangue includes primary minerals of host rocks,
hypogene hydrothermal minerals, and supergene minerals that
do not contain recoverable copper and molybdenum. Rock
that contains no copper or molybdenum (100 percent gangue
minerals), or too little copper and molybdenum for processing,
is called waste. Many gangue minerals formed by hypogene
and supergene processes have lower densities than the primary
rock-forming minerals and hypogene hydrothermal minerals
they replace. Lower density gangue minerals, combined with
voids created by mineral dissolution, generally decrease physi-
cal competency of ore and waste and affect mine design.
Hypogene gangue consists of primary rock-forming and
hydrothermal minerals, including plagioclase, potassium feld-
spar, quartz, micas, chlorite, epidote, amphiboles, pyroxenes,
calcite, garnet, aluminum-silicate-sulfate minerals (kaolin-
ite, illite, dickite, alunite, andalusite, and pyrophyllite), and
accessory minerals (iron-titanium oxides, apatite, and zircon).
A large number of other hydrothermal silicate, oxide, sulfate,
phosphate, and carbonate minerals locally constitute hypogene
hydrothermal gangue. The distribution of primary rock-
forming gangue minerals follows the distribution of rock types
that compose PCDs, whereas hypogene hydrothermal gangue
minerals follow the zoning patterns of copper, molybdenum,
and alteration minerals. Although hypogene gangue mineral
textures and grain sizes are largely inherited from host rocks,
primary host-rock textures and grain sizes are invariably modi-
fied by alteration processes to finer grained and often lower
density mineral aggregates.
Supergene gangue consists of primary rock-forming
minerals, hydrothermal minerals, and minerals formed by
weathering including silica phases (chalcedony, opal), kaolin-
ite, illite, montmorillonite, alunite, limonite (goethite, hema-
tite, and jarosite), and manganese oxides. With the exception
of goethite, jarosite, and most manganese oxide minerals,
common hypogene and supergene gangue minerals are the
same species, although illite, kaolinite, and silica minerals
commonly are added and locally replace hypogene minerals.
Gangue mineral origins often can be distinguished by location,
Summary of Porphyry Copper Deposit Model    5
texture, density, mineral associations, and mineral properties
(crystallinity, chemical composition, and isotope composition).
Textures and grain sizes of supergene gangue usually reflect
several cycles of weathering and enrichment. In copper oxide
ore near the surface, supergene gangue consists of low-density
and porous, fine- to very fine grained aggregates of residual
and derivative rock components, mainly silica, kaolinite, and
limonite; such ore is essentially mineralized leached capping.
In supergene-enriched copper sulfide ore beneath oxide ore,
gangue consists of earlier formed supergene minerals and
primary rock-forming minerals, and gangue texture is largely
inherited from host-rock texture.
Ore in PCDs is nearly entirely composed of hypo-
gene and supergene gangue minerals, and the physical
and chemical properties of gangue minerals, coupled with
copper±molybdenum±gold grade, determine feasibility of
mining PCDs. Physical properties, including hardness, fracture
and vein density, and particle-size distribution after blasting
and crushing, determine mining equipment requirements,
ore/waste stripping ratios (pit slopes), blast hole density,
crushing capacity, truck tire replacement frequency, and mill
design. Gangue minerals that react with processing reagents,
generate acid (pyrite), and require sulfur control (all sulfide
minerals) further influence mill design and copper recov-
ery methods. Gangue properties largely control mining and
processing (operating) costs, strongly influence capital costs
and production rates, and ultimately determine the profitability
of producing copper±molybdenum±gold±silver from a PCD.
Compositions and textures of iron oxide minerals (limo-
nite), often components of gangue, are useful in PCD explora-
tion and evaluation because precursor sulfide mineralogy of
leached capping (pyrite, chalcopyrite, chalcocite, enargite) can
be interpreted by the mineralogy (goethite, hematite, jarosite),
color, texture, and origin of residual limonite.
Hydrothermal Alteration
Hydrothermal alteration refers to metasomatic processes
that change the composition, mineralogy, and texture of rocks
that constitute a porphyry copper system. In porphyry envi-
ronments, wall-rock alteration is intimately linked to narrow
veins, commonly 0.1 to 10 cm in width, that typically make
up less than 1 to 5 volume percent of ore but also are present
in other alteration zones. Hydrothermal alteration is character-
ized by ionic metasomatism, including alkali metasomatism
and hydrolytic (or acidic) reactions, oxidation-reduction reac-
tions (including sulfidation), solubility-induced precipitation
reactions, such as quartz precipitation, and hydration-carbon-
ation reactions in which water or carbonate is added.
Several types of wall-rock alteration characterize
porphyry copper ore zones (see fig. E4). These alteration
types extend upward and outward several kilometers from
deposit centers and are spatially and temporally zoned.
Major alteration types commonly present in porphyry copper
deposits are (1) potassic, (2) sericitic, (3) advanced argillic,
(4) intermediate argillic, (5) propylitic, (6) sodic-calcic and
sodic, (7) greisen, and (8) skarn.
Potassic alteration includes replacement and vein
potassium phases, potassium feldspar and biotite; potassium
feldspar addition characteristically is the dominant potassium
mineral in silicic or granitic wall rocks, whereas biotite is the
dominant potassium mineral in intermediate or mafic compo-
sition wall rocks. Sulfide minerals in this alteration include
bornite, chalcopyrite, and(or) pyrite. Magnetite, molybdenite,
anhydrite, and(or) calcite are other common minerals in this
alteration. Potassic alteration is directly associated with abun-
dant stockwork quartz-rich veins, including A veins (quartz-
bornite-chalcopyrite ±magnetite±anhydrite±calcite), B veins
(quartz±copper-iron-sulfides±molybdenite), and transitional
AB veins, but also including veins dominated by biotite,
magnetite, or copper-iron sulfides.
Sericitic alteration forms selvages typically a few centi-
meters wide along structurally controlled “D” veins that lie on
fractures and faults. Where these veins are closely spaced, this
alteration may be pervasive in volumes up to 1 km3
. D veins
are dominated by sulfides and minor to major amounts of
quartz. Sulfides commonly are strongly zoned from central
chalcopyrite-rich veins cutting potassic ore zones upward
or outward to pyrite-chalcopyrite veins to pyrite-dominated
veins. Late veins tend to be pyrite-rich and may occur at all
levels, even below ore zones. Sericitic alteration selvages are
characterized by replacement of all rock minerals by fine-
grained white potassium-mica (sericite) and quartz accompa-
nied by a small percentage of pyrite or specular hematite.
Advanced argillic alteration refers to intense hydrolytic
alteration and alkali-base cation leaching that forms alkali-free
hydrous aluminum silicate minerals (pyrophyllite, dickite,
and kaolinite, in order of decreasing thermal stability), local
andalusite in high-temperature zones, alunite, and a variety of
aluminum, fluorine, and silica-rich minerals, such as topaz,
diaspore, zunyite, corundum, and dumortierite and pyrite.
Quartz-rich zones in which all aluminum is also removed
(residual silica alteration) are common in near-surface zones
that are transitional to epithermal environments. Hypo-
gene sulfides are dominated by pyrite and copper minerals
including enargite, covellite, digenite, and less commonly,
tetrahedrite/tennantite.
Intermediate argillic alteration refers to clay-bearing
assemblages formed by hydrolytic alteration that typically
forms at lower temperature than sericitic alteration and at rela-
tively low pH but at higher pH than advanced argillic altera-
tion at similar temperatures. In this alteration, smectite clay
minerals or kaolinite replace plagioclase, igneous potassium
feldspar is stable, and ferromagnesian minerals are replaced by
chlorite and pyrite.
Propylitic alteration refers to alteration of igneous rocks
by hydration, carbonation, oxidation, and locally sulfida-
tion reactions to form assemblages rich in hydrous minerals
and containing minor carbonate, sulfide and(or) hematite.
Typical assemblages contain epidote, chlorite, or actinolite
and in some cases, pyrite, at higher temperatures and chlorite,
6   Porphyry Copper Deposit Model
illite-sericite, or smectite and in some cases, pyrite, at lower
temperatures as replacements of calcic plagioclase and ferro-
magnesian minerals. Hypogene copper minerals are uncom-
mon in propylitic alteration zones.
Sodic-calcic and sodic alteration refers to strong alkali
alteration in which sodium and commonly calcium minerals
are added and potassium and commonly iron minerals are
destroyed. Characteristic alteration reactions are sodium-rich
plagioclase replacement of potassium feldspar, and Ca-Fe-Mg
mineral replacement of potassium-mica. Sodic-plagioclase,
actinolite, epidote, chlorite, and titanite are typical added
minerals. Calcic-pyroxene, calcic-plagioclase and local
Ca-Al-Fe garnet may form at high temperatures (greater
than 450°C).
Greisen refers to vein-selvage pairs with macro-
scopically crystalline hydrothermal muscovite. Greisen
consists of veins containing muscovite, quartz, and minor
sulfides (pyrite greater than chalcopyrite) with potassium
feldspar-muscovite selvages.
Skarn refers to Ca-Fe-Mg silicate minerals that have
replaced carbonate and other wall rocks. Magnesium silicate
minerals are dominant in dolomitic protoliths, and calcium-
iron silicate minerals are dominant in limestone protoliths
that most commonly host to PCD ores. Early anhydrous skarn
typically consists of carbonate minerals replaced by garnet
and calcium-rich pyroxene. Later actinolite is characteristic of
hydrous skarn assemblages that overprint anhydrous skarn and
commonly are associated with chalcopyrite-pyrite, magnetite,
and ore formation.
Hydrothermal alteration minerals and assemblages are
zoned spatially and temporally (see fig. E4). Hydrothermal
alteration zones have kilometer-scale vertical and lateral
dimensions that show significant variation in geometry, largely
as a function of rock composition, depth, and orientation
of more permeable zones, such as hydrofractured rock and
porphyry dikes. Most notably, potassic and sericitic altera-
tion are invariably associated with sulfide mineralization in
PCDs and generally are temporally, spatially, and thermally
zoned with respect to one another. Potassic alteration tends
to be more centrally located, deeper, higher temperature, and
earlier compared to sericitic alteration. Advanced argillic and
sericitic alteration are commonly zonally arranged around
fluid flow conduits, but advanced argillic and intermedi-
ate argillic alteration assemblages may be adjacent to one
another in the low-temperature and near-surface epithermal
quartz-alunite environment overlying some porphyry systems.
Advanced argillic alteration generally overlies potassic and
sericitic alteration zones. Greisen forms sets of sheeted veins
in the deep root zones of some porphyry copper systems that
are formed from silicic, hornblende-poor granites. Sodic-calcic
and sodic alteration form at deep levels and along the sides of
some PCDs. Propylitic alteration in porphyry copper systems
generally forms at shallow to moderate depths peripheral
to central zones of advanced argillic, sericitic, and potassic
alteration; propylitic zones may grade downward into deeper
zones of sodic-calcic and sodic alteration.
Geochemical Characteristics
Geochemical characteristics of porphyry copper deposits
result from a large number of physical and chemical processes,
including magma generation, differentiation, emplacement,
and degassing, high-temperature reactions between degassed
fluids, crystallized intrusions, wall rocks, and meteoric and
other nonmagmatic water, and near-surface reactions between
low-temperature meteoric water and earlier formed, high-
temperature minerals. Description of geochemical character-
istics can be categorized by the type of material analyzed and
analytic strategy; characteristics include lithochemistry of host
rocks, minor-element zoning patterns, mineral compositions,
and fluid compositions.
Major oxide and minor element compositions of
premineralization, mineralized, and postmineralization rocks
have been collected mainly by mining companies for explora-
tion and mining applications. Applications include discrimina-
tion of altered from unaltered host rocks by mass gains and
losses and distinguishing mineralized from unmineralized
intrusions (see fig. M1).
The spatial distribution of copper, molybdenum,
silver, and gold, has been routinely determined at porphyry
copper±molybdenum±gold mines for grade control and mine
planning. Abundances of these and other minor elements in
rocks, soils, and sediments also have been routinely used in
exploring for PCDs (see fig. M3B). More recently, minor-
element and isotope analyses of water (surface and subsur-
face), gases, and floras have become common components of
geochemical exploration programs.
The chemical and isotope compositions of hydrous
igneous and hydrothermal minerals in PCDs, including
biotite, chlorite, epidote, feldspar, amphibole, potassium-mica,
and sulfide minerals, have been evaluated for discrimina-
tion between mineralized and unmineralized intrusions, for
quantification of magmatic variables (temperature, oxidation
state, fugacities of H2
O, HCl, HF, H2
), and to define gradients
outward from the central potassic alteration zones, although
few data for minerals other than biotite have been published.
The physical properties and compositions of hydrother-
mal fluids that formed PCDs have been directly determined by
petrography, microthermometry, and analysis of fluid inclu-
sions and indirectly determined by thermodynamic modeling
of equilibrium reactions between hydrous fluids and igneous
and hydrothermal mineral assemblages that make up PCDs.
Fluid inclusion assemblages, or groups of coeval and unmodi-
fied inclusions that represent a single fluid, have been used, in
conjunction with alteration assemblages, to interpret processes
that form PCDs, including temperatures, pressures, and
compositions of ore and alteration fluids, and partitioning of
metals and solutes between fluid phases, usually aqueous fluid
or brine and water vapor (plus important but variable amounts
of CO2
, CH4
, SO2
, H2
S, H2
, and other volatiles).
Qualitative determination of the major components,
relative ages, and evolution of fluids that formed PCDs,
including identification of daughter minerals and some gases,
Summary of Porphyry Copper Deposit Model    7
paragenesis of fluid inclusion populations, and recognition
of constant or variable phase ratios within populations, can
be determined solely by petrographic examination of fluid
inclusions in hydrothermal and igneous minerals. Quantitative
minor-element compositions of fluids that formed PCDs have
been derived entirely from analyses of fluid inclusions, which
requires fairly advanced instrumentation. These minor-element
analyses show that (1) early magmatic fluids contain elevated
concentrations of metals, including Cu, Fe, Zn, Pb, and Mn,
and (2) although phase separation during or after volatile
exsolution from magma can cause concentration of copper,
gold, arsenic, and sulfur into low-density vapor, metal trans-
port by aqueous liquid or brine is also effective in concentrat-
ing copper in deposits.
Stable isotope compositions of waters that form PCDs
have been determined directly from fluids extracted from
inclusions by crushing or thermal decrepitation of host miner-
als in a vacuum (hydrogen, reported as δD in per mil), and
from host minerals (hydrogen and oxygen, reported as δ18
O
in per mil, corrected for temperature fractionation). Stable
isotope compositions indicate multiple water sources in addi-
tion to time-space variations in water composition. In general,
early potassic alteration and some sericitic (muscovite;
potassium-mica) alteration are characterized by water isotope
compositions similar to magmatic water. Other sericitic and
argillic and advanced argillic (kaolinite, dickite, alunite, pyro-
phyllite) alteration waters have δD and δ18
O isotope values
that are nearer to the meteoric water line or lower δ18
O isotope
values that reflect mixtures of magmatic and meteoric water
involved in alteration processes.
Sulfur isotope compositions of fluids that deposited
sulfide and sulfate minerals in porphyry copper systems
comprise a large range because (1) the bulk sulfur isotopic
composition of porphyry magmas varies considerably as a
result of diverse sources of sulfur, brine-vapor immiscibility,
and loss of sulfur during magma ascent; (2) variations in δ34
S
values due to the oxidation state of the fluid, which is largely
determined by H2
S/SO4
2–
, and temperature; and (3) fraction-
ation between simultaneously precipitating sulfide and sulfate
minerals that can exceed 20 per mil at PCD temperatures.
Analyses of coexisting pyrite-anhydrite and pyrite-alunite
pairs from several PCDs suggest deposition from relatively
oxidizing fluids with H2
S/SO4
2–
less than 0.5 to 1 and with
variable δ34
SΣS
values (about +1 to +10 per mil).
Petrology of Associated Igneous Rocks
Porphyry copper deposits are centered in high-level
intrusive complexes that commonly include stocks, dikes,
and breccia pipes. Many deposits are focused in swarms of
porphyry dikes that may radiate from larger intrusions or
batholiths (see fig. E4). The deposits are formed at shallow
(mostly 6 km or less) depth by fluids exsolved from under­
lying crystallizing magmas emplaced at greater than 3–10-km
depth in the upper crust and by external waters heated by those
magmas. Many known deposits are genetically related to inter-
mediate to felsic calc-alkaline magmas in volcano-plutonic
arcs formed above active subduction zones. These shallow,
subvolcanic complexes typically are composed of multiple
intrusions of varying composition. Porphyry copper miner-
alization commonly forms near the end of magmatic cycles,
and mineralized volcanic wall rocks may be significantly older
than the ages of the intrusive rocks and ore.
Igneous rocks in porphyry copper deposits range from
volcanic rocks through hypabyssal intrusions, including
porphyry dikes, breccias, and small stocks, to coarse-grained
plutons and batholiths. Plutons and batholiths hosting ore
in many districts are older and unrelated to the ore-forming
system but may be part of long-lived (millions to more than
10 m.y.) magmatic successions. In other districts, the plutons
and batholiths are only slightly older (hundreds of thousands
of years) and range from multiple large stocks to compos-
ite batholiths. The upper parts of intrusions range in shape
from cylindrical to broadly domal. Dike abundances vary
from a few isolated dikes forming less than one percent of
the rocks exposed in ore zones to dike swarms that host most
ore. Multiple sets of porphyry dikes commonly are present in
porphyry copper systems, and different sets of porphyry dikes
may be pre-, syn-, and(or) post-ore. In tilted systems and in
some well-exposed upright systems, successive generations of
porphyry dikes emanate from successively deeper levels of the
underlying pluton.
Textures of igneous rocks in porphyry copper deposits
range from fine-grained porphyro-aphanitic to coarse-grained
equigranular. Nearly all deposits contain exposures of
“porphyry,” which is a strongly porphyritic hypabyssal intru-
sive rock with a characteristic aplitic quartz-feldspar ground-
mass (crystal sizes 0.02 to 0.3 mm). The aplitic groundmass
is interpreted as a quench texture resulting from rapid ascent
and loss of volatiles from the magma. Porphyry intrusions
typically contain 35–55 percent fine- to medium-grained
phenocrysts. The groundmass grain size tends to coarsen
with increasing depth and grades to seriate and eventually
hypidiomorphic-granular or granitic texture.
Intrusive, intrusion, and tectonic breccias are present in
most porphyry copper systems. There are wide ranges in the
composition of the breccia matrix and fragments and in the
dimensions and geometry of these breccias that reflect their
variable origins. Some breccias are cemented by hydrothermal
minerals including copper sulfide minerals and can form high-
grade ore, whereas many igneous breccias are barren and may
dilute hypogene ore grades unless they contain older mineral-
ized clasts.
A wide variety of igneous rock types and compositions
are spatially associated with, or host, porphyry copper depos-
its. Quartz monzonite, diorite, granodiorite, dacite, andesite,
quartz diorite, and monzonite are the most commonly reported
rock types. Porphyry intrusions associated with most porphyry
copper deposits contain plagioclase phenocrysts; hornblende
and biotite are common in intermediate composition intru-
sions; clinopyroxene ± orthopyroxene is present in some
8   Porphyry Copper Deposit Model
more mafic composition intrusions, and in alkalic intrusions;
and biotite, potassium feldspar, and quartz are common in
intrusions with more silicic compositions. Common primary
accessory minerals are magnetite, ilmenite and(or) titanite,
apatite, and zircon. Magmatic anhydrite has been reported in
some deposits.
Chemical analyses of the least altered rocks in porphyry
copper deposits also indicate a wide range of rock compo-
sitions. PCDs are associated with multiphase, shallowly
emplaced, and moderately evolved granitic rocks (as shown
by moderate silica contents and high potassium/rubidium and
rubidium/strontium). The mineralizing stocks are oxidized
(high whole-rock values of Fe2
O3
/FeO) magnetite-series rocks,
and most contain magnetite and titanite. Porphyry copper
deposits related to calc-alkaline magmas are enriched in large
ion lithophile and fluid-mobile elements (for example, Cs, Rb,
Ba, U, K, Pb, and Sr) and are relatively depleted in Nb, Ta, P,
and Ti compared to primitive mantle. They also are commonly
depleted in manganese and thorium. Mineralized intrusions
have highly fractionated rare earth element (REE) patterns,
commonly with heavy rare earth element (HREE) and yttrium
depletions relative to barren intrusions. Mineralized intru-
sions commonly have high lanthanum/ytterbium (40–60), high
strontium/yttrium (mostly greater than 20), and chondrite-
normalized REE patterns that have small negative or positive
europium anomalies. Many of the minor-element and REE
compositional features are similar to those of adakites.
Radiogenic isotope compositions (Pb-Nd-Sr-Hf-Os) of
rocks that make up porphyry copper systems have wide varia-
tions. There is a correlation of many porphyry copper magmas
with isotopic and chemical compositions similar to adakite,
and there is an inferred association of many of these magmas
to ridge subduction processes. A wide range of lithologic
sources is capable of explaining the observed compositional
features, including Mid-Ocean Ridge Basalt (MORB), basaltic
oceanic crust, lower crust, delaminated mantle, metasomatized
mantle peridotite, and metasomatized lithosphere, and there is
multiplicity of inferred tectonic environments that also enlarge
the potential sources of porphyry copper system components.
The radiogenic isotope data imply that a wide range of contri-
butions from normal and enriched mantle, oceanic crust, and
crust are involved with porphyry copper metallogenesis.
Theory of Ore Deposit Genesis
Geologic and geochemical evidence demonstrates that
porphyry copper systems are predominantly formed by
magmatic fluids that are released during shallow emplacement
of porphyritic granitoid stocks. Formation of porphyry copper
deposits involves a complex series of processes including
magma generation, differentiation, emplacement, crystal-
lization and degassing, high-temperature reactions between
degassed fluids, crystallized intrusions, wall rocks, and mete-
oric and other nonmagmatic waters, and near-surface reactions
between low-temperature meteoric water and earlier-formed,
high-temperature minerals.
Sources of Fluids
Geologic studies have long established an intimate
relationship between intrusions and zoned, high-temperature
vein and alteration mineral assemblages in intrusive and
adjacent wall rocks that imply magmatic sources of intro-
duced components of PCDs (metals, water, sulfur, chlorine).
Similarly, isotopic, fluid inclusion, and melt inclusion studies
indicate mostly a magmatic origin for high-temperature fluids
that are released during inward crystallization of shallowly
emplaced intrusions (second boiling). The formation of many
porphyry copper systems involves mixtures of magmatic
fluids and nonmagmatic external fluids, although the latter are
mostly involved in the waning stages of hydrothermal activ-
ity when lower temperatures and hydrostatic pressure allow
incursion of external water. External saline waters (sedimen-
tary brines) were involved in the earlier stages of evolution
of some porphyry copper systems, resulting in sodic and
sodic-calcic alteration.
Controls on Permeability and Fluid Flow
The upper 10 km of continental crust commonly contains
groundwater under hydrostatic pressure conditions, in contrast
to magma bodies that supply magmatic-hydrothermal fluids
to porphyry copper systems at lithostatic pressures. In this
environment, mafic magma injection, buoyancy of magmatic-
hydrothermal fluids in cupolas of crystallizing magmas, or
far-field tectonic stress may produce high strain rates that
cause the ductile carapace of the magma chamber to brittlely
fracture. Fractures produced by the magmatic-hydrothermal
fluid dictate that virtually all magmatic-hydrothermal fluid
flows from lithostatic to near-hydrostatic pressure conditions
except after fracture sealing by vein minerals. Nonmagmatic
fluids are hydrostatically pressured. Fractures typically are
dominated by a single strike direction with a vertical dip
where far-field tectonic stress fields are dominant, but in
some cases, steep radial and shallow concentric fractures are
present. These fractures produce parallel or so-called sheeted
vein sets and the subparallel porphyry dike orientations typical
of most porphyry copper deposits. Where such sheeted frac-
tures are dominant, they can extend great distances (more than
5 km) laterally, as well as vertically from the source cupola.
They may host porphyry dikes and be hydrothermally altered
and provide fluid pathways for entry of external nonmagmatic
fluids into the outer part of the hydrothermal system that cause
sodic-calcic alteration.
Permeability in the column of rock from the cupola to
the surface can be maintained as long as temperature/pressure
gradients cause magmatic-hydrothermal fluids to ascend from
the cupola. When these fluids cease to flow, fracture perme-
ability decreases by precipitation of minerals, predominantly
Summary of Porphyry Copper Deposit Model    9
quartz, in fractures to form veins. Abundant A and B type
quartz veins are precipitated from depressurized and cooled
hydrothermal fluids at about 700° to 500°C, but retrograde
quartz solubility in the temperature range of 350° to 500°C
typically leads to local cycles of local dissolution and precipi-
tation, so that fractures do not seal between 500° and 350°C.
Chemical Transport and Transfer Processes
Fluid-phase separation from porphyry copper magmas
fractionates water, metals, sulfur and other volatiles from the
crystallizing magma. In a few shallow porphyry plutons (less
than 5-km depth), separate brine-rich and vapor-rich fluids
may directly separate from magma. In most cases, fluids
derived from magma at more than 1.4-kilobar pressure (greater
than 5-km depth) are a single, supercritical phase and have
moderate to low salinities (about 3–5 weight percent). With
declining pressure, single-phase fluids separate into high-salin-
ity brine and lower salinity vapor phases. Aqueous brines were
thought to be the main agent of metal transport in porphyry
copper deposits based on their abundance in fluid inclusions
and their high metal contents and transport capacity. Recent
studies of fluid inclusion compositions have demonstrated that
low-density fluids perform an important function in transport
of copper, gold, and sulfur, but that the subordinate mass of
brine is also a key to transport of these components, as well as
Fe, alkalis, W, Mo, Ag, Pb, and Zn. The relative importance
of these two coexisting magmatic fluids in the transport and
deposition of ore components is a topic of ongoing research
and debate. In some cases, where evidence for separate brine
and vapor is rare, moderate- to low-density magmatic fluids
formed PCDs (including the giant Butte PCD in Montana).
Because the formation of porphyry deposits involves
considerable volumes of fluid, a focusing mechanism is
required. Most workers conclude that fluid flow foci are the
apices (cupolas) of magma chambers, although apices seldom
coincide with central volcanic structures where these struc-
tures are present.
Heat-Transfer Processes
In porphyry copper systems, both conduction and advec-
tion redistribute the heat that is introduced with magmas. Most
magmatic heat lost by conduction causes widespread, rela-
tively uniformly distributed contact metamorphism. Magmatic
heat is advectively transferred by aqueous fluids expelled
from magma chambers and, if permeability is sufficient, by
external fluids circulated by convection into thermal haloes
of magmas. The amount of heat redistributed by fluids is
generally subordinate to conductive heat transport. Advective
redistribution of heat becomes dominant only in areas of high
and sustained fluid flux, notably in upwelling zones over the
tops or edges of intrusions or in highly permeable zones. The
principal evidence for advective heat transport comes from
the large volumes of high-temperature hydrothermal alteration
assemblages in and around intrusions and by the presence
of veins. This alteration-centered pattern is expected, given
the focused distribution of permeability due to fracturing by
magmatic fluids.
Pressure Gradients
Pressures vary greatly during the formation of porphyry
systems, both in host rocks and in ore-forming fluids. Pres-
sures during the evolution of porphyry copper systems are
governed by the interplay between (1) lithostatic gradients,
reflecting the weight of overlying rocks; (2) hydrostatic
gradients in hydrologic systems open to the surface; and
(3) dynamic contributions related to magma emplacement,
fluid release, and evolving thermal structure and permeabil-
ity. Fluid pressures are near lithostatic values in the vicinity
of magma chambers and decrease to near hydrostatic values
above and lateral to the locus of magmatism in areas of lower
temperature. Magmatic volatile separation (second boiling)
releases considerable mechanical energy because of the large
increase in total volume of the system. This energy release
creates overpressures that commonly lead to brittle failure
(hydrofracturing) of the wall rocks and, at high strain rates, the
magmas themselves. Fluid pressure gradients vary markedly
in orientation, and these pressure gradients drive fluid flow.
Wall-Rock Reaction and Ore-Mineral Deposition
Processes
Copper-iron sulfide mineral precipitation is largely
governed by temperature, availability of sulfur, and pH.
The reaction, Cu+
+ Fe2+
+ 2H2
S + 0.25O2
= CuFeS2
+ 3H+
+ 0.5H2
O, can be used to understand distribution of copper-
iron sulfides. First, low-pH (acidic) conditions tend to keep
copper in solution. In low-pH fluids that produce sericitic and
advanced argillic alteration, temperatures at which chalco­
pyrite or other copper-iron sulfide minerals are precipitated
are depressed with respect to the more neutral environment of
potassic alteration. Second, decomposition of ferromagnesian
minerals in wall rocks by fluid, such as hydrothermal biotite
replacement of igneous hornblende in potassic alteration, both
increases pH and supplies Fe2+
to the fluid, thereby resulting
in precipitation of chalcopyrite. Third, at high temperatures,
oxidized magmatic-hydrothermal fluids have SO2
contents
greater than H2
S contents. As the magmatic-hydrothermal fluid
cools below 400°C, SO2
disproportionates by reaction with
water to form sulfuric acid and H2
S, and H2
S combines with
aqueous metal species to form copper-iron sulfide minerals.
Gold is likely transported as a bisulfide or other sulfur
complex, and where sulfur is removed from the hydrother-
mal fluid during copper-iron sulfide and pyrite precipitation,
gold is also precipitated, usually as solid solution in bornite
or chalcopyrite. Molybdenum likely is transported as molyb-
denum hydroxide complex at high temperature. High fluid
Porphyry Copper Deposit Model

More Related Content

What's hot

Economic geology - Genetic classification of ores
Economic geology - Genetic classification of oresEconomic geology - Genetic classification of ores
Economic geology - Genetic classification of oresAbdelMonem Soltan
 
porphyry Cu-Mo.ppt
porphyry Cu-Mo.pptporphyry Cu-Mo.ppt
porphyry Cu-Mo.pptssuserdf29f0
 
Economic geology - Sedimentary ore deposits
Economic geology - Sedimentary ore depositsEconomic geology - Sedimentary ore deposits
Economic geology - Sedimentary ore depositsAbdelMonem Soltan
 
Bauxite types, mineralogy, Indian occurrences
Bauxite types, mineralogy, Indian occurrencesBauxite types, mineralogy, Indian occurrences
Bauxite types, mineralogy, Indian occurrencesPramoda Raj
 
Geothermometry in economic geology
 Geothermometry in economic geology Geothermometry in economic geology
Geothermometry in economic geologyThomas Chinnappan
 
Application of fluid inclusion
Application of fluid inclusionApplication of fluid inclusion
Application of fluid inclusionSwapnil Pal
 
COAL MICROLITHOTYPES AND THEIR USAGE IN INTERPRETING DEPOSITION ENVIRONMENT
COAL MICROLITHOTYPES AND THEIR USAGE IN INTERPRETING DEPOSITION ENVIRONMENTCOAL MICROLITHOTYPES AND THEIR USAGE IN INTERPRETING DEPOSITION ENVIRONMENT
COAL MICROLITHOTYPES AND THEIR USAGE IN INTERPRETING DEPOSITION ENVIRONMENTOlusegun Ayobami Olatinpo
 
skarn deposits and their mode of formation
skarn deposits and their mode of formationskarn deposits and their mode of formation
skarn deposits and their mode of formationAdam Mbedzi
 
Ore deposits (contact metamorphism)
Ore deposits (contact metamorphism)Ore deposits (contact metamorphism)
Ore deposits (contact metamorphism)knowledge
 
Ch 19 continental alkaline lecture
Ch 19 continental alkaline lectureCh 19 continental alkaline lecture
Ch 19 continental alkaline lectureRaghav Gadgil
 
Oxidation supergene enrichment
Oxidation supergene enrichmentOxidation supergene enrichment
Oxidation supergene enrichmentVishnu Raayan
 

What's hot (20)

Economic geology - Genetic classification of ores
Economic geology - Genetic classification of oresEconomic geology - Genetic classification of ores
Economic geology - Genetic classification of ores
 
Komatiite
KomatiiteKomatiite
Komatiite
 
porphyry Cu-Mo.ppt
porphyry Cu-Mo.pptporphyry Cu-Mo.ppt
porphyry Cu-Mo.ppt
 
Economic geology - Sedimentary ore deposits
Economic geology - Sedimentary ore depositsEconomic geology - Sedimentary ore deposits
Economic geology - Sedimentary ore deposits
 
Bauxite types, mineralogy, Indian occurrences
Bauxite types, mineralogy, Indian occurrencesBauxite types, mineralogy, Indian occurrences
Bauxite types, mineralogy, Indian occurrences
 
Ophiolite
OphioliteOphiolite
Ophiolite
 
Topic 1-Concepts of an ore deposit
Topic 1-Concepts of an ore depositTopic 1-Concepts of an ore deposit
Topic 1-Concepts of an ore deposit
 
Geothermometry in economic geology
 Geothermometry in economic geology Geothermometry in economic geology
Geothermometry in economic geology
 
Sٍedimentary manganes and iron ore deposits
Sٍedimentary manganes and iron ore depositsSٍedimentary manganes and iron ore deposits
Sٍedimentary manganes and iron ore deposits
 
Fluid inclusion in ores
Fluid inclusion in oresFluid inclusion in ores
Fluid inclusion in ores
 
Application of fluid inclusion
Application of fluid inclusionApplication of fluid inclusion
Application of fluid inclusion
 
Lamprophyre
LamprophyreLamprophyre
Lamprophyre
 
Porphyry deposits.ppt
Porphyry deposits.pptPorphyry deposits.ppt
Porphyry deposits.ppt
 
COAL MICROLITHOTYPES AND THEIR USAGE IN INTERPRETING DEPOSITION ENVIRONMENT
COAL MICROLITHOTYPES AND THEIR USAGE IN INTERPRETING DEPOSITION ENVIRONMENTCOAL MICROLITHOTYPES AND THEIR USAGE IN INTERPRETING DEPOSITION ENVIRONMENT
COAL MICROLITHOTYPES AND THEIR USAGE IN INTERPRETING DEPOSITION ENVIRONMENT
 
Topic 9 supergene enrichment
Topic 9 supergene enrichmentTopic 9 supergene enrichment
Topic 9 supergene enrichment
 
skarn deposits and their mode of formation
skarn deposits and their mode of formationskarn deposits and their mode of formation
skarn deposits and their mode of formation
 
Fe-deposits
Fe-depositsFe-deposits
Fe-deposits
 
Ore deposits (contact metamorphism)
Ore deposits (contact metamorphism)Ore deposits (contact metamorphism)
Ore deposits (contact metamorphism)
 
Ch 19 continental alkaline lecture
Ch 19 continental alkaline lectureCh 19 continental alkaline lecture
Ch 19 continental alkaline lecture
 
Oxidation supergene enrichment
Oxidation supergene enrichmentOxidation supergene enrichment
Oxidation supergene enrichment
 

Viewers also liked

Characteristics of porphyry copper deposits
Characteristics of porphyry copper depositsCharacteristics of porphyry copper deposits
Characteristics of porphyry copper depositsPablo Molina Jiménez
 
Cu porphyry
Cu porphyryCu porphyry
Cu porphyrypxyane
 
From old mine map to exploration target using 3D. Hein Raat, Boliden
From old mine map to exploration target using 3D. Hein Raat, BolidenFrom old mine map to exploration target using 3D. Hein Raat, Boliden
From old mine map to exploration target using 3D. Hein Raat, BolidenGeological Survey of Sweden
 
Reservoir Minerals Presentation - October 2012
Reservoir Minerals Presentation - October 2012Reservoir Minerals Presentation - October 2012
Reservoir Minerals Presentation - October 2012reservoirminerals
 
Navarre Minerals | ASX:NML | RIS2014 Broken Hill Investor Presentation
Navarre Minerals | ASX:NML | RIS2014 Broken Hill Investor PresentationNavarre Minerals | ASX:NML | RIS2014 Broken Hill Investor Presentation
Navarre Minerals | ASX:NML | RIS2014 Broken Hill Investor PresentationSymposium
 
PDAC 2016 presentation by Martini, Carey, & Witter
PDAC 2016 presentation by Martini, Carey, & WitterPDAC 2016 presentation by Martini, Carey, & Witter
PDAC 2016 presentation by Martini, Carey, & WitterJeff Witter
 
Massive sulfides
Massive sulfidesMassive sulfides
Massive sulfidesshuti1922
 
160603 corporate presentation
160603 corporate presentation160603 corporate presentation
160603 corporate presentationreservoirminerals
 
The Tectonic and Metallogenic Framework of Myanmar: A Tethyan mineral system
The Tectonic and Metallogenic Framework of Myanmar: A Tethyan mineral systemThe Tectonic and Metallogenic Framework of Myanmar: A Tethyan mineral system
The Tectonic and Metallogenic Framework of Myanmar: A Tethyan mineral systemMYO AUNG Myanmar
 
Mining Geology and Exploration | Rodger Allen Gold Mine
 Mining Geology and Exploration | Rodger Allen Gold Mine Mining Geology and Exploration | Rodger Allen Gold Mine
Mining Geology and Exploration | Rodger Allen Gold Mine1510501 Alberta Ltd
 
Economic geology - Magmatic ore deposits_1
Economic geology - Magmatic ore deposits_1Economic geology - Magmatic ore deposits_1
Economic geology - Magmatic ore deposits_1AbdelMonem Soltan
 
Presentation On Ophiolites
Presentation On OphiolitesPresentation On Ophiolites
Presentation On Ophioliteshafizshahid
 
Application of hyperspectral data for assessing 3D lithological and alteratio...
Application of hyperspectral data for assessing 3D lithological and alteratio...Application of hyperspectral data for assessing 3D lithological and alteratio...
Application of hyperspectral data for assessing 3D lithological and alteratio...NSW Environment and Planning
 

Viewers also liked (19)

Characteristics of porphyry copper deposits
Characteristics of porphyry copper depositsCharacteristics of porphyry copper deposits
Characteristics of porphyry copper deposits
 
Cu porphyry
Cu porphyryCu porphyry
Cu porphyry
 
Sillitoe2010 copper
Sillitoe2010 copperSillitoe2010 copper
Sillitoe2010 copper
 
Inclusiones fluidas ppt
Inclusiones fluidas pptInclusiones fluidas ppt
Inclusiones fluidas ppt
 
From old mine map to exploration target using 3D. Hein Raat, Boliden
From old mine map to exploration target using 3D. Hein Raat, BolidenFrom old mine map to exploration target using 3D. Hein Raat, Boliden
From old mine map to exploration target using 3D. Hein Raat, Boliden
 
Reservoir Minerals Presentation - October 2012
Reservoir Minerals Presentation - October 2012Reservoir Minerals Presentation - October 2012
Reservoir Minerals Presentation - October 2012
 
Navarre Minerals | ASX:NML | RIS2014 Broken Hill Investor Presentation
Navarre Minerals | ASX:NML | RIS2014 Broken Hill Investor PresentationNavarre Minerals | ASX:NML | RIS2014 Broken Hill Investor Presentation
Navarre Minerals | ASX:NML | RIS2014 Broken Hill Investor Presentation
 
Developing Gold Projects in Tanzania and Namibia
Developing Gold Projects in Tanzania and NamibiaDeveloping Gold Projects in Tanzania and Namibia
Developing Gold Projects in Tanzania and Namibia
 
08 09 12
08 09 1208 09 12
08 09 12
 
PDAC 2016 presentation by Martini, Carey, & Witter
PDAC 2016 presentation by Martini, Carey, & WitterPDAC 2016 presentation by Martini, Carey, & Witter
PDAC 2016 presentation by Martini, Carey, & Witter
 
Reservoir Corporate PDAC
Reservoir Corporate PDACReservoir Corporate PDAC
Reservoir Corporate PDAC
 
Massive sulfides
Massive sulfidesMassive sulfides
Massive sulfides
 
160603 corporate presentation
160603 corporate presentation160603 corporate presentation
160603 corporate presentation
 
The Tectonic and Metallogenic Framework of Myanmar: A Tethyan mineral system
The Tectonic and Metallogenic Framework of Myanmar: A Tethyan mineral systemThe Tectonic and Metallogenic Framework of Myanmar: A Tethyan mineral system
The Tectonic and Metallogenic Framework of Myanmar: A Tethyan mineral system
 
Evolution of tethys
Evolution of tethysEvolution of tethys
Evolution of tethys
 
Mining Geology and Exploration | Rodger Allen Gold Mine
 Mining Geology and Exploration | Rodger Allen Gold Mine Mining Geology and Exploration | Rodger Allen Gold Mine
Mining Geology and Exploration | Rodger Allen Gold Mine
 
Economic geology - Magmatic ore deposits_1
Economic geology - Magmatic ore deposits_1Economic geology - Magmatic ore deposits_1
Economic geology - Magmatic ore deposits_1
 
Presentation On Ophiolites
Presentation On OphiolitesPresentation On Ophiolites
Presentation On Ophiolites
 
Application of hyperspectral data for assessing 3D lithological and alteratio...
Application of hyperspectral data for assessing 3D lithological and alteratio...Application of hyperspectral data for assessing 3D lithological and alteratio...
Application of hyperspectral data for assessing 3D lithological and alteratio...
 

More from Remote Sensing GEOIMAGE

Mapeo y diferenciación de Goethita, Jarosita y Hematita usando imágenes Senti...
Mapeo y diferenciación de Goethita, Jarosita y Hematita usando imágenes Senti...Mapeo y diferenciación de Goethita, Jarosita y Hematita usando imágenes Senti...
Mapeo y diferenciación de Goethita, Jarosita y Hematita usando imágenes Senti...Remote Sensing GEOIMAGE
 
Aplicacion de los sensores remotos en la exploracion sga dic 16
Aplicacion de los sensores remotos en la exploracion sga dic 16Aplicacion de los sensores remotos en la exploracion sga dic 16
Aplicacion de los sensores remotos en la exploracion sga dic 16Remote Sensing GEOIMAGE
 
Volcanogenic Massive Sulfide Occurrence Model
Volcanogenic Massive Sulfide Occurrence ModelVolcanogenic Massive Sulfide Occurrence Model
Volcanogenic Massive Sulfide Occurrence ModelRemote Sensing GEOIMAGE
 
Aplicacion de los sensores remotos en la exploracion - SEG
Aplicacion de los sensores remotos en la exploracion - SEGAplicacion de los sensores remotos en la exploracion - SEG
Aplicacion de los sensores remotos en la exploracion - SEGRemote Sensing GEOIMAGE
 
Caracterización espectral de tipos de alunita y silice en depósitos epitermal...
Caracterización espectral de tipos de alunita y silice en depósitos epitermal...Caracterización espectral de tipos de alunita y silice en depósitos epitermal...
Caracterización espectral de tipos de alunita y silice en depósitos epitermal...Remote Sensing GEOIMAGE
 
Mapeo de Alteraciones Hidrotermales en la Mina Yanacocha
Mapeo de Alteraciones Hidrotermales en la Mina YanacochaMapeo de Alteraciones Hidrotermales en la Mina Yanacocha
Mapeo de Alteraciones Hidrotermales en la Mina YanacochaRemote Sensing GEOIMAGE
 
RS-GEOIMAGE Servicios en la exploración mineral utilizando imágenes satelitales
RS-GEOIMAGE Servicios en la exploración mineral utilizando imágenes satelitalesRS-GEOIMAGE Servicios en la exploración mineral utilizando imágenes satelitales
RS-GEOIMAGE Servicios en la exploración mineral utilizando imágenes satelitalesRemote Sensing GEOIMAGE
 
Mineral mapping and applications of imaging spectroscopy
Mineral mapping and applications of imaging spectroscopyMineral mapping and applications of imaging spectroscopy
Mineral mapping and applications of imaging spectroscopyRemote Sensing GEOIMAGE
 
Detección de áreas mineralizadas utilizando el sensor aster
Detección de áreas mineralizadas utilizando el sensor asterDetección de áreas mineralizadas utilizando el sensor aster
Detección de áreas mineralizadas utilizando el sensor asterRemote Sensing GEOIMAGE
 
Grsg abstract book v5 Advances in Geological Remote Sensing
Grsg abstract book v5 Advances in Geological Remote Sensing Grsg abstract book v5 Advances in Geological Remote Sensing
Grsg abstract book v5 Advances in Geological Remote Sensing Remote Sensing GEOIMAGE
 
Aplicacion de los sensores remotos en la exploracion de yacimientos tipos por...
Aplicacion de los sensores remotos en la exploracion de yacimientos tipos por...Aplicacion de los sensores remotos en la exploracion de yacimientos tipos por...
Aplicacion de los sensores remotos en la exploracion de yacimientos tipos por...Remote Sensing GEOIMAGE
 

More from Remote Sensing GEOIMAGE (15)

Mapeo y diferenciación de Goethita, Jarosita y Hematita usando imágenes Senti...
Mapeo y diferenciación de Goethita, Jarosita y Hematita usando imágenes Senti...Mapeo y diferenciación de Goethita, Jarosita y Hematita usando imágenes Senti...
Mapeo y diferenciación de Goethita, Jarosita y Hematita usando imágenes Senti...
 
Aplicacion de los sensores remotos en la exploracion sga dic 16
Aplicacion de los sensores remotos en la exploracion sga dic 16Aplicacion de los sensores remotos en la exploracion sga dic 16
Aplicacion de los sensores remotos en la exploracion sga dic 16
 
EXPLORACION GEOLOGICA MINERA
EXPLORACION GEOLOGICA MINERAEXPLORACION GEOLOGICA MINERA
EXPLORACION GEOLOGICA MINERA
 
GEOLOGICAL - MINING EXPLORATION
GEOLOGICAL - MINING EXPLORATION GEOLOGICAL - MINING EXPLORATION
GEOLOGICAL - MINING EXPLORATION
 
Volcanogenic Massive Sulfide Occurrence Model
Volcanogenic Massive Sulfide Occurrence ModelVolcanogenic Massive Sulfide Occurrence Model
Volcanogenic Massive Sulfide Occurrence Model
 
Mineral mapping WV3 Cuprite - Nevada
Mineral mapping WV3 Cuprite - NevadaMineral mapping WV3 Cuprite - Nevada
Mineral mapping WV3 Cuprite - Nevada
 
Aplicacion de los sensores remotos en la exploracion - SEG
Aplicacion de los sensores remotos en la exploracion - SEGAplicacion de los sensores remotos en la exploracion - SEG
Aplicacion de los sensores remotos en la exploracion - SEG
 
Caracterización espectral de tipos de alunita y silice en depósitos epitermal...
Caracterización espectral de tipos de alunita y silice en depósitos epitermal...Caracterización espectral de tipos de alunita y silice en depósitos epitermal...
Caracterización espectral de tipos de alunita y silice en depósitos epitermal...
 
Mapeo de Alteraciones Hidrotermales en la Mina Yanacocha
Mapeo de Alteraciones Hidrotermales en la Mina YanacochaMapeo de Alteraciones Hidrotermales en la Mina Yanacocha
Mapeo de Alteraciones Hidrotermales en la Mina Yanacocha
 
RS-GEOIMAGE Servicios en la exploración mineral utilizando imágenes satelitales
RS-GEOIMAGE Servicios en la exploración mineral utilizando imágenes satelitalesRS-GEOIMAGE Servicios en la exploración mineral utilizando imágenes satelitales
RS-GEOIMAGE Servicios en la exploración mineral utilizando imágenes satelitales
 
Mineral mapping and applications of imaging spectroscopy
Mineral mapping and applications of imaging spectroscopyMineral mapping and applications of imaging spectroscopy
Mineral mapping and applications of imaging spectroscopy
 
Detección de áreas mineralizadas utilizando el sensor aster
Detección de áreas mineralizadas utilizando el sensor asterDetección de áreas mineralizadas utilizando el sensor aster
Detección de áreas mineralizadas utilizando el sensor aster
 
Grsg abstract book v5 Advances in Geological Remote Sensing
Grsg abstract book v5 Advances in Geological Remote Sensing Grsg abstract book v5 Advances in Geological Remote Sensing
Grsg abstract book v5 Advances in Geological Remote Sensing
 
Aster minerales castrovirreyna
Aster minerales castrovirreynaAster minerales castrovirreyna
Aster minerales castrovirreyna
 
Aplicacion de los sensores remotos en la exploracion de yacimientos tipos por...
Aplicacion de los sensores remotos en la exploracion de yacimientos tipos por...Aplicacion de los sensores remotos en la exploracion de yacimientos tipos por...
Aplicacion de los sensores remotos en la exploracion de yacimientos tipos por...
 

Recently uploaded

Unraveling Multimodality with Large Language Models.pdf
Unraveling Multimodality with Large Language Models.pdfUnraveling Multimodality with Large Language Models.pdf
Unraveling Multimodality with Large Language Models.pdfAlex Barbosa Coqueiro
 
The Fit for Passkeys for Employee and Consumer Sign-ins: FIDO Paris Seminar.pptx
The Fit for Passkeys for Employee and Consumer Sign-ins: FIDO Paris Seminar.pptxThe Fit for Passkeys for Employee and Consumer Sign-ins: FIDO Paris Seminar.pptx
The Fit for Passkeys for Employee and Consumer Sign-ins: FIDO Paris Seminar.pptxLoriGlavin3
 
The Role of FIDO in a Cyber Secure Netherlands: FIDO Paris Seminar.pptx
The Role of FIDO in a Cyber Secure Netherlands: FIDO Paris Seminar.pptxThe Role of FIDO in a Cyber Secure Netherlands: FIDO Paris Seminar.pptx
The Role of FIDO in a Cyber Secure Netherlands: FIDO Paris Seminar.pptxLoriGlavin3
 
TrustArc Webinar - How to Build Consumer Trust Through Data Privacy
TrustArc Webinar - How to Build Consumer Trust Through Data PrivacyTrustArc Webinar - How to Build Consumer Trust Through Data Privacy
TrustArc Webinar - How to Build Consumer Trust Through Data PrivacyTrustArc
 
Transcript: New from BookNet Canada for 2024: Loan Stars - Tech Forum 2024
Transcript: New from BookNet Canada for 2024: Loan Stars - Tech Forum 2024Transcript: New from BookNet Canada for 2024: Loan Stars - Tech Forum 2024
Transcript: New from BookNet Canada for 2024: Loan Stars - Tech Forum 2024BookNet Canada
 
The State of Passkeys with FIDO Alliance.pptx
The State of Passkeys with FIDO Alliance.pptxThe State of Passkeys with FIDO Alliance.pptx
The State of Passkeys with FIDO Alliance.pptxLoriGlavin3
 
DevEX - reference for building teams, processes, and platforms
DevEX - reference for building teams, processes, and platformsDevEX - reference for building teams, processes, and platforms
DevEX - reference for building teams, processes, and platformsSergiu Bodiu
 
Digital Identity is Under Attack: FIDO Paris Seminar.pptx
Digital Identity is Under Attack: FIDO Paris Seminar.pptxDigital Identity is Under Attack: FIDO Paris Seminar.pptx
Digital Identity is Under Attack: FIDO Paris Seminar.pptxLoriGlavin3
 
Tampa BSides - Chef's Tour of Microsoft Security Adoption Framework (SAF)
Tampa BSides - Chef's Tour of Microsoft Security Adoption Framework (SAF)Tampa BSides - Chef's Tour of Microsoft Security Adoption Framework (SAF)
Tampa BSides - Chef's Tour of Microsoft Security Adoption Framework (SAF)Mark Simos
 
What's New in Teams Calling, Meetings and Devices March 2024
What's New in Teams Calling, Meetings and Devices March 2024What's New in Teams Calling, Meetings and Devices March 2024
What's New in Teams Calling, Meetings and Devices March 2024Stephanie Beckett
 
Ensuring Technical Readiness For Copilot in Microsoft 365
Ensuring Technical Readiness For Copilot in Microsoft 365Ensuring Technical Readiness For Copilot in Microsoft 365
Ensuring Technical Readiness For Copilot in Microsoft 3652toLead Limited
 
SALESFORCE EDUCATION CLOUD | FEXLE SERVICES
SALESFORCE EDUCATION CLOUD | FEXLE SERVICESSALESFORCE EDUCATION CLOUD | FEXLE SERVICES
SALESFORCE EDUCATION CLOUD | FEXLE SERVICESmohitsingh558521
 
Commit 2024 - Secret Management made easy
Commit 2024 - Secret Management made easyCommit 2024 - Secret Management made easy
Commit 2024 - Secret Management made easyAlfredo García Lavilla
 
Moving Beyond Passwords: FIDO Paris Seminar.pdf
Moving Beyond Passwords: FIDO Paris Seminar.pdfMoving Beyond Passwords: FIDO Paris Seminar.pdf
Moving Beyond Passwords: FIDO Paris Seminar.pdfLoriGlavin3
 
"ML in Production",Oleksandr Bagan
"ML in Production",Oleksandr Bagan"ML in Production",Oleksandr Bagan
"ML in Production",Oleksandr BaganFwdays
 
TeamStation AI System Report LATAM IT Salaries 2024
TeamStation AI System Report LATAM IT Salaries 2024TeamStation AI System Report LATAM IT Salaries 2024
TeamStation AI System Report LATAM IT Salaries 2024Lonnie McRorey
 
From Family Reminiscence to Scholarly Archive .
From Family Reminiscence to Scholarly Archive .From Family Reminiscence to Scholarly Archive .
From Family Reminiscence to Scholarly Archive .Alan Dix
 
Are Multi-Cloud and Serverless Good or Bad?
Are Multi-Cloud and Serverless Good or Bad?Are Multi-Cloud and Serverless Good or Bad?
Are Multi-Cloud and Serverless Good or Bad?Mattias Andersson
 
Generative AI for Technical Writer or Information Developers
Generative AI for Technical Writer or Information DevelopersGenerative AI for Technical Writer or Information Developers
Generative AI for Technical Writer or Information DevelopersRaghuram Pandurangan
 
Use of FIDO in the Payments and Identity Landscape: FIDO Paris Seminar.pptx
Use of FIDO in the Payments and Identity Landscape: FIDO Paris Seminar.pptxUse of FIDO in the Payments and Identity Landscape: FIDO Paris Seminar.pptx
Use of FIDO in the Payments and Identity Landscape: FIDO Paris Seminar.pptxLoriGlavin3
 

Recently uploaded (20)

Unraveling Multimodality with Large Language Models.pdf
Unraveling Multimodality with Large Language Models.pdfUnraveling Multimodality with Large Language Models.pdf
Unraveling Multimodality with Large Language Models.pdf
 
The Fit for Passkeys for Employee and Consumer Sign-ins: FIDO Paris Seminar.pptx
The Fit for Passkeys for Employee and Consumer Sign-ins: FIDO Paris Seminar.pptxThe Fit for Passkeys for Employee and Consumer Sign-ins: FIDO Paris Seminar.pptx
The Fit for Passkeys for Employee and Consumer Sign-ins: FIDO Paris Seminar.pptx
 
The Role of FIDO in a Cyber Secure Netherlands: FIDO Paris Seminar.pptx
The Role of FIDO in a Cyber Secure Netherlands: FIDO Paris Seminar.pptxThe Role of FIDO in a Cyber Secure Netherlands: FIDO Paris Seminar.pptx
The Role of FIDO in a Cyber Secure Netherlands: FIDO Paris Seminar.pptx
 
TrustArc Webinar - How to Build Consumer Trust Through Data Privacy
TrustArc Webinar - How to Build Consumer Trust Through Data PrivacyTrustArc Webinar - How to Build Consumer Trust Through Data Privacy
TrustArc Webinar - How to Build Consumer Trust Through Data Privacy
 
Transcript: New from BookNet Canada for 2024: Loan Stars - Tech Forum 2024
Transcript: New from BookNet Canada for 2024: Loan Stars - Tech Forum 2024Transcript: New from BookNet Canada for 2024: Loan Stars - Tech Forum 2024
Transcript: New from BookNet Canada for 2024: Loan Stars - Tech Forum 2024
 
The State of Passkeys with FIDO Alliance.pptx
The State of Passkeys with FIDO Alliance.pptxThe State of Passkeys with FIDO Alliance.pptx
The State of Passkeys with FIDO Alliance.pptx
 
DevEX - reference for building teams, processes, and platforms
DevEX - reference for building teams, processes, and platformsDevEX - reference for building teams, processes, and platforms
DevEX - reference for building teams, processes, and platforms
 
Digital Identity is Under Attack: FIDO Paris Seminar.pptx
Digital Identity is Under Attack: FIDO Paris Seminar.pptxDigital Identity is Under Attack: FIDO Paris Seminar.pptx
Digital Identity is Under Attack: FIDO Paris Seminar.pptx
 
Tampa BSides - Chef's Tour of Microsoft Security Adoption Framework (SAF)
Tampa BSides - Chef's Tour of Microsoft Security Adoption Framework (SAF)Tampa BSides - Chef's Tour of Microsoft Security Adoption Framework (SAF)
Tampa BSides - Chef's Tour of Microsoft Security Adoption Framework (SAF)
 
What's New in Teams Calling, Meetings and Devices March 2024
What's New in Teams Calling, Meetings and Devices March 2024What's New in Teams Calling, Meetings and Devices March 2024
What's New in Teams Calling, Meetings and Devices March 2024
 
Ensuring Technical Readiness For Copilot in Microsoft 365
Ensuring Technical Readiness For Copilot in Microsoft 365Ensuring Technical Readiness For Copilot in Microsoft 365
Ensuring Technical Readiness For Copilot in Microsoft 365
 
SALESFORCE EDUCATION CLOUD | FEXLE SERVICES
SALESFORCE EDUCATION CLOUD | FEXLE SERVICESSALESFORCE EDUCATION CLOUD | FEXLE SERVICES
SALESFORCE EDUCATION CLOUD | FEXLE SERVICES
 
Commit 2024 - Secret Management made easy
Commit 2024 - Secret Management made easyCommit 2024 - Secret Management made easy
Commit 2024 - Secret Management made easy
 
Moving Beyond Passwords: FIDO Paris Seminar.pdf
Moving Beyond Passwords: FIDO Paris Seminar.pdfMoving Beyond Passwords: FIDO Paris Seminar.pdf
Moving Beyond Passwords: FIDO Paris Seminar.pdf
 
"ML in Production",Oleksandr Bagan
"ML in Production",Oleksandr Bagan"ML in Production",Oleksandr Bagan
"ML in Production",Oleksandr Bagan
 
TeamStation AI System Report LATAM IT Salaries 2024
TeamStation AI System Report LATAM IT Salaries 2024TeamStation AI System Report LATAM IT Salaries 2024
TeamStation AI System Report LATAM IT Salaries 2024
 
From Family Reminiscence to Scholarly Archive .
From Family Reminiscence to Scholarly Archive .From Family Reminiscence to Scholarly Archive .
From Family Reminiscence to Scholarly Archive .
 
Are Multi-Cloud and Serverless Good or Bad?
Are Multi-Cloud and Serverless Good or Bad?Are Multi-Cloud and Serverless Good or Bad?
Are Multi-Cloud and Serverless Good or Bad?
 
Generative AI for Technical Writer or Information Developers
Generative AI for Technical Writer or Information DevelopersGenerative AI for Technical Writer or Information Developers
Generative AI for Technical Writer or Information Developers
 
Use of FIDO in the Payments and Identity Landscape: FIDO Paris Seminar.pptx
Use of FIDO in the Payments and Identity Landscape: FIDO Paris Seminar.pptxUse of FIDO in the Payments and Identity Landscape: FIDO Paris Seminar.pptx
Use of FIDO in the Payments and Identity Landscape: FIDO Paris Seminar.pptx
 

Porphyry Copper Deposit Model

  • 1. U.S. Department of the Interior U.S. Geological Survey Scientific Investigations Report 2010–5070–B Porphyry Copper Deposit Model
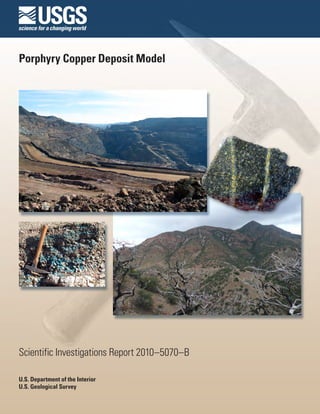
  • 2. Cover.  Photographs of porphyry copper deposits and ores. Upper left: Ray Mine, Arizona, one of the largest porphyry copper deposits in the United States. Upper right: High-grade copper ore from the Ray Mine, Arizona. Chalcopyrite veins cut the   Ray diabase. Sample is about 6.5 centimeters wide. Lower left: Chrysocolla (blue) cementing gravel, Black Copper Wash,   Kelvin-Riverside district, Arizona. Small exotic copper deposit in older Holocene gravel deposits that cover Kelvin-Riverside  porphyry copper system. Hammer handle is about 28 centimeters long. Lower right: View of the west side of Red Mountain,   Arizona, showing hydrothermally altered volcanic rocks that overlie porphyry copper deposit that lies about 1,000 meters   below the top of the mountain.
  • 3. Porphyry Copper Deposit Model By David A. John, editor, with contributions by Robert A. Ayuso, Mark D. Barton, Richard J. Blakely, Robert J. Bodnar, John H. Dilles, Floyd Gray, Fred T. Graybeal, John C. Mars, Darcy K. McPhee, Robert R. Seal, Ryan D. Taylor, and Peter G. Vikre Chapter B of Mineral Deposit Models for Resource Assessment Scientific Investigations Report 2010–5070–B U.S. Department of the Interior U.S. Geological Survey
  • 4. U.S. Department of the Interior KEN SALAZAR, Secretary U.S. Geological Survey Marcia K. McNutt, Director U.S. Geological Survey, Reston, Virginia: 2010 For more information on the USGS—the Federal source for science about the Earth, its natural and living resources, natural hazards, and the environment, visit http://www.usgs.gov or call 1-888-ASK-USGS For an overview of USGS information products, including maps, imagery, and publications, visit http://www.usgs.gov/pubprod To order this and other USGS information products, visit http://store.usgs.gov Any use of trade, product, or firm names is for descriptive purposes only and does not imply endorsement by the U.S. Government. Although this report is in the public domain, permission must be secured from the individual copyright owners to reproduce any copyrighted materials contained within this report. Suggested citation: John, D.A., Ayuso, R.A., Barton, M.D., Blakely, R.J., Bodnar, R.J., Dilles, J.H., Gray, Floyd, Graybeal, F.T., Mars, J.C., McPhee, D.K., Seal, R.R., Taylor, R.D., and Vikre, P.G., 2010, Porphyry copper deposit model, chap. B of Mineral deposit models for resource assessment: U.S. Geological Survey Scientific Investigations Report 2010–5070–B, 169 p.
  • 5. iii Contents Abstract............................................................................................................................................................1 Summary of Porphyry Copper Deposit Model ..........................................................................................1 Associated Commodities and Deposit Types ...................................................................................1 Regional Environment ..........................................................................................................................1 Physical Description of Deposits........................................................................................................2 Geophysical Characteristics................................................................................................................3 Hypogene Ore Characteristics............................................................................................................3 Supergene Ore Characteristics...........................................................................................................4 Hypogene and Supergene Gangue Characteristics........................................................................4 Hydrothermal Alteration.......................................................................................................................5 Geochemical Characteristics..............................................................................................................6 Petrology of Associated Igneous Rocks............................................................................................7 Theory of Ore Deposit Genesis............................................................................................................8 Sources of Fluids .........................................................................................................................8 Controls on Permeability and Fluid Flow...................................................................................8 Chemical Transport and Transfer Processes...........................................................................9 Heat-Transfer Processes.............................................................................................................9 Pressure Gradients.......................................................................................................................9 Wall-Rock Reaction and Ore-Mineral Deposition Processes...............................................9 Relation between Alteration, Gangue, and Veins..................................................................10 Geoenvironmental Features...............................................................................................................10 Porphyry Copper Deposit Exploration and Resource Assessment Objectives and Guides...............................................................................................................................10 Broader Implications, Societal Relevance, and Knowledge Gaps of Porphyry Copper Deposits.....................................................................................................................10 A.  Introduction.............................................................................................................................................11 B.  Deposit Type and Associated Commodities.......................................................................................11 Name ...................................................................................................................................................11 Synonyms..............................................................................................................................................11 Brief Description..................................................................................................................................13 Associated and Transitional Deposit Types....................................................................................14 Primary Commodities .........................................................................................................................14 By-Product Commodities ...................................................................................................................14 Trace Constituents...............................................................................................................................14 Example Deposits................................................................................................................................14 C.  History of Porphyry Copper Deposits..................................................................................................14 D.  Regional Environment ...........................................................................................................................15 Geotectonic Environment ..................................................................................................................15 Temporal (Secular) Relations.............................................................................................................18 Variations Through Geologic Time...........................................................................................18 Variation Within Magmatic Cycles..........................................................................................18 Duration of Magmatic-Hydrothermal Systems that Form Porphyry Copper Deposits ............18 Relations to Structures ......................................................................................................................21
  • 6. iv Structural Setting(s) and Controls...........................................................................................21 Tectonic Setting..........................................................................................................................21 Structural Control of Magma Emplacement...........................................................................21 Origin of Veins.............................................................................................................................21 Preservation and Dismemberment of Porphyries.................................................................23 Relations to Igneous Rocks................................................................................................................24 Relations to Sedimentary Rocks ......................................................................................................24 Relations to Metamorphic Rocks......................................................................................................24 E.  Physical Description of Deposits..........................................................................................................24 Dimensions in Plan View....................................................................................................................25 Vertical Extent .....................................................................................................................................25 Form/Shape ..........................................................................................................................................25 Size of Hydrothermal Systems Relative to Extent of Economically Mineralized Rock....................................................................................................................25 Host Rocks ...........................................................................................................................................28 Structural Setting(s) and Controls....................................................................................................28 F.  Geophysical Characteristics .................................................................................................................28 Introduction .........................................................................................................................................28 Regional-Scale Geophysics ..............................................................................................................31 Deposit-Scale Geophysics ................................................................................................................32 Magnetic Anomalies..................................................................................................................32 Electrical and Electromagnetic Methods...............................................................................33 Electrical Methods............................................................................................................35 Electromagnetic Methods................................................................................................36 Examples of Electrical and Electromagnetic Surveys in Porphyry Copper Exploration...............................................................................................37 Other Geophysical Methods.....................................................................................................37 Self (Spontaneous) Potential ..........................................................................................37 Gravity .................................................................................................................................37 Seismic Reflection.............................................................................................................38 Limitations ............................................................................................................................................38 VINR-SWIR and TIR Remote Sensing of Porphyry Copper Deposits..........................................38 Introduction.................................................................................................................................38 Porphyry Copper Deposits and Spectral Characteristics....................................................38 Hyperspectral and Multispectral Imaging Systems and Previous Studies Mapping Porphyry Copper Deposits...........................................................39 Case Study—Mapping Altered Rocks in the Sar Cheshmeh Region of Iran using ASTER Data.............................................................................................43 Introduction, Geology, and Mapped Alteration............................................................43 Data and Calibration—Mapping Methods—ASTER False Color Composite Image..................................................................................................45 Description and Interpretation of ASTER468 Image and ASTER Alteration Minerals Map.....................................................................................46 Conclusions.................................................................................................................................50 G.  Hypogene Ore Characteristics.............................................................................................................50 Grade ...................................................................................................................................................50
  • 7. v Mineralogy............................................................................................................................................50 Mineral Assemblages.........................................................................................................................51 Paragenesis and Zoning.....................................................................................................................51 Forms and Textures.............................................................................................................................51 H and K.  Hypogene and Supergene Gangue Characteristics..............................................................55 Mineralogy............................................................................................................................................55 Mineral Assemblages and Paragenesis..........................................................................................55 Zoning ...................................................................................................................................................55 Textures and Grain Sizes of Hypogene Gangue ............................................................................56 Textures and Grain Sizes of Supergene Gangue ...........................................................................56 Significance of Gangue......................................................................................................................57 I.  Hydrothermal Alteration..........................................................................................................................57 Mineralogy............................................................................................................................................57 Mineralogy of Assemblages and Associated Veins......................................................................57 Lateral and Vertical Dimensions ......................................................................................................60 Selvages................................................................................................................................................60 Rock Matrix Alteration........................................................................................................................62 Intensity.................................................................................................................................................62 Textures.................................................................................................................................................62 Zoning Patterns....................................................................................................................................62 J.  Supergene Ore Characteristics ...........................................................................................................64 Dimensions, Tonnages, and Grades ................................................................................................65 Formation and Distribution ................................................................................................................65 Mineralogy............................................................................................................................................66 Mineral Associations and Assemblages.........................................................................................66 Textures and Grain Size .....................................................................................................................66 L.  Weathering/Supergene Processes .....................................................................................................66 Introduction..........................................................................................................................................66 Mineralogy............................................................................................................................................68 Rates ...................................................................................................................................................68 Effects of Micro and Macro Climates..............................................................................................68 Effects of Hydrologic Setting.............................................................................................................68 M.  Geochemical Characteristics..............................................................................................................70 Lithochemistry .....................................................................................................................................70 Minor Element Zoning Patterns ........................................................................................................70 Mineral Compositions ........................................................................................................................73 Fluid-Inclusion Thermometry and Geochemistry ..........................................................................80 Chemical Compositions of Fluids .....................................................................................................83 Stable Isotope Compositions of Fluids ............................................................................................87 Nontraditional Stable Isotopes—Copper and Molybdenum .......................................................88 N.  Petrology of Associated Igneous Rocks ............................................................................................89 Rock Names..........................................................................................................................................89 Forms of Igneous Rocks and Rock Associations ..........................................................................89 Mineralogy ...........................................................................................................................................89 Textures and Structures.....................................................................................................................89
  • 8. vi Grain Size..............................................................................................................................................91 Petrochemistry.....................................................................................................................................91 Trace-Element Geochemistry............................................................................................................97 Isotope Geochemistry.......................................................................................................................100 Radiogenic Isotopes of Ore .............................................................................................................106 Depth of Emplacement......................................................................................................................107 O.  Petrology of Associated Sedimentary Rocks .................................................................................107 P.  Petrology of Associated Metamorphic Rocks ................................................................................107 Q.  Theory of Ore Deposit Formation ......................................................................................................108 Ore Deposit System Affiliations ......................................................................................................108 Controls on Permeability and Fluid Flow........................................................................................109 Sources of Fluids and Metals..........................................................................................................109 Chemical Transport and Transfer Processes................................................................................112 Heat Transport and Transfer Processes........................................................................................113 Time Scale..................................................................................................................................113 Pressure Gradients During Porphyry Copper System Formation..............................................114 Wall-Rock Reaction and Ore-Mineral Deposition Processes ...................................................114 Relation Between Alteration, Gangue and Vein Mineralization................................................115 R.  Porphyry Copper Exploration and Resource Assessment Guides ...............................................116 Hypogene Characteristics of PCDs and Gradients within PCD Systems.................................116 Mapping of Rock Types, Structure, Hydrothermal Minerals, and Zoning.......................116 Fluid Inclusion Zoning and Thermal Gradients ...................................................................117 Mineral Properties....................................................................................................................117 Vein Abundance, Mineralogy, and Paragenesis.................................................................117 Distribution of Sulfide Minerals..............................................................................................117 Minor-Element Geochemistry.................................................................................................117 Spectral Imagery......................................................................................................................120 Supergene-Enriched and Oxidized PCDs......................................................................................120 Supergene Enrichment and Leached Capping Characteristics........................................120 Copper-Oxide Minerals ...........................................................................................................120 Recognition of Permissive Terrain for Porphyry Copper Exploration and Assessment.........121 Postmineralization Cover and Proximity to Porphyry Copper Deposits...........................121 Regional Structure and Intrusion Emplacement.................................................................121 Continental-Scale Permissive Terrains ................................................................................121 Depth Limitations......................................................................................................................121 S.  Geoenvironmental Features ...............................................................................................................122 Weathering Processes.....................................................................................................................122 Pre-Mining Baseline Signatures in Soil, Sediment, and Water ................................................123 Past and Future Mining Methods and Ore Treatment ................................................................124 Volume of Mine Waste and Tailings ..............................................................................................124 Mine Waste Characteristics ...........................................................................................................124 Acid/Base Accounting .....................................................................................................................124 Metal Mobility Related to Mining in Groundwater and Surface Water ...................................124 Pit Lakes .............................................................................................................................................124 Ecosystem Issues .............................................................................................................................125
  • 9. vii Human Health Issues .......................................................................................................................125 Climate Effects on Geoenvironmental Signatures ......................................................................125 T.  Knowledge Gaps and Future Research Directions .........................................................................125 U.  Broader Implications and Societal Relevance of Porphyry Copper Systems............................126 References Cited........................................................................................................................................131 Appendix 1.  Grade and tonnage models................................................................................................158 Appendix 2.  Characteristics of Representative Porphyry Copper Deposits ...................................158 Figures A1.  Map showing Phanerozoic porphyry belts, porphyry deposits, and representative porphyry copper deposits summarized in Appendix 2...............................12 B1.  Schematic cross section showing general setting of porphyry copper and associated deposit types....................................................................................................13 D1.  Diagrams showing plate tectonic setting of porphyry copper deposits............................16 D2.  Simplified map of porphyry copper belts and major porphyry copper deposits in the Andes..................................................................................................................17 D3.  Cartoon cross section showing optimum conditions for development of giant porphyry copper deposits................................................................................................18 D4.  Map of Southeast Asia and the west Pacific showing major Cenozoic arcs and copper ± gold and gold deposits.......................................................................................19 D5.  Histogram of the ages of known porphyry copper deposits................................................20 D6.  Maps showing porphyry veins..................................................................................................22 D7.  Cross sections showing offset and tilting of the San Manuel–Kalamazoo orebody by the San Manuel fault..............................................................................................23 E1.  Generalized geologic maps and vertical profiles through several porphyry copper deposits showing vertical extent of ore and footprints of porphyry copper deposits...........................................................................................................................26 E2.  Maps showing copper ore zones at Batu Hijau, Indonesia, Bingham in Utah, Pre-Main stage porphyry copper-molybdenum mineralization at Butte, Montana, Bajo el Alumbrera, Argentina, and Yerington, Nevada.......................................27 E3.  Plan map showing geochemical zoning around the Bingham Canyon deposit, Utah.................................................................................................................................29 E4.  Schematic cross section showing relationship of hydrothermal systems and porphyry copper and related deposits to crystallizing granitic batholith based on exposed deposits and altered rocks in and near the Yerington district in western Nevada.........................................................................................................30 F1.  Map showing aeromagnetic anomalies from the Quebrada Blanca–Collahuasi district, northern Chile..............................................................................32 F2.  Cross sections showing magnetic anomaly caused by a hypothetical porphyry copper deposit............................................................................................................34 F3.  Map showing aeromagnetic anomalies over the Silver Bell porphyry copper deposits in Arizona........................................................................................................35 F4.  Resistivity, chargeability, and susceptibility of the Mount Milligan porphyry deposits in British Columbia, as determined through inversion of direct- current resistivity, induced polarization, and magnetic measurements............................36 F5.  Illustrated deposit model of a porphyry copper deposit.......................................................39
  • 10. viii F6–F9.  Graphs showing: F6.  Laboratory spectra of epidote, calcite, muscovite, kaolinite, chlorite, and alunite, which are common hydrothermal alteration minerals...........................40 F7.  TIR laboratory spectra of quartz and opal at full TIR spectrometer spectral resolution (2600 bands) and resampled to ASTER TIR spectral resolution (5 bands)............................................................................................41 F8.  Comparison of ASTER, AVIRIS, and Landsat Thematic Mapper (TM) VNIR and SWIR image spatial and spectral characteristics......................................41 F9.  (A) VNIR–SWIR AVIRIS (AV), ASTER (AST), and Landsat TM-ETM+ (TM) resampled spectral pairs of epidote, calcite, muscovite, kaolinite, chlorite, and alunite. (B) VNIR–SWIR AVIRIS (AV), ASTER (AST), and Landsat TM-ETM+ (TM) resampled spectral pairs of limonite, jarosite, hematite, and goethite........................................................................................42 F10.  Maps showing TM band 7 image with argillically- and sericitically-altered rocks of the area around the Meiduk copper mine in Iran and alteration minerals map of the Infiernillo copper porphyry deposit in Argentina...............................44 F11.  Geologic map of the Sar Cheshmeh and Seridune area.......................................................45 F12.  Detailed alteration and lithologic map of the Sar-Cheshmeh deposit, Iran.......................46 F13.  Detailed lithologic map of the Seridune prospect and hydrothermal alteration map of the Seridune prospect.................................................................................47 F14.  ASTER false color composite image of the Sar Cheshmeh area........................................48 F15.  ASTER minerals map of the Sar Cheshmeh area consisting of an ASTER false color composite image and advanced argillic, sericitic, propylitic, and silica-rich rocks....................................................................................................................49 I1.  Diagram showing AKF–ACF mineral assemblages in major types of wall-rock alteration.....................................................................................................................58 I2.  Schematic cross sections showing hydrothermal alteration zoning patterns and fluid flow paths for porphyry copper deposits emplaced in different environments................................................................................................................61 I3.  Graph showing temperature relative to mKCl /mHCl diagram for the system K2 O-Al2 O3 -SiO2 -KCl-HCl-H2 O at 1 kilobar with quartz present showing mineral stability and fields for hydrothermal alteration types common in porphyry copper deposits......................................................................................................63 I4.  Model of fluid circulation and alteration in the root zone environment of porphyry copper deposits..........................................................................................................64 J1.  Schematic cross section showing mature supergene profile based on porphyry copper deposits in northern Chile............................................................................65 L1.  Diagram showing mature gossan profile................................................................................67 M1.  Example of lithogeochemistry applied to porphyry copper deposit identification in the Collahuasi district, Chile..........................................................................71 M2–M3.  Gain/loss diagrams for: M2.  Major oxides and minor elements in altered rocks in the Bajo de la Alumbrera porphyry copper deposit, Argentina............................................................72 M3.  Major and minor elements in potassic and phyllic alteration zones in the Sar Chesmeh porphyry copper deposit, Iran, based on comparisons of least altered to potassically altered rocks, and potassically altered to phyllically altered rocks............................................................73 M4.  Cross sections showing distribution of ore-grade copper and gold in the porphyry copper-gold deposit at Bajo de la Alumbrera, Argentina....................................73
  • 11. ix M5–M7.  Graphs showing: M5.  Distribution of molybdenum and zinc relative to copper and alteration zones in the porphyry copper deposit at Red Mountain, Arizona..............................74 M6.  Compositions of magmatic and hydrothermal biotite in porphyry copper-molybdenum deposits, and porphyry molybdenum deposits, and magmatic biotites from granitic intrusions, based on magnesium, iron, fluorine, and chlorine concentrations....................................................................75 M7.  Manganese oxide in coexisting chlorite and epidote relative to lateral distance from the outer edge of the biotite alteration zones in the Silver Bell and Safford porphyry copper deposits, Arizona.............................76 M8.  Plan view of illite crystallinity relative to hydrothermal alteration zones and hypogene and supergene copper grades at various depths in the Campana Mahuida porphyry copper deposit, Argentina......................................................77 M9.  Cathodoluminescence image of bright quartz cut by dark quartz in a quartz+pyrite vein from the porphyry copper deposit at Butte, Montana..........................78 M10.  Map showing distribution of sulfur isotope compositions of hypogene sulfide minerals relative to alteration zones and gold grade in the Cadia alkalic porphyry gold-copper deposit, Australia, corrected for temperature fractionations between pyrite, chalcopyrite, and bornite....................................................79 M11.  Photographs showing examples of different types of fluid inclusions found in porphyry copper deposits......................................................................................................81 M12.  Diagram showing phases in fluid inclusions at room temperature and corresponding entrapment pressures and temperatures for magmatic fluid inclusions from several porphyry copper deposits.......................................................83 M14.  Diagram showing distribution of fluid inclusion types in time and space along a traverse from the center to the periphery of the system and along a traverse from shallow to deep in the center of the system...............................................84 M13.  Graph showing copper concentration compared to homogenization temperature for two fluid inclusion groups, and relative to chalcopyrite solubility, Bingham porphyry copper deposit in Utah............................................................84 M15.  South-southeast to north-northwest section through the Bingham porphyry copper deposit in Utah, showing distribution of fluid inclusion types, copper orebody with grade contours, quartz vein abundances, quartz monzonite porphyry, and monzonite............................................................................85 M16–M17.  Graphs showing: M16.  Partitioning of elements between vapor and liquid, determined by LA–ICP–MS analysis of coeval, individual vapor-rich and liquid-rich fluid inclusions from the Bajo de la Alumbrera, Argentina, and Grasberg, Indonesia, porphyry copper-gold deposits..................................................86 M17.  δ18 O and δD compositions of hydrothermal fluids in equilibrium with hydrothermal minerals and mineral zones, in per mil, for porphyry copper deposits at El Salvador, Chile, Oyu Tolgoi, Mongolia, La Caridad, Mexico, Bingham, Utah, and Butte, Montana..........................................88 N1.  Histogram of rock types in porphyry copper deposits..........................................................90 N2.  Photograph of drill core of quartz feldspar porphyry from Sunnyside porphyry copper system in Arizona that forms main host rock for copper-molybdenum resource..................................................................................................90 N3.  Plots summarizing whole-rock chemical data for selected suites of igneous rocks related to porphyry copper systems..............................................................92
  • 12. x Tables E1.  Summary statistics of areas of ore, sulfides, and altered rock in porphyry copper deposits compiled in Singer and others ....................................................................28 G1.  Frequency of occurrence (percentage of deposits) of hypogene hydrothermal (H) and supergene minerals and elements (S) in porphyry copper deposits...........................................................................................................................52 G2.  Some common hypogene vein and disseminated mineral assemblages in porphyry copper deposits......................................................................................................54 L1.  Mineral assemblages in geochemical domains in high and low mass flux conditions......................................................................................................................................69 L2.  Minerals commonly found in the oxide zone of porphyry copper deposits.......................69 N1.  Temporal evolution of the definition of adakites ...................................................................94 N2.  General chemical characteristics of selected porphyry copper- molybdenum stocks. ...................................................................................................................96 N4–N6.  Graphs showing: N4.  Yttrium compared to strontium/yttrium diagram for samples of plutonic rocks associated with porphyry copper deposits.........................................99 N5.  207 Pb/204 Pb-206 Pb/204 Pb diagrams showing generalized fields of granitic rocks, feldspars, and sulfide minerals associated with porphyry copper deposits................................................................................................................102 N6.  Neodymium-strontium isotope compositions of granitic rocks associated with porphyry copper deposits..................................................................103 N7.  Map showing depth of erosion of Mesozoic plutonic rocks and copper and tungsten deposits in the Western United States..........................................................108 Q1.  Graph showing pressure-temperature diagram for the NaCl-H2 O fluid system, showing isopleths of solubility of sodium chloride in water and in steam with approximate depths corresponding to lithostatic pressures on right vertical axis and hydrostatic pressures on left vertical axis...............................110 R1.  Cross sections of a model of a porphyry copper system that shows the distribution and types of mineral deposits, rocks, and alteration zones in porphyry copper systems, and lateral profiles of system attributes that compose exploration guides....................................................................................................118 U1.  Diagram showing estimates of the annual flux of elements mined during the production of porphyry deposits as compared to annual global consumption of the same elements........................................................................................127 U2.  Schematic diagrams showing generalized mass flow in the crust, at the surface, and during mining in relation to Lifecycles of Porphyry Copper Deposits project tasks..............................................................................................................128 U3.  Map of Arizona showing the distribution of known porphyry copper deposits, Laramide-age (coeval) igneous rocks, post-Laramide cover, and areas where mineral development is restricted by population growth or other land-use restrictions..................................................................................................130
  • 13. xi Conversion Factors SI to Inch/Pound Multiply By To obtain Length centimeter (cm) 0.3937 inch (in.) millimeter (mm) 0.03937 inch (in.) meter (m) 3.281 foot (ft) kilometer (km) 0.6214 mile (mi) kilometer (km) 0.5400 mile, nautical (nmi) meter (m) 1.094 yard (yd) Area square meter (m2 ) 0.0002471 acre square kilometer (km2 ) 247.1 acre square centimeter (cm2 ) 0.001076 square foot (ft2 ) square meter (m2 ) 10.76 square foot (ft2 ) square centimeter (cm2 ) 0.1550 square inch (ft2 ) square kilometer (km2 ) 0.3861 square mile (mi2 ) Volume cubic meter (m3 ) 6.290 barrel (petroleum, 1 barrel = 42 gal) liter (L) 33.82 ounce, fluid (fl. oz) liter (L) 2.113 pint (pt) liter (L) 1.057 quart (qt) liter (L) 0.2642 gallon (gal) cubic meter (m3 ) 264.2 gallon (gal) cubic meter (m3 ) 0.0002642 million gallons (Mgal) liter (L) 61.02 cubic inch (in3 ) cubic meter (m3 ) 35.31 cubic foot (ft3 ) cubic meter (m3 ) 1.308 cubic yard (yd3 ) cubic kilometer (km3 ) 0.2399 cubic mile (mi3 ) cubic meter (m3 ) 0.0008107 acre-foot (acre-ft) Weight gram (g) 0.03527 ounce, avoirdupois (oz) kilogram (kg) 2.205 pound avoirdupois (lb) metric ton per year 1.102 ton per year (ton/yr) Pressure bar 100 kilopascal (kPa) kilobar 100 megapascal (mPa)
  • 14. xii Temperature in degrees Celsius (°C) may be converted to degrees Fahrenheit (°F) as follows: °F=(1.8×°C)+32 Temperature in degrees Fahrenheit (°F) may be converted to degrees Celsius (°C) as follows: °C=(°F-32)/1.8 Altitude, as used in this report, refers to distance above the vertical datum. *Transmissivity: The standard unit for transmissivity is cubic foot per day per square foot times foot of aquifer thickness [(ft3 /d)/ft2 ]ft. In this report, the mathematically reduced form, foot squared per day (ft2 /d), is used for convenience. Specific conductance is given in microsiemens per centimeter at 25 degrees Celsius (µS/cm at 25°C). Concentrations of chemical constituents in water are given either in milligrams per liter (mg/L) or micrograms per liter (µg/L). NOTE TO USGS USERS: Use of hectare (ha) as an alternative name for square hectometer (hm2 ) is restricted to the measurement of small land or water areas. Use of liter (L) as a special name for cubic decimeter (dm3 ) is restricted to the measurement of liquids and gases. No prefix other than milli should be used with liter. Metric ton (t) as a name for megagram (Mg) should be restricted to commercial usage, and no prefixes should be used with it.
  • 15. Porphyry Copper Deposit Model By David A. John, editor, with contributions by Robert A. Ayuso, Mark D. Barton, Richard J. Blakely, Robert J. Bodnar, John H. Dilles, Floyd Gray, Fred T. Graybeal, John C. Mars, Darcy K. McPhee, Robert R. Seal, Ryan D. Taylor, and Peter G. Vikre Abstract This report contains a revised descriptive model of porphyry copper deposits (PCDs), the world’s largest source (about 60 percent) and resource (about 65 percent) of copper and a major source of molybdenum, gold and silver. Despite relatively low grades (average 0.44 percent copper in 2008), PCDs have significant economic and societal impacts due to their large size (commonly hundreds of millions to billions of metric tons), long mine lives (decades), and high produc- tion rates (billions of kilograms of copper per year). The revised model describes the geotectonic setting of PCDs, and provides extensive regional- to deposit-scale descriptions and illustrations of geological, geochemical, geophysical, and geoenvironmental characteristics. Current genetic theories are reviewed and evaluated, knowledge gaps are identified, and a variety of exploration and assessment guides are presented. A summary is included for users seeking overviews of specific topics. Summary of Porphyry Copper Deposit Model (David A. John, Peter G. Vikre, Richard J. Blakely, and Robert R. Seal) Porphyry copper deposits (PCDs) consist of disseminated copper minerals and copper minerals in veins and breccias that are relatively evenly distributed in large volumes of rock, forming high tonnage (greater than 100 million tons), low to moderate grade (0.3–2.0 percent copper) ores. Host rocks are altered and genetically related granitoid porphyry intrusions and adjacent wall rocks. Porphyry copper deposits are the world’s most important source of copper, accounting for more than 60 percent of the annual world copper production and about 65 percent of known copper resources. PCDs also are an important source of other metals, notably molybdenum, gold, and silver. Despite their relatively low grades, PCDs have a significant societal and economic impact due to their large size (commonly hundreds of millions to billions of metric tons), long mine lives, and scale of mining operations. Porphyry copper deposits were the first type of metallic mineral deposit exploited by large-scale, open-pit mining methods in the early 20th century, a low-cost mining technique since adapted to other large-tonnage, low-grade mineral deposits (for example, gold and silver). Associated Commodities and Deposit Types Porphyry copper deposits are mined primarily for copper, although molybdenum and gold are co-products in some deposits, and with silver a by-product in many deposits. Rhenium, tellurium, platinum group elements, arsenic, and zinc are recovered from a few deposits. With increasing molybdenum/copper, porphyry copper deposits are transitional to low fluorine (quartz monzonite type) porphyry molybdenum deposits, and with increasing gold/copper, they are transitional to porphyry gold deposits. A variety of mineral deposits may be genetically associ- ated with porphyry copper deposits, including: • Skarns (including copper, iron, gold, zinc types) • Polymetallic replacement (silver, lead, zinc, copper, gold) • Polymetallic veins (gold, silver, copper, lead, zinc, manganese, arsenic) • Distal disseminated gold-silver (gold, silver) • Epithermal vein (intermediate/low sulfidation gold- silver) • High sulfidation epithermal (gold, silver, copper, arsenic) Regional Environment The regional, deposit-scale, and local-scale environments of porphyry copper deposits are diverse, and despite much scientific study, many features are poorly understood in regard to their relevance as controls of ore formation. Porphyry copper systems are widespread (fig. A1), but they are mostly
  • 16. 2   Porphyry Copper Deposit Model localized in time and space within the evolution of magmatic arcs along convergent plate margins where subduction of oceanic crust and arc-type magmatism generates hydrous, oxidized upper crustal granitoids genetically related to ores. In most cases, arc crust is relatively thick, and there is evidence for broadly coeval compressional or transpressional tectonism. Some authors have suggested that many porphyry copper deposits formed during unusual periods of subduction, includ- ing flat subduction induced by subduction of buoyant oceanic structures, such as ridges, ocean plateaus, and seamount chains, or during episodes of plate reorganization. Within this broadly compressive environment, transpression is expressed as strike-slip faults with significant reverse movement, and it has been suggested that stress relaxation to transtensional or mildly extensional conditions is associated with emplacement of mineralized porphyry intrusions. Some porphyry copper deposits formed in postsubduc- tion magmatic settings in both extensional and compressional environments. Magmas formed in postsubduction settings tend to be small volume, spatially isolated, and mildly alkaline (high-K ± Na calc-alkaline) to strongly alkaline in composi- tion, although some of the world’s largest porphyry copper (gold) deposits are interpreted to have formed in this tectonic setting (for example, Grasberg, Indonesia). Porphyry copper deposits have formed throughout most of Earth’s history, but because they generally form in the upper crust (less than 5–10 km depth) in tectonically unstable convergent plate margins and are prone to erosion, more than 90 percent of known deposits are Cenozoic or Mesozoic in age (see fig. D5). Postmineral faults figure prominently in preser- vation of porphyry copper deposits, but they also present large challenges to exploration and assessment. Fracture and vein systems and breccias are an inevitable consequence of porphyry magmatism. Ascent of intermediate and silicic hydrous magmas into the upper crust from deeper sources is driven by the buoyancy of these magmas that are less dense than the surrounding crust. Where density contrasts decrease in the upper crust, buoyancy forces diminish so that magmas pond to form plutons or batholiths. Hydrous fluids are produced as magmas cool, crystallize, and solidify causing volatile exsolution. Porphyry intrusions may be pluglike and enclosed in both steeply dipping, radial fractures and gently dipping, concen- tric fractures, reflecting stress conditions that are magma- dominated where the two horizontal principal stresses are nearly equal. However, sets of concentric and radial fractures are rarely documented in porphyry copper deposits. Rather, steeply dipping, sheeted, parallel vein and dikelike porphyry intrusions are more common and presumably reflect condi- tions where the two principal horizontal stresses are signifi- cantly different and likely reflect the far-field stress regime. Physical Description of Deposits The dimensions and geometries of porphyry copper deposits vary widely, due in part to post-ore intrusions, the varied types of host rocks that influence deposit morphology, the relative amounts of supergene and hypogene ore, each of which has different configurations, and especially erosion and post-ore deformation including faulting and tilting. For many deposits, large uncertainties arising from incomplete exposure and(or) exploration, post-ore intrusions, and post-ore deforma- tion preclude accurate determination of the original deposit geometry and dimensions. Porphyry copper deposits commonly are centered around small cylindrical porphyry stocks or swarms of dikes that in some cases are demonstrably cupolas of larger underlying plutons or batholiths (see fig. E4). Plan areas of ore-related intrusions typically range from 0.2 to 0.5 km2 . Undeformed deposits commonly have circular or elliptical shapes in plan view, with diameters that typically range from 0.1 to 1.0 km and have vertical dimensions that are similar to their horizon- tal dimensions. In cross section, ore zones vary from cylin- drical shells with altered, but low-grade, interiors referred to as “barren” cores, to inverted cups around barren cores, to multiple domes or inverted cups, and to vertically elongate, elliptical shapes. The vertical extent of hypogene copper ore in porphyry copper deposits is generally less than or equal to 1 to 1.5 km. Because copper-mineralized rock can continue several kilo- meters deeper, the base of ore is dependent on copper grade, the price of copper, mining costs, and mine design. In some deposits, the base of ore represents the limits of drilling. The vertical extent of supergene enriched copper ore varies consid- erably, depending on many factors, but seldom exceeds 200 m (see fig. J1). The total volume of rock affected by heat and(or) fluid flow related to porphyry copper systems commonly is much greater than estimated from the areas of ore zones or visibly altered rock. Volumes of altered rock may extend 10 km or farther outward from the center of porphyry copper miner- alization and to depths as much as 10 km below the paleo- surface (see fig. E4). Distal signatures of porphyry copper deposits include thermal effects in wall rocks reflected by reset fission-track ages, conodont color alteration indices, and bitumen reflectance, dispersion of “pathfinder” elements such as arsenic, antimony, and mercury along fractures and veins, and δ18 O depletion. Distal signatures may extend 10 km or more away from the center of porphyry mineralization along structures.
  • 17. Summary of Porphyry Copper Deposit Model    3 Geophysical Characteristics Modern geophysical methods are widely used in the exploration for and characterization of porphyry copper depos- its (see figs. R1A,B). Regional-scale aeromagnetic, seismic, gravity, and remote-sensing techniques provide insights into the broad crustal structure and magmatic framework that hosts mineralization, whereas deposit-scale aeromagnetic, ground- magnetic, and electromagnetic studies help to characterize mineralization in three dimensions. The very nature of porphyry copper system evolution concentrates minerals of diverse geophysical properties near the topographic surface. To first order, alteration associated with porphyry copper deposition occurs in zones, causing predictable spatial patterns of magnetic properties. High- resolution aeromagnetic and ground-based magnetic surveys can map these zones, thus providing useful exploration tools at deposit scales. Iron and copper sulfides (pyrite, chalcopyrite, chalcocite, and bornite) are distributed throughout most ore and alteration zones. Such minerals typically have low resis- tivities detectable with modern electrical and electromagnetic methods. In particular, the dispersed nature of sulfide minerals in porphyry systems is well suited for induced polarization methods, which measure the chargeability of crustal materi- als. Sophisticated inverse methods applied to electrical and electromagnetic data can help define the three-dimensional framework of porphyry copper deposits. Seismic-reflection and seismic-tomographic methods provide three-dimensional views of seismic velocity, sometimes useful in identifying lithologies surrounding and capping porphyry copper depos- its. Depending on the contrast in density between pluton and host rock, gravity anomalies can help locate and characterize plutons genetically associated with porphyry copper systems. Geophysical interpretations are inherently nonunique, and geology is always complicated. Interpretations must be constrained by independent geologic information, including geologic mapping, multiple geophysical datasets, and subsur- face lithologic and mineralogic information. In areas of good exposure with limited vegetation, remote sensing by airborne and spaceborne multispectral and hyperspectral imaging systems can be used to map alteration mineral associations and their spatial relationships in porphyry copper systems. In particular, hydrothermal minerals charac- teristic of sericitic, intermediate and advanced argillic, and propylitic alteration, iron oxides and hydroxides, and silica can be remotely mapped using their distinctive absorption features in the visible near-infrared through short-wave infrared and thermal infrared wavelengths. Hypogene Ore Characteristics Ore in porphyry copper deposits is rock in which the concentration, value, location, and recoverability of copper and molybdenum, and in some deposits gold, enable mining under predetermined economic requirements. The predominant copper minerals in hypogene ore are chalco­ pyrite, which occurs in nearly all deposits, and bornite, found in about 75 percent of deposits. The only molybdenum mineral of significance, molybdenite, occurs in about 70 percent of deposits. Gold and silver, co-products or by-products in about 30 percent of deposits, are thought to reside in bornite and chalcopyrite; and by-product rhenium is derived from molybdenite. Other hypogene minerals that commonly occur with copper and molybdenum minerals are quartz, pyrite, sericite (muscovite; potassium mica), chlorite, epidote, biotite, potassium feldspar, magnetite, and anhydrite. In some PCDs, hypogene ore includes the copper minerals, tennantite/tetra­ hedrite, enargite, and covellite, which occur with quartz, pyrite, sericite, kaolinite, alunite, and pyrophyllite in sericitic and advanced argillic alteration zones. Hypogene copper and molybdenum minerals account for 1–2 volume percent of hypogene ore and occur in several forms: (1) disseminated in host rocks as discrete, less than or equal to 1-mm anhedral to subhedral crystals that replace feld- spars and other minerals internally and along grain boundaries or in millimeter-to-centimeter clotlike aggregates with hydro- thermal biotite and other silicate, sulfate, and oxide miner- als; (2) in veins, less than 1 millimeter to several centimeters wide, with micrometer to millimeter quartz, pyrite and other hypogene minerals; vein aspect varies from sharply planar veins that are continuous for meters to curvilinear, diffusely margined and discontinuous veins that pinchout within centimeters; and (3) in breccia matrices with quartz and other hypogene minerals, sometimes in millimeter-to-centimeter subhedrons and euhedrons; breccia clasts and matrices vary greatly in aspect, dimension and composition. Copper, molyb- denum, and other hypogene minerals in these three forms are part of the zoned alteration mineral assemblages superimposed on intrusions and wall rocks. Copper grades vary from several tenths of 1 percent to greater than 1 weight percent; in 2008 the average grade was 0.44 percent. In production compilations, hypogene and super- gene copper (see next section) grades are not routinely sepa- rated. Supergene copper sulfide grades are usually higher than hypogene copper grades because of enrichment, but supergene oxide (see next section) ore grades are both higher and lower than hypogene copper grades. The decline in average copper grade from 0.49 percent in 2002 to 0.44 percent in 2008 likely reflects smaller mined tonnages of supergene ore, mining of lower grade ores of both ore types because of increased copper prices and improved mining efficiencies, and increased mining of lower grade copper oxide ores from which copper is rela- tively cheaply recovered by leaching. Thus, an average hypo- gene grade for PCDs cannot be determined from commonly available production statistics. Molybdenum grades vary from less than 0.001 to 0.1 percent; the average molybdenum grade in 2002, 0.018 percent, can be considered average hypogene molyb- denum grade because molybdenum is not significantly enriched by supergene processes. The average grade in 2002 of gold and silver in deposits in which gold and silver were
  • 18. 4   Porphyry Copper Deposit Model recovered was 0.16 gram per ton (g/t) and 2.67 g/t, respec- tively, and grade ranges were 0 to 0.65 g gold/t and 0 to about 10 g silver/t. There are no published data that distinguish hypogene and supergene grades of silver and gold. Supergene Ore Characteristics Supergene ore contains minable copper minerals and a large number of other minerals precipitated from descending, low-pH groundwater that dissolved hypogene copper minerals and redeposited copper in minerals stable in low-temperature, oxidizing environments. Numerous dissolution-precipitation cycles lead to reconcentration of copper in subjacent, later- ally extensive deposits known as supergene oxide deposits and chalcocite enrichment blankets or enriched copper sulfide zones, and less commonly in distal concentrations known as exotic oxide deposits (see fig. J1). The overlying porous rock from which hypogene copper minerals and other rock compo- nents were removed during enrichment is called leached capping. Weathering and enrichment of PCDs is controlled by many factors, including the presence of thick hypogene ore zones; permeability provided by faults, fractures, and stock- work veins; configuration and mineralogy of hypogene altera- tion zones, especially pyrite/copper sulfide and acid-buffering capacity; erosion and oxidation rates (climate), tectonism, topography, and time. Supergene copper oxide ore zones are tens to several hundred meters thick, and consist of tens to several hundred megatons at 0.3 to greater than 1 percent copper. Exotic oxide ore zones are tens to several hundred megatons at 0.3 to greater than 1 percent copper. Enriched copper sulfide ore zones are mostly tens to several hundred meters thick and consist of tens of megatons to greater than 1.5 gigatons at 0.4 to 1.7 percent copper. Enriched copper sulfide ores are invari- ably higher grade than underlying hypogene ore or copper- mineralized rock, whereas grades of copper oxide ore zones are both lower and higher than grades of hypogene sources. Relatively low cost recovery of copper from oxide minerals by acid dissolution and precipitation of copper from solution has enabled processing of low-grade oxide deposits. The thickness of leached capping is highly variable and ranges from 0 to several hundred meters in most PCDs. Common copper minerals in oxide ores include mala- chite, azurite, cuprite, tenorite, chrysocolla, native copper, copper wad, and atacamite; numerous other copper carbon- ate, oxide, silicate, and sulfate minerals are present in small amounts. These minerals occur as crystalline aggregates and crystals that fill fractures and line voids in leached capping, and in micrometer-to-millimeter aggregates that impregnate alteration and primary minerals in enriched copper sulfide ore, and less often, in hypogene ore. The complex paragenetic rela- tionships and disequilibrium mineral associations common in copper oxide ores reflect changing chemical conditions during weathering cycles. Copper in enriched sulfide ore is mostly in sooty to fine- grained chalcocite; lesser copper is derived from covellite and Cux Sy minerals. Forms and distribution of chalcocite largely match the forms and distribution of the sulfide minerals (chal- copyrite and pyrite) in hypogene ore that are replaced by chal- cocite, either completely or partially (rims, internal fractures). Ferrimolybdite is the common molybdenum mineral in copper oxide ores and leached capping; forms (and enrichment) of gold and silver in PCDs are not well documented. Hypogene and Supergene Gangue Characteristics Porphyry copper ore consists mostly (more than 98 per- cent) of valueless minerals, or gangue, that are discarded during processing for recovery of copper, molybdenum, gold, and silver. Gangue includes primary minerals of host rocks, hypogene hydrothermal minerals, and supergene minerals that do not contain recoverable copper and molybdenum. Rock that contains no copper or molybdenum (100 percent gangue minerals), or too little copper and molybdenum for processing, is called waste. Many gangue minerals formed by hypogene and supergene processes have lower densities than the primary rock-forming minerals and hypogene hydrothermal minerals they replace. Lower density gangue minerals, combined with voids created by mineral dissolution, generally decrease physi- cal competency of ore and waste and affect mine design. Hypogene gangue consists of primary rock-forming and hydrothermal minerals, including plagioclase, potassium feld- spar, quartz, micas, chlorite, epidote, amphiboles, pyroxenes, calcite, garnet, aluminum-silicate-sulfate minerals (kaolin- ite, illite, dickite, alunite, andalusite, and pyrophyllite), and accessory minerals (iron-titanium oxides, apatite, and zircon). A large number of other hydrothermal silicate, oxide, sulfate, phosphate, and carbonate minerals locally constitute hypogene hydrothermal gangue. The distribution of primary rock- forming gangue minerals follows the distribution of rock types that compose PCDs, whereas hypogene hydrothermal gangue minerals follow the zoning patterns of copper, molybdenum, and alteration minerals. Although hypogene gangue mineral textures and grain sizes are largely inherited from host rocks, primary host-rock textures and grain sizes are invariably modi- fied by alteration processes to finer grained and often lower density mineral aggregates. Supergene gangue consists of primary rock-forming minerals, hydrothermal minerals, and minerals formed by weathering including silica phases (chalcedony, opal), kaolin- ite, illite, montmorillonite, alunite, limonite (goethite, hema- tite, and jarosite), and manganese oxides. With the exception of goethite, jarosite, and most manganese oxide minerals, common hypogene and supergene gangue minerals are the same species, although illite, kaolinite, and silica minerals commonly are added and locally replace hypogene minerals. Gangue mineral origins often can be distinguished by location,
  • 19. Summary of Porphyry Copper Deposit Model    5 texture, density, mineral associations, and mineral properties (crystallinity, chemical composition, and isotope composition). Textures and grain sizes of supergene gangue usually reflect several cycles of weathering and enrichment. In copper oxide ore near the surface, supergene gangue consists of low-density and porous, fine- to very fine grained aggregates of residual and derivative rock components, mainly silica, kaolinite, and limonite; such ore is essentially mineralized leached capping. In supergene-enriched copper sulfide ore beneath oxide ore, gangue consists of earlier formed supergene minerals and primary rock-forming minerals, and gangue texture is largely inherited from host-rock texture. Ore in PCDs is nearly entirely composed of hypo- gene and supergene gangue minerals, and the physical and chemical properties of gangue minerals, coupled with copper±molybdenum±gold grade, determine feasibility of mining PCDs. Physical properties, including hardness, fracture and vein density, and particle-size distribution after blasting and crushing, determine mining equipment requirements, ore/waste stripping ratios (pit slopes), blast hole density, crushing capacity, truck tire replacement frequency, and mill design. Gangue minerals that react with processing reagents, generate acid (pyrite), and require sulfur control (all sulfide minerals) further influence mill design and copper recov- ery methods. Gangue properties largely control mining and processing (operating) costs, strongly influence capital costs and production rates, and ultimately determine the profitability of producing copper±molybdenum±gold±silver from a PCD. Compositions and textures of iron oxide minerals (limo- nite), often components of gangue, are useful in PCD explora- tion and evaluation because precursor sulfide mineralogy of leached capping (pyrite, chalcopyrite, chalcocite, enargite) can be interpreted by the mineralogy (goethite, hematite, jarosite), color, texture, and origin of residual limonite. Hydrothermal Alteration Hydrothermal alteration refers to metasomatic processes that change the composition, mineralogy, and texture of rocks that constitute a porphyry copper system. In porphyry envi- ronments, wall-rock alteration is intimately linked to narrow veins, commonly 0.1 to 10 cm in width, that typically make up less than 1 to 5 volume percent of ore but also are present in other alteration zones. Hydrothermal alteration is character- ized by ionic metasomatism, including alkali metasomatism and hydrolytic (or acidic) reactions, oxidation-reduction reac- tions (including sulfidation), solubility-induced precipitation reactions, such as quartz precipitation, and hydration-carbon- ation reactions in which water or carbonate is added. Several types of wall-rock alteration characterize porphyry copper ore zones (see fig. E4). These alteration types extend upward and outward several kilometers from deposit centers and are spatially and temporally zoned. Major alteration types commonly present in porphyry copper deposits are (1) potassic, (2) sericitic, (3) advanced argillic, (4) intermediate argillic, (5) propylitic, (6) sodic-calcic and sodic, (7) greisen, and (8) skarn. Potassic alteration includes replacement and vein potassium phases, potassium feldspar and biotite; potassium feldspar addition characteristically is the dominant potassium mineral in silicic or granitic wall rocks, whereas biotite is the dominant potassium mineral in intermediate or mafic compo- sition wall rocks. Sulfide minerals in this alteration include bornite, chalcopyrite, and(or) pyrite. Magnetite, molybdenite, anhydrite, and(or) calcite are other common minerals in this alteration. Potassic alteration is directly associated with abun- dant stockwork quartz-rich veins, including A veins (quartz- bornite-chalcopyrite ±magnetite±anhydrite±calcite), B veins (quartz±copper-iron-sulfides±molybdenite), and transitional AB veins, but also including veins dominated by biotite, magnetite, or copper-iron sulfides. Sericitic alteration forms selvages typically a few centi- meters wide along structurally controlled “D” veins that lie on fractures and faults. Where these veins are closely spaced, this alteration may be pervasive in volumes up to 1 km3 . D veins are dominated by sulfides and minor to major amounts of quartz. Sulfides commonly are strongly zoned from central chalcopyrite-rich veins cutting potassic ore zones upward or outward to pyrite-chalcopyrite veins to pyrite-dominated veins. Late veins tend to be pyrite-rich and may occur at all levels, even below ore zones. Sericitic alteration selvages are characterized by replacement of all rock minerals by fine- grained white potassium-mica (sericite) and quartz accompa- nied by a small percentage of pyrite or specular hematite. Advanced argillic alteration refers to intense hydrolytic alteration and alkali-base cation leaching that forms alkali-free hydrous aluminum silicate minerals (pyrophyllite, dickite, and kaolinite, in order of decreasing thermal stability), local andalusite in high-temperature zones, alunite, and a variety of aluminum, fluorine, and silica-rich minerals, such as topaz, diaspore, zunyite, corundum, and dumortierite and pyrite. Quartz-rich zones in which all aluminum is also removed (residual silica alteration) are common in near-surface zones that are transitional to epithermal environments. Hypo- gene sulfides are dominated by pyrite and copper minerals including enargite, covellite, digenite, and less commonly, tetrahedrite/tennantite. Intermediate argillic alteration refers to clay-bearing assemblages formed by hydrolytic alteration that typically forms at lower temperature than sericitic alteration and at rela- tively low pH but at higher pH than advanced argillic altera- tion at similar temperatures. In this alteration, smectite clay minerals or kaolinite replace plagioclase, igneous potassium feldspar is stable, and ferromagnesian minerals are replaced by chlorite and pyrite. Propylitic alteration refers to alteration of igneous rocks by hydration, carbonation, oxidation, and locally sulfida- tion reactions to form assemblages rich in hydrous minerals and containing minor carbonate, sulfide and(or) hematite. Typical assemblages contain epidote, chlorite, or actinolite and in some cases, pyrite, at higher temperatures and chlorite,
  • 20. 6   Porphyry Copper Deposit Model illite-sericite, or smectite and in some cases, pyrite, at lower temperatures as replacements of calcic plagioclase and ferro- magnesian minerals. Hypogene copper minerals are uncom- mon in propylitic alteration zones. Sodic-calcic and sodic alteration refers to strong alkali alteration in which sodium and commonly calcium minerals are added and potassium and commonly iron minerals are destroyed. Characteristic alteration reactions are sodium-rich plagioclase replacement of potassium feldspar, and Ca-Fe-Mg mineral replacement of potassium-mica. Sodic-plagioclase, actinolite, epidote, chlorite, and titanite are typical added minerals. Calcic-pyroxene, calcic-plagioclase and local Ca-Al-Fe garnet may form at high temperatures (greater than 450°C). Greisen refers to vein-selvage pairs with macro- scopically crystalline hydrothermal muscovite. Greisen consists of veins containing muscovite, quartz, and minor sulfides (pyrite greater than chalcopyrite) with potassium feldspar-muscovite selvages. Skarn refers to Ca-Fe-Mg silicate minerals that have replaced carbonate and other wall rocks. Magnesium silicate minerals are dominant in dolomitic protoliths, and calcium- iron silicate minerals are dominant in limestone protoliths that most commonly host to PCD ores. Early anhydrous skarn typically consists of carbonate minerals replaced by garnet and calcium-rich pyroxene. Later actinolite is characteristic of hydrous skarn assemblages that overprint anhydrous skarn and commonly are associated with chalcopyrite-pyrite, magnetite, and ore formation. Hydrothermal alteration minerals and assemblages are zoned spatially and temporally (see fig. E4). Hydrothermal alteration zones have kilometer-scale vertical and lateral dimensions that show significant variation in geometry, largely as a function of rock composition, depth, and orientation of more permeable zones, such as hydrofractured rock and porphyry dikes. Most notably, potassic and sericitic altera- tion are invariably associated with sulfide mineralization in PCDs and generally are temporally, spatially, and thermally zoned with respect to one another. Potassic alteration tends to be more centrally located, deeper, higher temperature, and earlier compared to sericitic alteration. Advanced argillic and sericitic alteration are commonly zonally arranged around fluid flow conduits, but advanced argillic and intermedi- ate argillic alteration assemblages may be adjacent to one another in the low-temperature and near-surface epithermal quartz-alunite environment overlying some porphyry systems. Advanced argillic alteration generally overlies potassic and sericitic alteration zones. Greisen forms sets of sheeted veins in the deep root zones of some porphyry copper systems that are formed from silicic, hornblende-poor granites. Sodic-calcic and sodic alteration form at deep levels and along the sides of some PCDs. Propylitic alteration in porphyry copper systems generally forms at shallow to moderate depths peripheral to central zones of advanced argillic, sericitic, and potassic alteration; propylitic zones may grade downward into deeper zones of sodic-calcic and sodic alteration. Geochemical Characteristics Geochemical characteristics of porphyry copper deposits result from a large number of physical and chemical processes, including magma generation, differentiation, emplacement, and degassing, high-temperature reactions between degassed fluids, crystallized intrusions, wall rocks, and meteoric and other nonmagmatic water, and near-surface reactions between low-temperature meteoric water and earlier formed, high- temperature minerals. Description of geochemical character- istics can be categorized by the type of material analyzed and analytic strategy; characteristics include lithochemistry of host rocks, minor-element zoning patterns, mineral compositions, and fluid compositions. Major oxide and minor element compositions of premineralization, mineralized, and postmineralization rocks have been collected mainly by mining companies for explora- tion and mining applications. Applications include discrimina- tion of altered from unaltered host rocks by mass gains and losses and distinguishing mineralized from unmineralized intrusions (see fig. M1). The spatial distribution of copper, molybdenum, silver, and gold, has been routinely determined at porphyry copper±molybdenum±gold mines for grade control and mine planning. Abundances of these and other minor elements in rocks, soils, and sediments also have been routinely used in exploring for PCDs (see fig. M3B). More recently, minor- element and isotope analyses of water (surface and subsur- face), gases, and floras have become common components of geochemical exploration programs. The chemical and isotope compositions of hydrous igneous and hydrothermal minerals in PCDs, including biotite, chlorite, epidote, feldspar, amphibole, potassium-mica, and sulfide minerals, have been evaluated for discrimina- tion between mineralized and unmineralized intrusions, for quantification of magmatic variables (temperature, oxidation state, fugacities of H2 O, HCl, HF, H2 ), and to define gradients outward from the central potassic alteration zones, although few data for minerals other than biotite have been published. The physical properties and compositions of hydrother- mal fluids that formed PCDs have been directly determined by petrography, microthermometry, and analysis of fluid inclu- sions and indirectly determined by thermodynamic modeling of equilibrium reactions between hydrous fluids and igneous and hydrothermal mineral assemblages that make up PCDs. Fluid inclusion assemblages, or groups of coeval and unmodi- fied inclusions that represent a single fluid, have been used, in conjunction with alteration assemblages, to interpret processes that form PCDs, including temperatures, pressures, and compositions of ore and alteration fluids, and partitioning of metals and solutes between fluid phases, usually aqueous fluid or brine and water vapor (plus important but variable amounts of CO2 , CH4 , SO2 , H2 S, H2 , and other volatiles). Qualitative determination of the major components, relative ages, and evolution of fluids that formed PCDs, including identification of daughter minerals and some gases,
  • 21. Summary of Porphyry Copper Deposit Model    7 paragenesis of fluid inclusion populations, and recognition of constant or variable phase ratios within populations, can be determined solely by petrographic examination of fluid inclusions in hydrothermal and igneous minerals. Quantitative minor-element compositions of fluids that formed PCDs have been derived entirely from analyses of fluid inclusions, which requires fairly advanced instrumentation. These minor-element analyses show that (1) early magmatic fluids contain elevated concentrations of metals, including Cu, Fe, Zn, Pb, and Mn, and (2) although phase separation during or after volatile exsolution from magma can cause concentration of copper, gold, arsenic, and sulfur into low-density vapor, metal trans- port by aqueous liquid or brine is also effective in concentrat- ing copper in deposits. Stable isotope compositions of waters that form PCDs have been determined directly from fluids extracted from inclusions by crushing or thermal decrepitation of host miner- als in a vacuum (hydrogen, reported as δD in per mil), and from host minerals (hydrogen and oxygen, reported as δ18 O in per mil, corrected for temperature fractionation). Stable isotope compositions indicate multiple water sources in addi- tion to time-space variations in water composition. In general, early potassic alteration and some sericitic (muscovite; potassium-mica) alteration are characterized by water isotope compositions similar to magmatic water. Other sericitic and argillic and advanced argillic (kaolinite, dickite, alunite, pyro- phyllite) alteration waters have δD and δ18 O isotope values that are nearer to the meteoric water line or lower δ18 O isotope values that reflect mixtures of magmatic and meteoric water involved in alteration processes. Sulfur isotope compositions of fluids that deposited sulfide and sulfate minerals in porphyry copper systems comprise a large range because (1) the bulk sulfur isotopic composition of porphyry magmas varies considerably as a result of diverse sources of sulfur, brine-vapor immiscibility, and loss of sulfur during magma ascent; (2) variations in δ34 S values due to the oxidation state of the fluid, which is largely determined by H2 S/SO4 2– , and temperature; and (3) fraction- ation between simultaneously precipitating sulfide and sulfate minerals that can exceed 20 per mil at PCD temperatures. Analyses of coexisting pyrite-anhydrite and pyrite-alunite pairs from several PCDs suggest deposition from relatively oxidizing fluids with H2 S/SO4 2– less than 0.5 to 1 and with variable δ34 SΣS values (about +1 to +10 per mil). Petrology of Associated Igneous Rocks Porphyry copper deposits are centered in high-level intrusive complexes that commonly include stocks, dikes, and breccia pipes. Many deposits are focused in swarms of porphyry dikes that may radiate from larger intrusions or batholiths (see fig. E4). The deposits are formed at shallow (mostly 6 km or less) depth by fluids exsolved from under­ lying crystallizing magmas emplaced at greater than 3–10-km depth in the upper crust and by external waters heated by those magmas. Many known deposits are genetically related to inter- mediate to felsic calc-alkaline magmas in volcano-plutonic arcs formed above active subduction zones. These shallow, subvolcanic complexes typically are composed of multiple intrusions of varying composition. Porphyry copper miner- alization commonly forms near the end of magmatic cycles, and mineralized volcanic wall rocks may be significantly older than the ages of the intrusive rocks and ore. Igneous rocks in porphyry copper deposits range from volcanic rocks through hypabyssal intrusions, including porphyry dikes, breccias, and small stocks, to coarse-grained plutons and batholiths. Plutons and batholiths hosting ore in many districts are older and unrelated to the ore-forming system but may be part of long-lived (millions to more than 10 m.y.) magmatic successions. In other districts, the plutons and batholiths are only slightly older (hundreds of thousands of years) and range from multiple large stocks to compos- ite batholiths. The upper parts of intrusions range in shape from cylindrical to broadly domal. Dike abundances vary from a few isolated dikes forming less than one percent of the rocks exposed in ore zones to dike swarms that host most ore. Multiple sets of porphyry dikes commonly are present in porphyry copper systems, and different sets of porphyry dikes may be pre-, syn-, and(or) post-ore. In tilted systems and in some well-exposed upright systems, successive generations of porphyry dikes emanate from successively deeper levels of the underlying pluton. Textures of igneous rocks in porphyry copper deposits range from fine-grained porphyro-aphanitic to coarse-grained equigranular. Nearly all deposits contain exposures of “porphyry,” which is a strongly porphyritic hypabyssal intru- sive rock with a characteristic aplitic quartz-feldspar ground- mass (crystal sizes 0.02 to 0.3 mm). The aplitic groundmass is interpreted as a quench texture resulting from rapid ascent and loss of volatiles from the magma. Porphyry intrusions typically contain 35–55 percent fine- to medium-grained phenocrysts. The groundmass grain size tends to coarsen with increasing depth and grades to seriate and eventually hypidiomorphic-granular or granitic texture. Intrusive, intrusion, and tectonic breccias are present in most porphyry copper systems. There are wide ranges in the composition of the breccia matrix and fragments and in the dimensions and geometry of these breccias that reflect their variable origins. Some breccias are cemented by hydrothermal minerals including copper sulfide minerals and can form high- grade ore, whereas many igneous breccias are barren and may dilute hypogene ore grades unless they contain older mineral- ized clasts. A wide variety of igneous rock types and compositions are spatially associated with, or host, porphyry copper depos- its. Quartz monzonite, diorite, granodiorite, dacite, andesite, quartz diorite, and monzonite are the most commonly reported rock types. Porphyry intrusions associated with most porphyry copper deposits contain plagioclase phenocrysts; hornblende and biotite are common in intermediate composition intru- sions; clinopyroxene ± orthopyroxene is present in some
  • 22. 8   Porphyry Copper Deposit Model more mafic composition intrusions, and in alkalic intrusions; and biotite, potassium feldspar, and quartz are common in intrusions with more silicic compositions. Common primary accessory minerals are magnetite, ilmenite and(or) titanite, apatite, and zircon. Magmatic anhydrite has been reported in some deposits. Chemical analyses of the least altered rocks in porphyry copper deposits also indicate a wide range of rock compo- sitions. PCDs are associated with multiphase, shallowly emplaced, and moderately evolved granitic rocks (as shown by moderate silica contents and high potassium/rubidium and rubidium/strontium). The mineralizing stocks are oxidized (high whole-rock values of Fe2 O3 /FeO) magnetite-series rocks, and most contain magnetite and titanite. Porphyry copper deposits related to calc-alkaline magmas are enriched in large ion lithophile and fluid-mobile elements (for example, Cs, Rb, Ba, U, K, Pb, and Sr) and are relatively depleted in Nb, Ta, P, and Ti compared to primitive mantle. They also are commonly depleted in manganese and thorium. Mineralized intrusions have highly fractionated rare earth element (REE) patterns, commonly with heavy rare earth element (HREE) and yttrium depletions relative to barren intrusions. Mineralized intru- sions commonly have high lanthanum/ytterbium (40–60), high strontium/yttrium (mostly greater than 20), and chondrite- normalized REE patterns that have small negative or positive europium anomalies. Many of the minor-element and REE compositional features are similar to those of adakites. Radiogenic isotope compositions (Pb-Nd-Sr-Hf-Os) of rocks that make up porphyry copper systems have wide varia- tions. There is a correlation of many porphyry copper magmas with isotopic and chemical compositions similar to adakite, and there is an inferred association of many of these magmas to ridge subduction processes. A wide range of lithologic sources is capable of explaining the observed compositional features, including Mid-Ocean Ridge Basalt (MORB), basaltic oceanic crust, lower crust, delaminated mantle, metasomatized mantle peridotite, and metasomatized lithosphere, and there is multiplicity of inferred tectonic environments that also enlarge the potential sources of porphyry copper system components. The radiogenic isotope data imply that a wide range of contri- butions from normal and enriched mantle, oceanic crust, and crust are involved with porphyry copper metallogenesis. Theory of Ore Deposit Genesis Geologic and geochemical evidence demonstrates that porphyry copper systems are predominantly formed by magmatic fluids that are released during shallow emplacement of porphyritic granitoid stocks. Formation of porphyry copper deposits involves a complex series of processes including magma generation, differentiation, emplacement, crystal- lization and degassing, high-temperature reactions between degassed fluids, crystallized intrusions, wall rocks, and mete- oric and other nonmagmatic waters, and near-surface reactions between low-temperature meteoric water and earlier-formed, high-temperature minerals. Sources of Fluids Geologic studies have long established an intimate relationship between intrusions and zoned, high-temperature vein and alteration mineral assemblages in intrusive and adjacent wall rocks that imply magmatic sources of intro- duced components of PCDs (metals, water, sulfur, chlorine). Similarly, isotopic, fluid inclusion, and melt inclusion studies indicate mostly a magmatic origin for high-temperature fluids that are released during inward crystallization of shallowly emplaced intrusions (second boiling). The formation of many porphyry copper systems involves mixtures of magmatic fluids and nonmagmatic external fluids, although the latter are mostly involved in the waning stages of hydrothermal activ- ity when lower temperatures and hydrostatic pressure allow incursion of external water. External saline waters (sedimen- tary brines) were involved in the earlier stages of evolution of some porphyry copper systems, resulting in sodic and sodic-calcic alteration. Controls on Permeability and Fluid Flow The upper 10 km of continental crust commonly contains groundwater under hydrostatic pressure conditions, in contrast to magma bodies that supply magmatic-hydrothermal fluids to porphyry copper systems at lithostatic pressures. In this environment, mafic magma injection, buoyancy of magmatic- hydrothermal fluids in cupolas of crystallizing magmas, or far-field tectonic stress may produce high strain rates that cause the ductile carapace of the magma chamber to brittlely fracture. Fractures produced by the magmatic-hydrothermal fluid dictate that virtually all magmatic-hydrothermal fluid flows from lithostatic to near-hydrostatic pressure conditions except after fracture sealing by vein minerals. Nonmagmatic fluids are hydrostatically pressured. Fractures typically are dominated by a single strike direction with a vertical dip where far-field tectonic stress fields are dominant, but in some cases, steep radial and shallow concentric fractures are present. These fractures produce parallel or so-called sheeted vein sets and the subparallel porphyry dike orientations typical of most porphyry copper deposits. Where such sheeted frac- tures are dominant, they can extend great distances (more than 5 km) laterally, as well as vertically from the source cupola. They may host porphyry dikes and be hydrothermally altered and provide fluid pathways for entry of external nonmagmatic fluids into the outer part of the hydrothermal system that cause sodic-calcic alteration. Permeability in the column of rock from the cupola to the surface can be maintained as long as temperature/pressure gradients cause magmatic-hydrothermal fluids to ascend from the cupola. When these fluids cease to flow, fracture perme- ability decreases by precipitation of minerals, predominantly
  • 23. Summary of Porphyry Copper Deposit Model    9 quartz, in fractures to form veins. Abundant A and B type quartz veins are precipitated from depressurized and cooled hydrothermal fluids at about 700° to 500°C, but retrograde quartz solubility in the temperature range of 350° to 500°C typically leads to local cycles of local dissolution and precipi- tation, so that fractures do not seal between 500° and 350°C. Chemical Transport and Transfer Processes Fluid-phase separation from porphyry copper magmas fractionates water, metals, sulfur and other volatiles from the crystallizing magma. In a few shallow porphyry plutons (less than 5-km depth), separate brine-rich and vapor-rich fluids may directly separate from magma. In most cases, fluids derived from magma at more than 1.4-kilobar pressure (greater than 5-km depth) are a single, supercritical phase and have moderate to low salinities (about 3–5 weight percent). With declining pressure, single-phase fluids separate into high-salin- ity brine and lower salinity vapor phases. Aqueous brines were thought to be the main agent of metal transport in porphyry copper deposits based on their abundance in fluid inclusions and their high metal contents and transport capacity. Recent studies of fluid inclusion compositions have demonstrated that low-density fluids perform an important function in transport of copper, gold, and sulfur, but that the subordinate mass of brine is also a key to transport of these components, as well as Fe, alkalis, W, Mo, Ag, Pb, and Zn. The relative importance of these two coexisting magmatic fluids in the transport and deposition of ore components is a topic of ongoing research and debate. In some cases, where evidence for separate brine and vapor is rare, moderate- to low-density magmatic fluids formed PCDs (including the giant Butte PCD in Montana). Because the formation of porphyry deposits involves considerable volumes of fluid, a focusing mechanism is required. Most workers conclude that fluid flow foci are the apices (cupolas) of magma chambers, although apices seldom coincide with central volcanic structures where these struc- tures are present. Heat-Transfer Processes In porphyry copper systems, both conduction and advec- tion redistribute the heat that is introduced with magmas. Most magmatic heat lost by conduction causes widespread, rela- tively uniformly distributed contact metamorphism. Magmatic heat is advectively transferred by aqueous fluids expelled from magma chambers and, if permeability is sufficient, by external fluids circulated by convection into thermal haloes of magmas. The amount of heat redistributed by fluids is generally subordinate to conductive heat transport. Advective redistribution of heat becomes dominant only in areas of high and sustained fluid flux, notably in upwelling zones over the tops or edges of intrusions or in highly permeable zones. The principal evidence for advective heat transport comes from the large volumes of high-temperature hydrothermal alteration assemblages in and around intrusions and by the presence of veins. This alteration-centered pattern is expected, given the focused distribution of permeability due to fracturing by magmatic fluids. Pressure Gradients Pressures vary greatly during the formation of porphyry systems, both in host rocks and in ore-forming fluids. Pres- sures during the evolution of porphyry copper systems are governed by the interplay between (1) lithostatic gradients, reflecting the weight of overlying rocks; (2) hydrostatic gradients in hydrologic systems open to the surface; and (3) dynamic contributions related to magma emplacement, fluid release, and evolving thermal structure and permeabil- ity. Fluid pressures are near lithostatic values in the vicinity of magma chambers and decrease to near hydrostatic values above and lateral to the locus of magmatism in areas of lower temperature. Magmatic volatile separation (second boiling) releases considerable mechanical energy because of the large increase in total volume of the system. This energy release creates overpressures that commonly lead to brittle failure (hydrofracturing) of the wall rocks and, at high strain rates, the magmas themselves. Fluid pressure gradients vary markedly in orientation, and these pressure gradients drive fluid flow. Wall-Rock Reaction and Ore-Mineral Deposition Processes Copper-iron sulfide mineral precipitation is largely governed by temperature, availability of sulfur, and pH. The reaction, Cu+ + Fe2+ + 2H2 S + 0.25O2 = CuFeS2 + 3H+ + 0.5H2 O, can be used to understand distribution of copper- iron sulfides. First, low-pH (acidic) conditions tend to keep copper in solution. In low-pH fluids that produce sericitic and advanced argillic alteration, temperatures at which chalco­ pyrite or other copper-iron sulfide minerals are precipitated are depressed with respect to the more neutral environment of potassic alteration. Second, decomposition of ferromagnesian minerals in wall rocks by fluid, such as hydrothermal biotite replacement of igneous hornblende in potassic alteration, both increases pH and supplies Fe2+ to the fluid, thereby resulting in precipitation of chalcopyrite. Third, at high temperatures, oxidized magmatic-hydrothermal fluids have SO2 contents greater than H2 S contents. As the magmatic-hydrothermal fluid cools below 400°C, SO2 disproportionates by reaction with water to form sulfuric acid and H2 S, and H2 S combines with aqueous metal species to form copper-iron sulfide minerals. Gold is likely transported as a bisulfide or other sulfur complex, and where sulfur is removed from the hydrother- mal fluid during copper-iron sulfide and pyrite precipitation, gold is also precipitated, usually as solid solution in bornite or chalcopyrite. Molybdenum likely is transported as molyb- denum hydroxide complex at high temperature. High fluid