SlideShare ist ein Scribd-Unternehmen logo
1 von 16
Downloaden Sie, um offline zu lesen
September 2022 Monthly Snapshot
One-Year Change in One-Year Change in
Median Sales Price Single
Family
Median Sales Price
Condo/TIC/Coop
2
3
4
5
6
7
8
9
10
11
12
13
14
15
16
Current as of October 11, 2022. All data from the San Francisco Association of REALTORS® MLS. Report © 2022 ShowingTime.
Condo/TIC/Coop Activity Overview
Inventory of Active Listings
% of Properties Sold Over List Price
% of List Price Received
Housing Affordability Ratio
All Properties Activity Overview
New Listings
Pending Sales
Sold Listings
Median Sales Price
Average Sales Price
Days on Market Until Sale
Activity by District
Monthly Indicators
- 5.7% - 2.5% - 5.9%
One-Year Change in
The U.S. real estate market continues to slow as we move into fall, as rising
consumer prices and higher mortgage interest rates squeeze homebuyer
budgets and cool activity. With inflation showing little sign of abating, the
Federal Reserve implemented another 75-basis-point hike in September,
marking the third such rate increase this year. The cost of borrowing has
reached multi-year highs on everything from credit cards to auto loans in 2022
as mortgage interest rates topped 6% for the first time since 2008, causing
existing home sales to decline for the seventh consecutive month.
New Listings were down 13.2 percent for single family homes and 19.8 percent
for Condo/TIC/Coop properties. Pending Sales decreased 38.2 percent for
single family homes and 28.8 percent for Condo/TIC/Coop properties.
The Median Sales Price was down 5.7 percent to $1,650,000 for single family
homes and 2.5 percent to $1,170,000 for Condo/TIC/Coop properties. Months
Supply of Inventory increased 16.7 percent for single family units but remained
flat for Condo/TIC/Coop units.
Affordability challenges have priced many buyers out of the market this year,
and buyers who do succeed in purchasing a home are finding that the costs of
homeownership have increased significantly, with monthly mortgage payments
more than 55% higher than a year ago, according to the National Association of
REALTORS®. Inventory remains lower than normal, and as the market continue
to shift, experts project homes will begin to spend more days on market and
price growth will slow in the months ahead.
Median Sales Price
All Property Types
Residential real estate activity in San Francisco County (Districts 1-10)
composed of single-family properties, townhomes and condominiums. Percent
changes are calculated using rounded figures.
Single Family Activity Overview
Months Supply of Inventory
For questions or more information, contact
communications@sfrealtors.com.
Single Family Activity Overview
Key metrics by report month and for year-to-date (YTD) starting from the first of the year.
Key Metrics Historical Sparkbars 9-2021 9-2022 Percent Change YTD 2021 YTD 2022 Percent Change
- 7.5%
2,658
1,882 - 15.7%
$1,826,500 + 1.5%
- 0.7%
Pending Sales 330 204 - 38.2% - 18.5%
2,368 1,931
New Listings 424 368 - 13.2% 2,874
Sold Listings 245 177 - 27.8% 2,232
Median Sales Price $1,750,000 $1,650,000 - 5.7% $1,800,000
21 - 12.5%
$2,275,779
-- --
Days on Market 23 27 + 17.4% 24
Avg. Sales Price $2,165,489 $1,881,048 - 13.1% $2,292,888
Active Listings 475 462 - 2.7% --
% of Properties Sold Over List Price 84.5% 67.2% - 20.5% 78.0%
31
82.4% + 5.6%
+ 2.2%
22 - 29.0%
117.0%
% of List Price Received 116.3% 108.6% - 6.6% 114.5%
Current as of October 11, 2022. All data from the San Francisco Association of REALTORS® MLS. Report © 2022 ShowingTime. | 2
Months Supply 1.8 2.1 + 16.7% -- -- --
Affordability Ratio 32 24 - 25.0%
9-2019 9-2020 9-2021 9-2022
9-2019 9-2020 9-2021 9-2022
9-2019 9-2020 9-2021 9-2022
9-2019 9-2020 9-2021 9-2022
9-2019 9-2020 9-2021 9-2022
9-2019 9-2020 9-2021 9-2022
9-2019 9-2020 9-2021 9-2022
9-2019 9-2020 9-2021 9-2022
9-2019 9-2020 9-2021 9-2022
9-2019 9-2020 9-2021 9-2022
9-2019 9-2020 9-2021 9-2022
Condo/TIC/Coop Activity Overview
Key metrics by report month and for year-to-date (YTD) starting from the first of the year.
Key Metrics Historical Sparkbars 9-2021 9-2022 Percent Change YTD 2021 YTD 2022 Percent Change
- 6.4%
Pending Sales 337 240 - 28.8% 3,495 2,616 - 25.2%
New Listings 722 579 - 19.8% 4,700 4,398
Sold Listings 292 207 - 29.1% 3,393 2,560 - 24.6%
Median Sales Price $1,200,000 $1,170,000 - 2.5% $1,200,000 $1,200,000 0.0%
+ 2.0%
42 - 10.6%
$1,383,346
-- --
Days on Market 40 59 + 47.5% 47
Avg. Sales Price $1,332,052 $1,351,225 + 1.4% $1,356,690
Active Listings 1,302 1,053 - 19.1% --
% of Properties Sold Over List Price 54.5% 31.4% - 42.4% 47.5%
55
51.2% + 7.8%
+ 0.9%
38 - 30.9%
104.5%
% of List Price Received 105.0% 100.7% - 4.1% 103.6%
Current as of October 11, 2022. All data from the San Francisco Association of REALTORS® MLS. Report © 2022 ShowingTime. | 3
Months Supply 3.5 3.5 0.0% -- -- --
Affordability Ratio 55 39 - 29.1%
9-2019 9-2020 9-2021 9-2022
9-2019 9-2020 9-2021 9-2022
9-2019 9-2020 9-2021 9-2022
9-2019 9-2020 9-2021 9-2022
9-2019 9-2020 9-2021 9-2022
9-2019 9-2020 9-2021 9-2022
9-2019 9-2020 9-2021 9-2022
9-2019 9-2020 9-2021 9-2022
9-2019 9-2020 9-2021 9-2022
9-2019 9-2020 9-2021 9-2022
9-2019 9-2020 9-2021 9-2022
New Listings
New Listings
Single
Family
Year-Over-Year
Change
Condo/TIC/
Coop
Year-Over-Year
Change
Oct-2021 333 -21.3% 529 -12.7%
Nov-2021 171 -29.3% 265 -1.5%
Dec-2021 83 -33.1% 147 -7.5%
Jan-2022 228 -10.2% 472 -12.3%
Feb-2022 288 +14.7% 535 +6.4%
Mar-2022 343 +5.9% 613 +13.5%
Apr-2022 329 -4.9% 542 +0.2%
May-2022 302 -15.2% 516 +1.2%
Jun-2022 321 -4.5% 451 -9.8%
Jul-2022 240 -21.6% 379 -17.2%
Aug-2022 239 -13.7% 311 -19.8%
Sep-2022 368 -13.2% 579 -19.8%
12-Month Avg 270 -11.4% 445 -6.9%
Historical New Listings by Month
Current as of October 11, 2022. All data from the San Francisco Association of REALTORS® MLS. Report © 2022 ShowingTime. | 4
A count of the properties that have been newly listed on the market in a given month.
428
754
424
722
368
579
Single Family Condo/TIC/Coop
September
0
200
400
600
800
1-2005 1-2006 1-2007 1-2008 1-2009 1-2010 1-2011 1-2012 1-2013 1-2014 1-2015 1-2016 1-2017 1-2018 1-2019 1-2020 1-2021 1-2022
Single Family Condo/TIC/Coop
2,546
4,224
2,874
4,700
2,658
4,398
Single Family Condo/TIC/Coop
Year to Date
2020 2021 2022
- 19.8%
- 4.2%
- 13.2%
- 0.9% + 11.3%
- 7.5%
+ 12.9% - 6.4%
2020 2021 2022 2020 2021 2022 2020 2021 2022
+ 2.6% + 6.1% + 29.3%
+ 15.1%
Pending Sales
Pending Sales
Single
Family
Year-Over-Year
Change
Condo/TIC/
Coop
Year-Over-Year
Change
Oct-2021 273 -12.2% 405 +21.6%
Nov-2021 259 -15.6% 360 +20.0%
Dec-2021 129 -36.5% 226 -26.4%
Jan-2022 145 -15.2% 251 -14.0%
Feb-2022 216 -4.4% 287 -24.7%
Mar-2022 288 -0.3% 436 -8.0%
Apr-2022 269 -5.9% 344 -28.3%
May-2022 249 -18.9% 333 -28.1%
Jun-2022 198 -27.7% 262 -32.5%
Jul-2022 184 -29.0% 224 -38.5%
Aug-2022 178 -21.2% 239 -24.4%
Sep-2022 204 -38.2% 240 -28.8%
12-Month Avg 216 -18.7% 301 -18.7%
Historical Pending Sales by Month
Current as of October 11, 2022. All data from the San Francisco Association of REALTORS® MLS. Report © 2022 ShowingTime. | 5
A count of the properties on which offers have been accepted in a given month.
281
306
330 337
204
240
Single Family Condo/TIC/Coop
September
0
100
200
300
400
500
600
1-2005 1-2006 1-2007 1-2008 1-2009 1-2010 1-2011 1-2012 1-2013 1-2014 1-2015 1-2016 1-2017 1-2018 1-2019 1-2020 1-2021 1-2022
Single Family Condo/TIC/Coop
1,698
1,910
2,368
3,495
1,931
2,616
Single Family Condo/TIC/Coop
Year to Date
2020 2021 2022
- 28.8%
+ 10.1%
- 38.2%
+ 17.4% + 83.0%
- 18.5%
+ 39.5% - 25.2%
2020 2021 2022 2020 2021 2022 2020 2021 2022
+ 29.5% - 7.1% - 13.2%
+ 33.6%
Sold Listings
Sold Listings
Single
Family
Year-Over-Year
Change
Condo/TIC/
Coop
Year-Over-Year
Change
Oct-2021 310 +1.6% 364 +24.7%
Nov-2021 293 +3.2% 425 +24.6%
Dec-2021 216 -28.5% 325 -7.9%
Jan-2022 130 -19.3% 186 -31.1%
Feb-2022 159 -2.5% 250 -10.1%
Mar-2022 257 -5.2% 394 -13.8%
Apr-2022 257 -11.1% 378 -18.2%
May-2022 282 +6.0% 368 -17.1%
Jun-2022 249 -23.6% 309 -34.7%
Jul-2022 183 -28.2% 232 -37.1%
Aug-2022 188 -26.6% 236 -32.2%
Sep-2022 177 -27.8% 207 -29.1%
12-Month Avg 225 -13.5% 306 -16.1%
Historical Sold Listings by Month
Current as of October 11, 2022. All data from the San Francisco Association of REALTORS® MLS. Report © 2022 ShowingTime. | 6
A count of the actual sales that closed in a given month.
257
323
245
292
177
207
Single Family Condo/TIC/Coop
September
0
100
200
300
400
500
1-2005 1-2006 1-2007 1-2008 1-2009 1-2010 1-2011 1-2012 1-2013 1-2014 1-2015 1-2016 1-2017 1-2018 1-2019 1-2020 1-2021 1-2022
Single Family Condo/TIC/Coop
1,572
1,802
2,232
3,393
1,882
2,560
Single Family Condo/TIC/Coop
Year to Date
2020 2021 2022
- 29.1%
- 9.6%
- 27.8%
- 4.7% + 88.3%
- 15.7%
+ 42.0% - 24.6%
2020 2021 2022 2020 2021 2022 2020 2021 2022
+ 77.2% - 9.3% - 15.0%
+ 75.5%
Median Sales Price
Median Sales Price
Single
Family
Year-Over-Year
Change
Condo/TIC/
Coop
Year-Over-Year
Change
Oct-2021 $1,805,000 +12.5% $1,247,000 +8.2%
Nov-2021 $1,880,000 +14.8% $1,260,000 +7.5%
Dec-2021 $1,690,000 +9.0% $1,300,000 +18.2%
Jan-2022 $1,630,000 +3.5% $1,070,000 -0.2%
Feb-2022 $1,930,000 +17.0% $1,227,500 +2.6%
Mar-2022 $2,000,000 +15.9% $1,206,750 -1.2%
Apr-2022 $2,050,000 +13.9% $1,370,000 +14.2%
May-2022 $2,007,500 +6.4% $1,215,000 -1.1%
Jun-2022 $1,880,000 -3.1% $1,240,000 -0.8%
Jul-2022 $1,670,000 -9.7% $1,198,500 -1.0%
Aug-2022 $1,617,500 -12.4% $997,500 -13.3%
Sep-2022 $1,650,000 -5.7% $1,170,000 -2.5%
12-Month Avg* $1,825,000 +4.3% $1,225,000 +2.5%
Historical Median Sales Price by Month
* Median Sales Price for all properties from October 2021 through September 2022. This is not
the average of the individual figures above.
Current as of October 11, 2022. All data from the San Francisco Association of REALTORS® MLS. Report © 2022 ShowingTime. | 7
Point at which half of the sales sold for more and half sold for less, not accounting for seller concessions, in a given month.
$1,650,000
$1,175,000
$1,750,000
$1,200,000
$1,650,000
$1,170,000
Single Family Condo/TIC/Coop
September
$500,000
$750,000
$1,000,000
$1,250,000
$1,500,000
$1,750,000
$2,000,000
$2,250,000
1-2005 1-2006 1-2007 1-2008 1-2009 1-2010 1-2011 1-2012 1-2013 1-2014 1-2015 1-2016 1-2017 1-2018 1-2019 1-2020 1-2021 1-2022
Single Family Condo/TIC/Coop
$1,620,250
$1,200,000
$1,800,000
$1,200,000
$1,826,500
$1,200,000
Single Family Condo/TIC/Coop
Year to Date
2020 2021 2022
- 2.5%
+ 2.1%
- 5.7%
+ 6.1% 0.0%
+ 1.5%
+ 11.1% 0.0%
2020 2021 2022 2020 2021 2022 2020 2021 2022
+ 8.2% + 2.8% - 0.4%
- 9.6%
Average Sales Price
Average Sales
Price
Single
Family
Year-Over-Year
Change
Condo/TIC/
Coop
Year-Over-Year
Change
Oct-2021 $2,359,157 +23.7% $1,461,587 +16.7%
Nov-2021 $2,352,087 +15.5% $1,538,838 +21.1%
Dec-2021 $2,365,749 +17.5% $1,488,734 +16.1%
Jan-2022 $1,971,756 +1.3% $1,311,263 +8.3%
Feb-2022 $2,417,245 +7.1% $1,398,389 +4.0%
Mar-2022 $2,534,210 +14.6% $1,411,860 +3.1%
Apr-2022 $2,515,877 +3.5% $1,467,459 +8.9%
May-2022 $2,411,895 -2.7% $1,403,132 +1.7%
Jun-2022 $2,355,940 -5.8% $1,366,119 -1.5%
Jul-2022 $2,061,331 -10.1% $1,471,068 +8.4%
Aug-2022 $1,954,903 -8.1% $1,175,621 -17.5%
Sep-2022 $1,881,048 -13.1% $1,351,225 +1.4%
12-Month Avg* $2,300,822 +4.4% $1,418,417 +6.1%
Historical Average Sales Price by Month
* Avg. Sales Price for all properties from October 2021 through September 2022. This is not the
average of the individual figures above.
Current as of October 11, 2022. All data from the San Francisco Association of REALTORS® MLS. Report © 2022 ShowingTime. | 8
Average sales price for all closed sales, not accounting for seller concessions, in a given month.
$1,896,046
$1,306,022
$2,165,489
$1,332,052
$1,881,048
$1,351,225
Single Family Condo/TIC/Coop
September
$500,000
$1,000,000
$1,500,000
$2,000,000
$2,500,000
$3,000,000
1-2005 1-2006 1-2007 1-2008 1-2009 1-2010 1-2011 1-2012 1-2013 1-2014 1-2015 1-2016 1-2017 1-2018 1-2019 1-2020 1-2021 1-2022
Single Family Condo/TIC/Coop
$2,015,770
$1,341,438
$2,292,888
$1,356,690
$2,275,779
$1,383,346
Single Family Condo/TIC/Coop
Year to Date
2020 2021 2022
+ 1.4%
+ 2.0%
- 13.1%
+ 14.2% + 1.1%
- 0.7%
+ 13.7% + 2.0%
2020 2021 2022 2020 2021 2022 2020 2021 2022
- 4.6% + 1.6% - 0.0%
- 9.2%
Days on Market Until Sale
Days on Market
Until Sale
Single
Family
Year-Over-Year
Change
Condo/TIC/
Coop
Year-Over-Year
Change
Oct-2021 20 -31.0% 36 -14.3%
Nov-2021 21 -38.2% 41 -19.6%
Dec-2021 31 -13.9% 47 -26.6%
Jan-2022 41 +2.5% 68 -9.3%
Feb-2022 22 -35.3% 36 -45.5%
Mar-2022 16 -38.5% 34 -29.2%
Apr-2022 16 -20.0% 31 -34.0%
May-2022 21 +5.0% 37 -5.1%
Jun-2022 17 -10.5% 39 +5.4%
Jul-2022 21 +10.5% 49 +16.7%
Aug-2022 26 +4.0% 50 +16.3%
Sep-2022 27 +17.4% 59 +47.5%
12-Month Avg* 22 -16.8% 42 -13.5%
Historical Days on Market Until Sale by Month
* Days on Market for all properties from October 2021 through September 2022. This is not the
average of the individual figures above.
Current as of October 11, 2022. All data from the San Francisco Association of REALTORS® MLS. Report © 2022 ShowingTime. | 9
Average number of days between when a property is listed and when an offer is accepted in a given month.
27
48
23
40
27
59
Single Family Condo/TIC/Coop
September
0
20
40
60
80
100
120
1-2005 1-2006 1-2007 1-2008 1-2009 1-2010 1-2011 1-2012 1-2013 1-2014 1-2015 1-2016 1-2017 1-2018 1-2019 1-2020 1-2021 1-2022
Single Family Condo/TIC/Coop
27
42
24
47
21
42
Single Family Condo/TIC/Coop
Year to Date
2020 2021 2022
+ 47.5%
- 16.7%
+ 17.4%
- 14.8% + 11.9%
- 12.5%
- 11.1% - 10.6%
2020 2021 2022 2020 2021 2022 2020 2021 2022
- 10.0% - 3.6% + 5.0%
+ 17.1%
Inventory of Active Listings
Inventory of Active
Listings
Single
Family
Year-Over-Year
Change
Condo/TIC/
Coop
Year-Over-Year
Change
Oct-2021 490 -35.4% 1,304 -36.9%
Nov-2021 365 -41.7% 1,093 -39.9%
Dec-2021 207 -48.1% 677 -40.8%
Jan-2022 264 -34.3% 834 -33.1%
Feb-2022 303 -20.3% 994 -19.6%
Mar-2022 321 -12.3% 1,049 -8.7%
Apr-2022 340 -13.5% 1,111 -0.1%
May-2022 335 -17.3% 1,119 +4.5%
Jun-2022 380 -8.7% 1,095 +3.3%
Jul-2022 364 -14.4% 1,007 -5.1%
Aug-2022 348 -19.3% 873 -14.8%
Sep-2022 462 -2.7% 1,053 -19.1%
12-Month Avg* 348 -23.7% 1,017 -20.2%
Historical Inventory of Active Listings by Month
* Active Listings for all properties from October 2021 through September 2022. This is not the
average of the individual figures above.
Current as of October 11, 2022. All data from the San Francisco Association of REALTORS® MLS. Report © 2022 ShowingTime. | 10
The number of properties available for sale in active status at the end of a given month.
710
1,948
475
1,302
462
1,053
Single Family Condo/TIC/Coop
September
0
500
1,000
1,500
2,000
2,500
1-2005 1-2006 1-2007 1-2008 1-2009 1-2010 1-2011 1-2012 1-2013 1-2014 1-2015 1-2016 1-2017 1-2018 1-2019 1-2020 1-2021 1-2022
Single Family Condo/TIC/Coop
2020 2021 2022
- 19.1%
- 33.2%
- 2.7%
- 33.1%
2020 2021 2022
+ 33.0% + 106.4%
% of Properties Sold Over List Price
% of Properties
Sold Over List Price
Single
Family
Year-Over-Year
Change
Condo/TIC/
Coop
Year-Over-Year
Change
Oct-2021 84.5% +25.2% 60.7% +41.8%
Nov-2021 79.5% +29.1% 55.8% +70.1%
Dec-2021 78.7% +25.1% 46.5% +62.6%
Jan-2022 75.4% +30.4% 38.7% +76.7%
Feb-2022 86.8% +27.5% 58.4% +65.4%
Mar-2022 86.4% +17.1% 58.1% +35.4%
Apr-2022 88.7% +16.6% 63.0% +39.4%
May-2022 86.9% +9.0% 55.3% +3.6%
Jun-2022 86.3% +5.0% 57.3% +5.5%
Jul-2022 78.1% -6.5% 40.1% -27.9%
Aug-2022 76.1% -9.8% 37.3% -31.7%
Sep-2022 67.2% -20.5% 31.4% -42.4%
12-Month Avg 82.0% +10.9% 52.3% +17.5%
Historical % of Properties Sold Over List Price by Month
* % of Properties Sold Over List Price for all properties from October 2021 through September
2022. This is not the average of the individual figures above.
Current as of October 11, 2022. All data from the San Francisco Association of REALTORS® MLS. Report © 2022 ShowingTime. | 11
Percentage found when dividing the number of properties sold by properties sold over its original list price, not accounting for seller
concessions.
65.0%
34.4%
84.5%
54.5%
67.2%
31.4%
Single Family Condo/TIC/Coop
September
0.0%
20.0%
40.0%
60.0%
80.0%
100.0%
1-2005 1-2006 1-2007 1-2008 1-2009 1-2010 1-2011 1-2012 1-2013 1-2014 1-2015 1-2016 1-2017 1-2018 1-2019 1-2020 1-2021 1-2022
Single Family Condo/TIC/Coop
66.2%
43.7%
78.0%
47.5%
82.4%
51.2%
Single Family Condo/TIC/Coop
Year to Date
2020 2021 2022
- 42.4%
+ 58.4%
- 20.5%
+ 30.0% + 8.7%
+ 5.6%
+ 17.8% + 7.8%
2020 2021 2022 2020 2021 2022 2020 2021 2022
- 12.8% - 14.0% - 25.6%
- 41.4%
% of List Price Received
% of List Price
Received
Single
Family
Year-Over-Year
Change
Condo/TIC/
Coop
Year-Over-Year
Change
Oct-2021 117.0% +8.2% 105.5% +4.1%
Nov-2021 114.8% +8.3% 104.6% +4.4%
Dec-2021 114.3% +7.8% 103.5% +4.2%
Jan-2022 117.4% +11.5% 101.1% +2.4%
Feb-2022 121.2% +10.5% 106.1% +5.4%
Mar-2022 121.9% +8.7% 106.4% +3.9%
Apr-2022 123.1% +8.2% 107.3% +3.5%
May-2022 119.6% +2.4% 105.9% +0.7%
Jun-2022 116.8% +0.5% 105.3% 0.0%
Jul-2022 110.9% -6.4% 101.5% -3.1%
Aug-2022 108.4% -6.6% 100.7% -3.5%
Sep-2022 108.6% -6.6% 100.7% -4.1%
12-Month Avg* 116.6% +3.8% 104.5% +1.6%
Historical % of List Price Received by Month
* % of List Price Received for all properties from October 2021 through September 2022. This is
not the average of the individual figures above.
Current as of October 11, 2022. All data from the San Francisco Association of REALTORS® MLS. Report © 2022 ShowingTime. | 12
Percentage found when dividing a property’s sales price by its most recent list price, then taking the average for all properties sold in a given
month, not accounting for seller concessions.
106.8%
100.2%
116.3%
105.0%
108.6%
100.7%
Single Family Condo/TIC/Coop
September
108.0%
101.7%
114.5%
103.6%
117.0%
104.5%
Single Family Condo/TIC/Coop
Year to Date
90.0%
100.0%
110.0%
120.0%
130.0%
1-2005 1-2006 1-2007 1-2008 1-2009 1-2010 1-2011 1-2012 1-2013 1-2014 1-2015 1-2016 1-2017 1-2018 1-2019 1-2020 1-2021 1-2022
Single Family Condo/TIC/Coop
2020 2021 2022
- 4.1%
+ 4.8%
- 6.6%
+ 8.9%
2020 2021 2022
- 5.2% - 4.5%
2020 2021 2022
+ 0.9%
+ 1.9%
+ 2.2%
+ 6.0%
2020 2021 2022
- 4.2% - 3.6%
Housing Affordability Ratio
Housing
Affordability Ratio
Single
Family
Year-Over-Year
Change
Condo/TIC/
Coop
Year-Over-Year
Change
Oct-2021 31 -13.9% 53 -10.2%
Nov-2021 30 -14.3% 54 -8.5%
Dec-2021 32 -13.5% 49 -21.0%
Jan-2022 32 -11.1% 57 -9.5%
Feb-2022 27 -18.2% 49 -7.5%
Mar-2022 24 -25.0% 45 -13.5%
Apr-2022 21 -32.3% 37 -32.7%
May-2022 22 -26.7% 42 -22.2%
Jun-2022 23 -17.9% 40 -23.1%
Jul-2022 27 -10.0% 43 -20.4%
Aug-2022 28 -6.7% 51 -10.5%
Sep-2022 24 -25.0% 39 -29.1%
12-Month Avg* 27 -26.2% 46 -30.8%
Historical Housing Affordability Ratio by Month
* Affordability Ratio for all properties from October 2021 through September 2022. This is not the
average of the individual figures above.
Current as of October 11, 2022. All data from the San Francisco Association of REALTORS® MLS. Report © 2022 ShowingTime. | 13
This index measures housing affordability for the region. For example, an index of 120 means the median household income is 120% of what is
necessary to qualify for the median-priced home under prevailing interest rates. A higher number means greater affordability.
35
57
32
55
24
39
Single Family Condo/TIC/Coop
September
20
40
60
80
100
1-2005 1-2006 1-2007 1-2008 1-2009 1-2010 1-2011 1-2012 1-2013 1-2014 1-2015 1-2016 1-2017 1-2018 1-2019 1-2020 1-2021 1-2022
Single Family Condo/TIC/Coop
2020 2021 2022
- 29.1%
- 3.5%
- 25.0%
- 8.6%
2020 2021 2022
0.0% + 18.8%
35
56
31
55
22
38
Single Family Condo/TIC/Coop
Year to Date
2020 2021 2022
- 30.9%
- 1.8%
- 29.0%
- 11.4%
2020 2021 2022
+ 2.9% + 7.7%
Months Supply of Inventory
Months Supply of
Inventory
Single
Family
Year-Over-Year
Change
Condo/TIC/
Coop
Year-Over-Year
Change
Oct-2021 1.9 -51.3% 3.5 -62.8%
Nov-2021 1.4 -54.8% 2.9 -64.2%
Dec-2021 0.8 -57.9% 1.8 -62.5%
Jan-2022 1.1 -42.1% 2.3 -54.0%
Feb-2022 1.2 -29.4% 2.7 -42.6%
Mar-2022 1.3 -18.8% 2.9 -27.5%
Apr-2022 1.4 -12.5% 3.2 -8.6%
May-2022 1.4 -12.5% 3.3 +6.5%
Jun-2022 1.6 0.0% 3.4 +13.3%
Jul-2022 1.6 0.0% 3.2 +10.3%
Aug-2022 1.5 -6.3% 2.8 0.0%
Sep-2022 2.1 +16.7% 3.5 0.0%
12-Month Avg* 1.4 -27.4% 3.0 -35.4%
Historical Months Supply of Inventory by Month
* Months Supply for all properties from October 2021 through September 2022. This is not the
average of the individual figures above.
Current as of October 11, 2022. All data from the San Francisco Association of REALTORS® MLS. Report © 2022 ShowingTime. | 14
The inventory of homes for sale at the end of a given month, divided by the average monthly pending sales from the last 12 months.
3.7
8.9
1.8
3.5
2.1
3.5
Single Family Condo/TIC/Coop
September
0.0
2.0
4.0
6.0
8.0
10.0
12.0
1-2005 1-2006 1-2007 1-2008 1-2009 1-2010 1-2011 1-2012 1-2013 1-2014 1-2015 1-2016 1-2017 1-2018 1-2019 1-2020 1-2021 1-2022
Single Family Condo/TIC/Coop
2020 2021 2022
0.0%
- 60.7%
+ 16.7%
- 51.4%
2020 2021 2022
+ 42.3% + 128.2%
All Properties Activity Overview
Key metrics by report month and for year-to-date (YTD) starting from the first of the year.
Key Metrics Historical Sparkbars 9-2021 9-2022 Percent Change YTD 2021 YTD 2022 Percent Change
- 7.2%
Pending Sales 676 454 - 32.8% 5,931 4,602 - 22.4%
New Listings 1,162 960 - 17.4% 7,692 7,139
Sold Listings 546 391 - 28.4% 5,694 4,494 - 21.1%
Median Sales Price $1,450,000 $1,365,000 - 5.9% $1,410,000 $1,470,000 + 4.3%
+ 1.7%
34 - 10.5%
$1,756,692
-- --
Days on Market 32 44 + 37.5% 38
Avg. Sales Price $1,711,273 $1,587,402 - 7.2% $1,727,930
Active Listings 1,824 1,544 - 15.4% --
% of Properties Sold Over List Price 68.5% 47.6% - 30.5% 59.5%
38
64.3% + 8.1%
+ 1.7%
26 - 31.6%
109.7%
% of List Price Received 110.0% 104.2% - 5.3% 107.9%
Current as of October 11, 2022. All data from the San Francisco Association of REALTORS® MLS. Report © 2022 ShowingTime. | 15
Months Supply 2.8 3.0 + 7.1% -- -- --
Affordability Ratio 39 29 - 25.6%
9-2019 9-2020 9-2021 9-2022
9-2019 9-2020 9-2021 9-2022
9-2019 9-2020 9-2021 9-2022
9-2019 9-2020 9-2021 9-2022
9-2019 9-2020 9-2021 9-2022
9-2019 9-2020 9-2021 9-2022
9-2019 9-2020 9-2021 9-2022
9-2019 9-2020 9-2021 9-2022
9-2019 9-2020 9-2021 9-2022
9-2019 9-2020 9-2021 9-2022
9-2019 9-2020 9-2021 9-2022
Activity by District
SF District 1: Northwest (Sea Cliff, Lake, Jordan Park / Laurel Heights, Outer Richmond, Central Richmond, Inner Richmond, Lone Mountain)
SF District 2: Central West (Outer Sunset, Central Sunset, Inner Sunset, Outer Parkside, Parkside, Inner Parkside, Golden Gate Heights)
SF District 3: Southwest (Pine Lake Park, Lake Shore, Merced Manor, Stonestown, Lakeside, Merced Heights, Ingleside, Ingleside Heights, Oceanview)
SF District 4: Twin Peaks W (Forest Hill (& Ext), W Portal, St Francis Wd, Balboa Terr, Mt Dav Manor, Ingleside Terr, Monterey Hts, Wstwd Pk & H'lnds, Shrwd Fst, Miraloma Pk, Dmnd Hts, Mdtwn Terr)
SF District 5: Central (Haight Ashbury, Cole Vly / Prnssus Hts, Clarndn Hts, Corona Hts, Twin Pks, Glen Pk, Noe Vly, Eureka Vly / Dolores Hts, Mission Dolores, Duboce Trngl, Buena Vista / Ashbury Hts)
SF District 6: Central North (Lower Pacific Heights, Anza Vista, Western Addition, North Panhandle, Alamo Square, Hayes Valley)
SF District 7: North (Marina, Cow Hollow, Presidio Heights, Pacific Heights)
SF District 8: Northeast (North Waterfront, North Beach, Russian Hill, Telegraph Hill, Nob Hill, Financial District / Barbary Coast, Downtown, Van Ness / Civic Center, Tenderloin)
SF District 9: Central East (Yerba Buena, South Beach, South of Market, Mission Bay, Inner Mission, Potrero Hill, Central Waterfront / Dogpatch, Bernal Heights)
SF District 10: Southeast (Outer Mission, Mission Terr, Excelsior, Portola, Bayview, Silver Terr, Hunters Pt, Candlestick Pt, Bayview Hts, Little Hollywood, Visitation Vly, Crocker Amazon)
9-2021 9-2022 + / – 9-2021 9-2022 + / – 9-2021 9-2022 + / – 9-2021 9-2022 + / – 9-2021 9-2022 + / –
Single Family
1 SF District 1 33 34 +3.0% 25 18 -28.0% $2,700,000 $2,112,500 -21.8% 20 22 +10.0% 1.7 1.8 +5.9%
2 SF District 2 61 59 -3.3% 47 43 -8.5% $1,660,000 $1,508,000 -9.2% 20 26 +30.0% 1.3 1.4 +7.7%
3 SF District 3 31 31 0.0% 17 14 -17.6% $1,400,000 $1,355,500 -3.2% 18 23 +27.8% 1.9 2.0 +5.3%
4 SF District 4 42 61 +45.2% 28 28 0.0% $1,797,500 $1,825,000 +1.5% 17 26 +52.9% 1.1 2.1 +90.9%
5 SF District 5 72 71 -1.4% 36 13 -63.9% $2,950,000 $2,637,500 -10.6% 24 25 +4.2% 1.8 2.3 +27.8%
6 SF District 6 12 5 -58.3% 3 4 +33.3% $1,875,000 $2,430,000 +29.6% 35 15 -57.1% 2.2 1.3 -40.9%
7 SF District 7 50 48 -4.0% 7 8 +14.3% $6,750,000 $3,450,000 -48.9% 19 28 +47.4% 3.9 4.9 +25.6%
8 SF District 8 21 14 -33.3% 3 2 -33.3% $3,675,000 $3,725,000 +1.4% 20 38 +90.0% 8.0 4.5 -43.8%
9 SF District 9 73 48 -34.2% 24 19 -20.8% $1,903,025 $1,649,000 -13.3% 22 37 +68.2% 2.3 2.1 -8.7%
10 SF District 10 80 91 +13.8% 55 28 -49.1% $1,180,000 $1,050,000 -11.0% 30 32 +6.7% 1.6 2.2 +37.5%
Condo/TIC/Coop
1 SF District 1 44 33 -25.0% 13 12 -7.7% $1,200,000 $1,460,000 +21.7% 16 33 +106.3% 2.3 2.1 -8.7%
2 SF District 2 15 14 -6.7% 3 2 -33.3% $1,070,000 $1,557,500 +45.6% 17 32 +88.2% 2.3 4.0 +73.9%
3 SF District 3 9 6 -33.3% 2 3 +50.0% $735,000 $852,000 +15.9% 36 13 -63.9% 2.3 1.6 -30.4%
4 SF District 4 17 12 -29.4% 2 5 +150.0% $537,000 $855,000 +59.2% 69 54 -21.7% 3.1 2.3 -25.8%
5 SF District 5 119 123 +3.4% 54 36 -33.3% $1,525,000 $1,335,000 -12.5% 20 43 +115.0% 2.1 2.4 +14.3%
6 SF District 6 114 84 -26.3% 34 18 -47.1% $1,265,000 $938,436 -25.8% 30 42 +40.0% 2.8 2.4 -14.3%
7 SF District 7 113 88 -22.1% 27 12 -55.6% $1,400,000 $1,393,500 -0.5% 31 44 +41.9% 2.8 2.8 0.0%
8 SF District 8 274 194 -29.2% 50 39 -22.0% $1,105,000 $1,200,000 +8.6% 60 57 -5.0% 4.5 3.8 -15.6%
9 SF District 9 548 474 -13.5% 102 76 -25.5% $973,000 $1,088,500 +11.9% 50 70 +40.0% 4.3 4.8 +11.6%
10 SF District 10 49 25 -49.0% 5 4 -20.0% $785,000 $637,500 -18.8% 72 231 +220.8% 6.3 3.4 -46.0%
Key metrics by report month for the districts of San Fransisco.
Current as of October 11, 2022. All data from the San Francisco Association of REALTORS® MLS. Report © 2022 ShowingTime. | 16
Active Listings Sold Listings Median Sales Price Days on Market Months Supply

Weitere ähnliche Inhalte

Ähnlich wie San Francisco Market Report September 2022.pdf

San Francisco Market Report February 2022
San Francisco Market Report February 2022San Francisco Market Report February 2022
San Francisco Market Report February 2022Ronny Budiutama
 
San Francisco Market Report March 2022
San Francisco Market Report March 2022San Francisco Market Report March 2022
San Francisco Market Report March 2022Ronny Budiutama
 
San Francisco Market Report January 2022
San Francisco Market Report January 2022San Francisco Market Report January 2022
San Francisco Market Report January 2022Ronny Budiutama
 
San Francisco Market Report February 2023
San Francisco Market Report February 2023San Francisco Market Report February 2023
San Francisco Market Report February 2023Ronny Budiutama
 
San Francisco Market Report December 2021
San Francisco Market Report December 2021San Francisco Market Report December 2021
San Francisco Market Report December 2021Ronny Budiutama
 
San Francisco Market Report January 2023.pdf
San Francisco Market Report January 2023.pdfSan Francisco Market Report January 2023.pdf
San Francisco Market Report January 2023.pdfRonny Budiutama
 
San Francisco market focus report December 2019
San Francisco market focus report December 2019San Francisco market focus report December 2019
San Francisco market focus report December 2019Ronny Budiutama
 
San Francisco market report July 2020
San Francisco market report July 2020San Francisco market report July 2020
San Francisco market report July 2020Ronny Budiutama
 
San Francisco Market Report For July 2021
San Francisco Market Report For July 2021San Francisco Market Report For July 2021
San Francisco Market Report For July 2021Ronny Budiutama
 
San Francisco market report April 2020
San Francisco market report April 2020San Francisco market report April 2020
San Francisco market report April 2020Ronny Budiutama
 
San Francisco Market Report March 2023.pdf
San Francisco Market Report March 2023.pdfSan Francisco Market Report March 2023.pdf
San Francisco Market Report March 2023.pdfRonny Budiutama
 
San Francisco December 2023 Market Report
San Francisco December 2023 Market ReportSan Francisco December 2023 Market Report
San Francisco December 2023 Market ReportRonny Budiutama
 
San Francisco Market Data October 2020
San Francisco Market Data October 2020San Francisco Market Data October 2020
San Francisco Market Data October 2020Ronny Budiutama
 
San Francisco May 2023 Market Report.pdf
San Francisco May 2023 Market Report.pdfSan Francisco May 2023 Market Report.pdf
San Francisco May 2023 Market Report.pdfRonny Budiutama
 
San Francisco Market Report September 2021
San Francisco Market Report September 2021San Francisco Market Report September 2021
San Francisco Market Report September 2021Ronny Budiutama
 
San Francisco Market Report August 2021
San Francisco Market Report August 2021San Francisco Market Report August 2021
San Francisco Market Report August 2021Ronny Budiutama
 
San Francisco Market Report October 2021
San Francisco Market Report October 2021San Francisco Market Report October 2021
San Francisco Market Report October 2021Ronny Budiutama
 
San Francisco Market Report November 2021
San Francisco Market Report November 2021San Francisco Market Report November 2021
San Francisco Market Report November 2021Ronny Budiutama
 
San Francisco Market Report December 2020
San Francisco Market Report December 2020San Francisco Market Report December 2020
San Francisco Market Report December 2020Ronny Budiutama
 
San Francisco Market Report June 2021
San Francisco Market Report June 2021San Francisco Market Report June 2021
San Francisco Market Report June 2021Ronny Budiutama
 

Ähnlich wie San Francisco Market Report September 2022.pdf (20)

San Francisco Market Report February 2022
San Francisco Market Report February 2022San Francisco Market Report February 2022
San Francisco Market Report February 2022
 
San Francisco Market Report March 2022
San Francisco Market Report March 2022San Francisco Market Report March 2022
San Francisco Market Report March 2022
 
San Francisco Market Report January 2022
San Francisco Market Report January 2022San Francisco Market Report January 2022
San Francisco Market Report January 2022
 
San Francisco Market Report February 2023
San Francisco Market Report February 2023San Francisco Market Report February 2023
San Francisco Market Report February 2023
 
San Francisco Market Report December 2021
San Francisco Market Report December 2021San Francisco Market Report December 2021
San Francisco Market Report December 2021
 
San Francisco Market Report January 2023.pdf
San Francisco Market Report January 2023.pdfSan Francisco Market Report January 2023.pdf
San Francisco Market Report January 2023.pdf
 
San Francisco market focus report December 2019
San Francisco market focus report December 2019San Francisco market focus report December 2019
San Francisco market focus report December 2019
 
San Francisco market report July 2020
San Francisco market report July 2020San Francisco market report July 2020
San Francisco market report July 2020
 
San Francisco Market Report For July 2021
San Francisco Market Report For July 2021San Francisco Market Report For July 2021
San Francisco Market Report For July 2021
 
San Francisco market report April 2020
San Francisco market report April 2020San Francisco market report April 2020
San Francisco market report April 2020
 
San Francisco Market Report March 2023.pdf
San Francisco Market Report March 2023.pdfSan Francisco Market Report March 2023.pdf
San Francisco Market Report March 2023.pdf
 
San Francisco December 2023 Market Report
San Francisco December 2023 Market ReportSan Francisco December 2023 Market Report
San Francisco December 2023 Market Report
 
San Francisco Market Data October 2020
San Francisco Market Data October 2020San Francisco Market Data October 2020
San Francisco Market Data October 2020
 
San Francisco May 2023 Market Report.pdf
San Francisco May 2023 Market Report.pdfSan Francisco May 2023 Market Report.pdf
San Francisco May 2023 Market Report.pdf
 
San Francisco Market Report September 2021
San Francisco Market Report September 2021San Francisco Market Report September 2021
San Francisco Market Report September 2021
 
San Francisco Market Report August 2021
San Francisco Market Report August 2021San Francisco Market Report August 2021
San Francisco Market Report August 2021
 
San Francisco Market Report October 2021
San Francisco Market Report October 2021San Francisco Market Report October 2021
San Francisco Market Report October 2021
 
San Francisco Market Report November 2021
San Francisco Market Report November 2021San Francisco Market Report November 2021
San Francisco Market Report November 2021
 
San Francisco Market Report December 2020
San Francisco Market Report December 2020San Francisco Market Report December 2020
San Francisco Market Report December 2020
 
San Francisco Market Report June 2021
San Francisco Market Report June 2021San Francisco Market Report June 2021
San Francisco Market Report June 2021
 

Mehr von Ronny Budiutama

San Francisco January 2024 Market Report
San Francisco January 2024 Market ReportSan Francisco January 2024 Market Report
San Francisco January 2024 Market ReportRonny Budiutama
 
San Francisco November 2023 Market Report
San Francisco November 2023 Market ReportSan Francisco November 2023 Market Report
San Francisco November 2023 Market ReportRonny Budiutama
 
2023 Annual San Francisco Housing Market
2023 Annual San Francisco Housing Market2023 Annual San Francisco Housing Market
2023 Annual San Francisco Housing MarketRonny Budiutama
 
October 2023 Report: San Francisco Real Estate Market Insights
October 2023 Report: San Francisco Real Estate Market InsightsOctober 2023 Report: San Francisco Real Estate Market Insights
October 2023 Report: San Francisco Real Estate Market InsightsRonny Budiutama
 
CA Weekly MLS Market Data Report - August 2023
CA Weekly MLS Market Data Report - August 2023CA Weekly MLS Market Data Report - August 2023
CA Weekly MLS Market Data Report - August 2023Ronny Budiutama
 
San Francisco Market Report July 2023.pdf
San Francisco Market Report July 2023.pdfSan Francisco Market Report July 2023.pdf
San Francisco Market Report July 2023.pdfRonny Budiutama
 
San Francisco June 2023 Market Report.pdf
San Francisco June 2023 Market Report.pdfSan Francisco June 2023 Market Report.pdf
San Francisco June 2023 Market Report.pdfRonny Budiutama
 
Annual Report on the San Francisco County Housing Market.pdf
Annual Report on the San Francisco County Housing Market.pdfAnnual Report on the San Francisco County Housing Market.pdf
Annual Report on the San Francisco County Housing Market.pdfRonny Budiutama
 

Mehr von Ronny Budiutama (8)

San Francisco January 2024 Market Report
San Francisco January 2024 Market ReportSan Francisco January 2024 Market Report
San Francisco January 2024 Market Report
 
San Francisco November 2023 Market Report
San Francisco November 2023 Market ReportSan Francisco November 2023 Market Report
San Francisco November 2023 Market Report
 
2023 Annual San Francisco Housing Market
2023 Annual San Francisco Housing Market2023 Annual San Francisco Housing Market
2023 Annual San Francisco Housing Market
 
October 2023 Report: San Francisco Real Estate Market Insights
October 2023 Report: San Francisco Real Estate Market InsightsOctober 2023 Report: San Francisco Real Estate Market Insights
October 2023 Report: San Francisco Real Estate Market Insights
 
CA Weekly MLS Market Data Report - August 2023
CA Weekly MLS Market Data Report - August 2023CA Weekly MLS Market Data Report - August 2023
CA Weekly MLS Market Data Report - August 2023
 
San Francisco Market Report July 2023.pdf
San Francisco Market Report July 2023.pdfSan Francisco Market Report July 2023.pdf
San Francisco Market Report July 2023.pdf
 
San Francisco June 2023 Market Report.pdf
San Francisco June 2023 Market Report.pdfSan Francisco June 2023 Market Report.pdf
San Francisco June 2023 Market Report.pdf
 
Annual Report on the San Francisco County Housing Market.pdf
Annual Report on the San Francisco County Housing Market.pdfAnnual Report on the San Francisco County Housing Market.pdf
Annual Report on the San Francisco County Housing Market.pdf
 

Kürzlich hochgeladen

Listing Turkey Green life Istanbul Eyup Catalog
Listing Turkey Green life Istanbul Eyup CatalogListing Turkey Green life Istanbul Eyup Catalog
Listing Turkey Green life Istanbul Eyup CatalogListing Turkey
 
Prestige Orchards Plots in Shamshabad, Mamidipalli, Hyderabad pdf.pdf
Prestige Orchards Plots in Shamshabad, Mamidipalli, Hyderabad pdf.pdfPrestige Orchards Plots in Shamshabad, Mamidipalli, Hyderabad pdf.pdf
Prestige Orchards Plots in Shamshabad, Mamidipalli, Hyderabad pdf.pdfAhanundefined
 
Experion Elements Sector 45 Noida E-Brochure
Experion Elements Sector 45 Noida E-BrochureExperion Elements Sector 45 Noida E-Brochure
Experion Elements Sector 45 Noida E-BrochureRealEstate Info
 
Managing Uncertainty: Newman George Leech's Real Estate Finance Strategy
Managing Uncertainty: Newman George Leech's Real Estate Finance StrategyManaging Uncertainty: Newman George Leech's Real Estate Finance Strategy
Managing Uncertainty: Newman George Leech's Real Estate Finance StrategyNewman George Leech
 
Purva Park Hill Kanakapura Road Bangalore.pdf
Purva Park Hill  Kanakapura Road Bangalore.pdfPurva Park Hill  Kanakapura Road Bangalore.pdf
Purva Park Hill Kanakapura Road Bangalore.pdfashiyadav24
 
Sankla East World Hadapsar Pune Brochure.pdf
Sankla East World Hadapsar Pune Brochure.pdfSankla East World Hadapsar Pune Brochure.pdf
Sankla East World Hadapsar Pune Brochure.pdfabbu831446
 
Volition Meetup 2024 03 Mortgages & Interest Rates – Is The Worst Behind Us_ ...
Volition Meetup 2024 03 Mortgages & Interest Rates – Is The Worst Behind Us_ ...Volition Meetup 2024 03 Mortgages & Interest Rates – Is The Worst Behind Us_ ...
Volition Meetup 2024 03 Mortgages & Interest Rates – Is The Worst Behind Us_ ...Volition Properties
 
Kohinoor Hinjewadi Phase 2 In Pune - PDF.pdf
Kohinoor Hinjewadi Phase 2 In Pune - PDF.pdfKohinoor Hinjewadi Phase 2 In Pune - PDF.pdf
Kohinoor Hinjewadi Phase 2 In Pune - PDF.pdfmonikasharma630
 
LCAR Unit 20 - Appraising Real Estate - 14th Edition Revised
LCAR Unit 20 - Appraising Real Estate - 14th Edition RevisedLCAR Unit 20 - Appraising Real Estate - 14th Edition Revised
LCAR Unit 20 - Appraising Real Estate - 14th Edition RevisedTom Blefko
 
Prestige Sanctuary Nandi Hills Bangalore.pdf
Prestige Sanctuary Nandi Hills Bangalore.pdfPrestige Sanctuary Nandi Hills Bangalore.pdf
Prestige Sanctuary Nandi Hills Bangalore.pdfashiyadav24
 
Prestige Somerville Whitefield Bangalore E- Brochure.pdf
Prestige Somerville Whitefield Bangalore E- Brochure.pdfPrestige Somerville Whitefield Bangalore E- Brochure.pdf
Prestige Somerville Whitefield Bangalore E- Brochure.pdffaheemali990101
 
Triaa Housing Lohegaon Pune E-Brochure.pdf
Triaa Housing Lohegaon Pune  E-Brochure.pdfTriaa Housing Lohegaon Pune  E-Brochure.pdf
Triaa Housing Lohegaon Pune E-Brochure.pdfManishSaxena95
 
Shriram Hebbal One Kempapura Bangalore E- Brochure.pdf
Shriram Hebbal One Kempapura Bangalore E- Brochure.pdfShriram Hebbal One Kempapura Bangalore E- Brochure.pdf
Shriram Hebbal One Kempapura Bangalore E- Brochure.pdffaheemali990101
 
Ganga Fusion 85 Gurugram - PDF Download.pdf
Ganga Fusion 85 Gurugram - PDF Download.pdfGanga Fusion 85 Gurugram - PDF Download.pdf
Ganga Fusion 85 Gurugram - PDF Download.pdfanjalisaini334541
 
Listing Turkey - Resim Modern Catalog Istanbul
Listing Turkey - Resim Modern Catalog IstanbulListing Turkey - Resim Modern Catalog Istanbul
Listing Turkey - Resim Modern Catalog IstanbulListing Turkey
 
Fractional Ownership Vs Physical Ownership.pdf
Fractional Ownership Vs Physical Ownership.pdfFractional Ownership Vs Physical Ownership.pdf
Fractional Ownership Vs Physical Ownership.pdfHavendaxa
 
What is Affordable Housing? Bristol Civic Society April 2024
What is Affordable Housing? Bristol Civic Society April 2024What is Affordable Housing? Bristol Civic Society April 2024
What is Affordable Housing? Bristol Civic Society April 2024Paul Smith
 
Clemson Engineering Consultant Dubai For Innovative and Sustainable Engineeri...
Clemson Engineering Consultant Dubai For Innovative and Sustainable Engineeri...Clemson Engineering Consultant Dubai For Innovative and Sustainable Engineeri...
Clemson Engineering Consultant Dubai For Innovative and Sustainable Engineeri...Clemson Engineering Consultant
 
Experion Elements Phase 1 Noida E-Brochure
Experion Elements Phase 1 Noida E-BrochureExperion Elements Phase 1 Noida E-Brochure
Experion Elements Phase 1 Noida E-BrochureRealEstate Info
 
Mana Dale Kodathi, Sarjapur Road, Bangalore E-Brochure.pdf
Mana Dale Kodathi, Sarjapur Road, Bangalore E-Brochure.pdfMana Dale Kodathi, Sarjapur Road, Bangalore E-Brochure.pdf
Mana Dale Kodathi, Sarjapur Road, Bangalore E-Brochure.pdffaheemali990101
 

Kürzlich hochgeladen (20)

Listing Turkey Green life Istanbul Eyup Catalog
Listing Turkey Green life Istanbul Eyup CatalogListing Turkey Green life Istanbul Eyup Catalog
Listing Turkey Green life Istanbul Eyup Catalog
 
Prestige Orchards Plots in Shamshabad, Mamidipalli, Hyderabad pdf.pdf
Prestige Orchards Plots in Shamshabad, Mamidipalli, Hyderabad pdf.pdfPrestige Orchards Plots in Shamshabad, Mamidipalli, Hyderabad pdf.pdf
Prestige Orchards Plots in Shamshabad, Mamidipalli, Hyderabad pdf.pdf
 
Experion Elements Sector 45 Noida E-Brochure
Experion Elements Sector 45 Noida E-BrochureExperion Elements Sector 45 Noida E-Brochure
Experion Elements Sector 45 Noida E-Brochure
 
Managing Uncertainty: Newman George Leech's Real Estate Finance Strategy
Managing Uncertainty: Newman George Leech's Real Estate Finance StrategyManaging Uncertainty: Newman George Leech's Real Estate Finance Strategy
Managing Uncertainty: Newman George Leech's Real Estate Finance Strategy
 
Purva Park Hill Kanakapura Road Bangalore.pdf
Purva Park Hill  Kanakapura Road Bangalore.pdfPurva Park Hill  Kanakapura Road Bangalore.pdf
Purva Park Hill Kanakapura Road Bangalore.pdf
 
Sankla East World Hadapsar Pune Brochure.pdf
Sankla East World Hadapsar Pune Brochure.pdfSankla East World Hadapsar Pune Brochure.pdf
Sankla East World Hadapsar Pune Brochure.pdf
 
Volition Meetup 2024 03 Mortgages & Interest Rates – Is The Worst Behind Us_ ...
Volition Meetup 2024 03 Mortgages & Interest Rates – Is The Worst Behind Us_ ...Volition Meetup 2024 03 Mortgages & Interest Rates – Is The Worst Behind Us_ ...
Volition Meetup 2024 03 Mortgages & Interest Rates – Is The Worst Behind Us_ ...
 
Kohinoor Hinjewadi Phase 2 In Pune - PDF.pdf
Kohinoor Hinjewadi Phase 2 In Pune - PDF.pdfKohinoor Hinjewadi Phase 2 In Pune - PDF.pdf
Kohinoor Hinjewadi Phase 2 In Pune - PDF.pdf
 
LCAR Unit 20 - Appraising Real Estate - 14th Edition Revised
LCAR Unit 20 - Appraising Real Estate - 14th Edition RevisedLCAR Unit 20 - Appraising Real Estate - 14th Edition Revised
LCAR Unit 20 - Appraising Real Estate - 14th Edition Revised
 
Prestige Sanctuary Nandi Hills Bangalore.pdf
Prestige Sanctuary Nandi Hills Bangalore.pdfPrestige Sanctuary Nandi Hills Bangalore.pdf
Prestige Sanctuary Nandi Hills Bangalore.pdf
 
Prestige Somerville Whitefield Bangalore E- Brochure.pdf
Prestige Somerville Whitefield Bangalore E- Brochure.pdfPrestige Somerville Whitefield Bangalore E- Brochure.pdf
Prestige Somerville Whitefield Bangalore E- Brochure.pdf
 
Triaa Housing Lohegaon Pune E-Brochure.pdf
Triaa Housing Lohegaon Pune  E-Brochure.pdfTriaa Housing Lohegaon Pune  E-Brochure.pdf
Triaa Housing Lohegaon Pune E-Brochure.pdf
 
Shriram Hebbal One Kempapura Bangalore E- Brochure.pdf
Shriram Hebbal One Kempapura Bangalore E- Brochure.pdfShriram Hebbal One Kempapura Bangalore E- Brochure.pdf
Shriram Hebbal One Kempapura Bangalore E- Brochure.pdf
 
Ganga Fusion 85 Gurugram - PDF Download.pdf
Ganga Fusion 85 Gurugram - PDF Download.pdfGanga Fusion 85 Gurugram - PDF Download.pdf
Ganga Fusion 85 Gurugram - PDF Download.pdf
 
Listing Turkey - Resim Modern Catalog Istanbul
Listing Turkey - Resim Modern Catalog IstanbulListing Turkey - Resim Modern Catalog Istanbul
Listing Turkey - Resim Modern Catalog Istanbul
 
Fractional Ownership Vs Physical Ownership.pdf
Fractional Ownership Vs Physical Ownership.pdfFractional Ownership Vs Physical Ownership.pdf
Fractional Ownership Vs Physical Ownership.pdf
 
What is Affordable Housing? Bristol Civic Society April 2024
What is Affordable Housing? Bristol Civic Society April 2024What is Affordable Housing? Bristol Civic Society April 2024
What is Affordable Housing? Bristol Civic Society April 2024
 
Clemson Engineering Consultant Dubai For Innovative and Sustainable Engineeri...
Clemson Engineering Consultant Dubai For Innovative and Sustainable Engineeri...Clemson Engineering Consultant Dubai For Innovative and Sustainable Engineeri...
Clemson Engineering Consultant Dubai For Innovative and Sustainable Engineeri...
 
Experion Elements Phase 1 Noida E-Brochure
Experion Elements Phase 1 Noida E-BrochureExperion Elements Phase 1 Noida E-Brochure
Experion Elements Phase 1 Noida E-Brochure
 
Mana Dale Kodathi, Sarjapur Road, Bangalore E-Brochure.pdf
Mana Dale Kodathi, Sarjapur Road, Bangalore E-Brochure.pdfMana Dale Kodathi, Sarjapur Road, Bangalore E-Brochure.pdf
Mana Dale Kodathi, Sarjapur Road, Bangalore E-Brochure.pdf
 

San Francisco Market Report September 2022.pdf

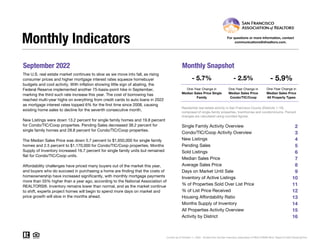
  • 1. September 2022 Monthly Snapshot One-Year Change in One-Year Change in Median Sales Price Single Family Median Sales Price Condo/TIC/Coop 2 3 4 5 6 7 8 9 10 11 12 13 14 15 16 Current as of October 11, 2022. All data from the San Francisco Association of REALTORS® MLS. Report © 2022 ShowingTime. Condo/TIC/Coop Activity Overview Inventory of Active Listings % of Properties Sold Over List Price % of List Price Received Housing Affordability Ratio All Properties Activity Overview New Listings Pending Sales Sold Listings Median Sales Price Average Sales Price Days on Market Until Sale Activity by District Monthly Indicators - 5.7% - 2.5% - 5.9% One-Year Change in The U.S. real estate market continues to slow as we move into fall, as rising consumer prices and higher mortgage interest rates squeeze homebuyer budgets and cool activity. With inflation showing little sign of abating, the Federal Reserve implemented another 75-basis-point hike in September, marking the third such rate increase this year. The cost of borrowing has reached multi-year highs on everything from credit cards to auto loans in 2022 as mortgage interest rates topped 6% for the first time since 2008, causing existing home sales to decline for the seventh consecutive month. New Listings were down 13.2 percent for single family homes and 19.8 percent for Condo/TIC/Coop properties. Pending Sales decreased 38.2 percent for single family homes and 28.8 percent for Condo/TIC/Coop properties. The Median Sales Price was down 5.7 percent to $1,650,000 for single family homes and 2.5 percent to $1,170,000 for Condo/TIC/Coop properties. Months Supply of Inventory increased 16.7 percent for single family units but remained flat for Condo/TIC/Coop units. Affordability challenges have priced many buyers out of the market this year, and buyers who do succeed in purchasing a home are finding that the costs of homeownership have increased significantly, with monthly mortgage payments more than 55% higher than a year ago, according to the National Association of REALTORS®. Inventory remains lower than normal, and as the market continue to shift, experts project homes will begin to spend more days on market and price growth will slow in the months ahead. Median Sales Price All Property Types Residential real estate activity in San Francisco County (Districts 1-10) composed of single-family properties, townhomes and condominiums. Percent changes are calculated using rounded figures. Single Family Activity Overview Months Supply of Inventory For questions or more information, contact communications@sfrealtors.com.
  • 2. Single Family Activity Overview Key metrics by report month and for year-to-date (YTD) starting from the first of the year. Key Metrics Historical Sparkbars 9-2021 9-2022 Percent Change YTD 2021 YTD 2022 Percent Change - 7.5% 2,658 1,882 - 15.7% $1,826,500 + 1.5% - 0.7% Pending Sales 330 204 - 38.2% - 18.5% 2,368 1,931 New Listings 424 368 - 13.2% 2,874 Sold Listings 245 177 - 27.8% 2,232 Median Sales Price $1,750,000 $1,650,000 - 5.7% $1,800,000 21 - 12.5% $2,275,779 -- -- Days on Market 23 27 + 17.4% 24 Avg. Sales Price $2,165,489 $1,881,048 - 13.1% $2,292,888 Active Listings 475 462 - 2.7% -- % of Properties Sold Over List Price 84.5% 67.2% - 20.5% 78.0% 31 82.4% + 5.6% + 2.2% 22 - 29.0% 117.0% % of List Price Received 116.3% 108.6% - 6.6% 114.5% Current as of October 11, 2022. All data from the San Francisco Association of REALTORS® MLS. Report © 2022 ShowingTime. | 2 Months Supply 1.8 2.1 + 16.7% -- -- -- Affordability Ratio 32 24 - 25.0% 9-2019 9-2020 9-2021 9-2022 9-2019 9-2020 9-2021 9-2022 9-2019 9-2020 9-2021 9-2022 9-2019 9-2020 9-2021 9-2022 9-2019 9-2020 9-2021 9-2022 9-2019 9-2020 9-2021 9-2022 9-2019 9-2020 9-2021 9-2022 9-2019 9-2020 9-2021 9-2022 9-2019 9-2020 9-2021 9-2022 9-2019 9-2020 9-2021 9-2022 9-2019 9-2020 9-2021 9-2022
  • 3. Condo/TIC/Coop Activity Overview Key metrics by report month and for year-to-date (YTD) starting from the first of the year. Key Metrics Historical Sparkbars 9-2021 9-2022 Percent Change YTD 2021 YTD 2022 Percent Change - 6.4% Pending Sales 337 240 - 28.8% 3,495 2,616 - 25.2% New Listings 722 579 - 19.8% 4,700 4,398 Sold Listings 292 207 - 29.1% 3,393 2,560 - 24.6% Median Sales Price $1,200,000 $1,170,000 - 2.5% $1,200,000 $1,200,000 0.0% + 2.0% 42 - 10.6% $1,383,346 -- -- Days on Market 40 59 + 47.5% 47 Avg. Sales Price $1,332,052 $1,351,225 + 1.4% $1,356,690 Active Listings 1,302 1,053 - 19.1% -- % of Properties Sold Over List Price 54.5% 31.4% - 42.4% 47.5% 55 51.2% + 7.8% + 0.9% 38 - 30.9% 104.5% % of List Price Received 105.0% 100.7% - 4.1% 103.6% Current as of October 11, 2022. All data from the San Francisco Association of REALTORS® MLS. Report © 2022 ShowingTime. | 3 Months Supply 3.5 3.5 0.0% -- -- -- Affordability Ratio 55 39 - 29.1% 9-2019 9-2020 9-2021 9-2022 9-2019 9-2020 9-2021 9-2022 9-2019 9-2020 9-2021 9-2022 9-2019 9-2020 9-2021 9-2022 9-2019 9-2020 9-2021 9-2022 9-2019 9-2020 9-2021 9-2022 9-2019 9-2020 9-2021 9-2022 9-2019 9-2020 9-2021 9-2022 9-2019 9-2020 9-2021 9-2022 9-2019 9-2020 9-2021 9-2022 9-2019 9-2020 9-2021 9-2022
  • 4. New Listings New Listings Single Family Year-Over-Year Change Condo/TIC/ Coop Year-Over-Year Change Oct-2021 333 -21.3% 529 -12.7% Nov-2021 171 -29.3% 265 -1.5% Dec-2021 83 -33.1% 147 -7.5% Jan-2022 228 -10.2% 472 -12.3% Feb-2022 288 +14.7% 535 +6.4% Mar-2022 343 +5.9% 613 +13.5% Apr-2022 329 -4.9% 542 +0.2% May-2022 302 -15.2% 516 +1.2% Jun-2022 321 -4.5% 451 -9.8% Jul-2022 240 -21.6% 379 -17.2% Aug-2022 239 -13.7% 311 -19.8% Sep-2022 368 -13.2% 579 -19.8% 12-Month Avg 270 -11.4% 445 -6.9% Historical New Listings by Month Current as of October 11, 2022. All data from the San Francisco Association of REALTORS® MLS. Report © 2022 ShowingTime. | 4 A count of the properties that have been newly listed on the market in a given month. 428 754 424 722 368 579 Single Family Condo/TIC/Coop September 0 200 400 600 800 1-2005 1-2006 1-2007 1-2008 1-2009 1-2010 1-2011 1-2012 1-2013 1-2014 1-2015 1-2016 1-2017 1-2018 1-2019 1-2020 1-2021 1-2022 Single Family Condo/TIC/Coop 2,546 4,224 2,874 4,700 2,658 4,398 Single Family Condo/TIC/Coop Year to Date 2020 2021 2022 - 19.8% - 4.2% - 13.2% - 0.9% + 11.3% - 7.5% + 12.9% - 6.4% 2020 2021 2022 2020 2021 2022 2020 2021 2022 + 2.6% + 6.1% + 29.3% + 15.1%
  • 5. Pending Sales Pending Sales Single Family Year-Over-Year Change Condo/TIC/ Coop Year-Over-Year Change Oct-2021 273 -12.2% 405 +21.6% Nov-2021 259 -15.6% 360 +20.0% Dec-2021 129 -36.5% 226 -26.4% Jan-2022 145 -15.2% 251 -14.0% Feb-2022 216 -4.4% 287 -24.7% Mar-2022 288 -0.3% 436 -8.0% Apr-2022 269 -5.9% 344 -28.3% May-2022 249 -18.9% 333 -28.1% Jun-2022 198 -27.7% 262 -32.5% Jul-2022 184 -29.0% 224 -38.5% Aug-2022 178 -21.2% 239 -24.4% Sep-2022 204 -38.2% 240 -28.8% 12-Month Avg 216 -18.7% 301 -18.7% Historical Pending Sales by Month Current as of October 11, 2022. All data from the San Francisco Association of REALTORS® MLS. Report © 2022 ShowingTime. | 5 A count of the properties on which offers have been accepted in a given month. 281 306 330 337 204 240 Single Family Condo/TIC/Coop September 0 100 200 300 400 500 600 1-2005 1-2006 1-2007 1-2008 1-2009 1-2010 1-2011 1-2012 1-2013 1-2014 1-2015 1-2016 1-2017 1-2018 1-2019 1-2020 1-2021 1-2022 Single Family Condo/TIC/Coop 1,698 1,910 2,368 3,495 1,931 2,616 Single Family Condo/TIC/Coop Year to Date 2020 2021 2022 - 28.8% + 10.1% - 38.2% + 17.4% + 83.0% - 18.5% + 39.5% - 25.2% 2020 2021 2022 2020 2021 2022 2020 2021 2022 + 29.5% - 7.1% - 13.2% + 33.6%
  • 6. Sold Listings Sold Listings Single Family Year-Over-Year Change Condo/TIC/ Coop Year-Over-Year Change Oct-2021 310 +1.6% 364 +24.7% Nov-2021 293 +3.2% 425 +24.6% Dec-2021 216 -28.5% 325 -7.9% Jan-2022 130 -19.3% 186 -31.1% Feb-2022 159 -2.5% 250 -10.1% Mar-2022 257 -5.2% 394 -13.8% Apr-2022 257 -11.1% 378 -18.2% May-2022 282 +6.0% 368 -17.1% Jun-2022 249 -23.6% 309 -34.7% Jul-2022 183 -28.2% 232 -37.1% Aug-2022 188 -26.6% 236 -32.2% Sep-2022 177 -27.8% 207 -29.1% 12-Month Avg 225 -13.5% 306 -16.1% Historical Sold Listings by Month Current as of October 11, 2022. All data from the San Francisco Association of REALTORS® MLS. Report © 2022 ShowingTime. | 6 A count of the actual sales that closed in a given month. 257 323 245 292 177 207 Single Family Condo/TIC/Coop September 0 100 200 300 400 500 1-2005 1-2006 1-2007 1-2008 1-2009 1-2010 1-2011 1-2012 1-2013 1-2014 1-2015 1-2016 1-2017 1-2018 1-2019 1-2020 1-2021 1-2022 Single Family Condo/TIC/Coop 1,572 1,802 2,232 3,393 1,882 2,560 Single Family Condo/TIC/Coop Year to Date 2020 2021 2022 - 29.1% - 9.6% - 27.8% - 4.7% + 88.3% - 15.7% + 42.0% - 24.6% 2020 2021 2022 2020 2021 2022 2020 2021 2022 + 77.2% - 9.3% - 15.0% + 75.5%
  • 7. Median Sales Price Median Sales Price Single Family Year-Over-Year Change Condo/TIC/ Coop Year-Over-Year Change Oct-2021 $1,805,000 +12.5% $1,247,000 +8.2% Nov-2021 $1,880,000 +14.8% $1,260,000 +7.5% Dec-2021 $1,690,000 +9.0% $1,300,000 +18.2% Jan-2022 $1,630,000 +3.5% $1,070,000 -0.2% Feb-2022 $1,930,000 +17.0% $1,227,500 +2.6% Mar-2022 $2,000,000 +15.9% $1,206,750 -1.2% Apr-2022 $2,050,000 +13.9% $1,370,000 +14.2% May-2022 $2,007,500 +6.4% $1,215,000 -1.1% Jun-2022 $1,880,000 -3.1% $1,240,000 -0.8% Jul-2022 $1,670,000 -9.7% $1,198,500 -1.0% Aug-2022 $1,617,500 -12.4% $997,500 -13.3% Sep-2022 $1,650,000 -5.7% $1,170,000 -2.5% 12-Month Avg* $1,825,000 +4.3% $1,225,000 +2.5% Historical Median Sales Price by Month * Median Sales Price for all properties from October 2021 through September 2022. This is not the average of the individual figures above. Current as of October 11, 2022. All data from the San Francisco Association of REALTORS® MLS. Report © 2022 ShowingTime. | 7 Point at which half of the sales sold for more and half sold for less, not accounting for seller concessions, in a given month. $1,650,000 $1,175,000 $1,750,000 $1,200,000 $1,650,000 $1,170,000 Single Family Condo/TIC/Coop September $500,000 $750,000 $1,000,000 $1,250,000 $1,500,000 $1,750,000 $2,000,000 $2,250,000 1-2005 1-2006 1-2007 1-2008 1-2009 1-2010 1-2011 1-2012 1-2013 1-2014 1-2015 1-2016 1-2017 1-2018 1-2019 1-2020 1-2021 1-2022 Single Family Condo/TIC/Coop $1,620,250 $1,200,000 $1,800,000 $1,200,000 $1,826,500 $1,200,000 Single Family Condo/TIC/Coop Year to Date 2020 2021 2022 - 2.5% + 2.1% - 5.7% + 6.1% 0.0% + 1.5% + 11.1% 0.0% 2020 2021 2022 2020 2021 2022 2020 2021 2022 + 8.2% + 2.8% - 0.4% - 9.6%
  • 8. Average Sales Price Average Sales Price Single Family Year-Over-Year Change Condo/TIC/ Coop Year-Over-Year Change Oct-2021 $2,359,157 +23.7% $1,461,587 +16.7% Nov-2021 $2,352,087 +15.5% $1,538,838 +21.1% Dec-2021 $2,365,749 +17.5% $1,488,734 +16.1% Jan-2022 $1,971,756 +1.3% $1,311,263 +8.3% Feb-2022 $2,417,245 +7.1% $1,398,389 +4.0% Mar-2022 $2,534,210 +14.6% $1,411,860 +3.1% Apr-2022 $2,515,877 +3.5% $1,467,459 +8.9% May-2022 $2,411,895 -2.7% $1,403,132 +1.7% Jun-2022 $2,355,940 -5.8% $1,366,119 -1.5% Jul-2022 $2,061,331 -10.1% $1,471,068 +8.4% Aug-2022 $1,954,903 -8.1% $1,175,621 -17.5% Sep-2022 $1,881,048 -13.1% $1,351,225 +1.4% 12-Month Avg* $2,300,822 +4.4% $1,418,417 +6.1% Historical Average Sales Price by Month * Avg. Sales Price for all properties from October 2021 through September 2022. This is not the average of the individual figures above. Current as of October 11, 2022. All data from the San Francisco Association of REALTORS® MLS. Report © 2022 ShowingTime. | 8 Average sales price for all closed sales, not accounting for seller concessions, in a given month. $1,896,046 $1,306,022 $2,165,489 $1,332,052 $1,881,048 $1,351,225 Single Family Condo/TIC/Coop September $500,000 $1,000,000 $1,500,000 $2,000,000 $2,500,000 $3,000,000 1-2005 1-2006 1-2007 1-2008 1-2009 1-2010 1-2011 1-2012 1-2013 1-2014 1-2015 1-2016 1-2017 1-2018 1-2019 1-2020 1-2021 1-2022 Single Family Condo/TIC/Coop $2,015,770 $1,341,438 $2,292,888 $1,356,690 $2,275,779 $1,383,346 Single Family Condo/TIC/Coop Year to Date 2020 2021 2022 + 1.4% + 2.0% - 13.1% + 14.2% + 1.1% - 0.7% + 13.7% + 2.0% 2020 2021 2022 2020 2021 2022 2020 2021 2022 - 4.6% + 1.6% - 0.0% - 9.2%
  • 9. Days on Market Until Sale Days on Market Until Sale Single Family Year-Over-Year Change Condo/TIC/ Coop Year-Over-Year Change Oct-2021 20 -31.0% 36 -14.3% Nov-2021 21 -38.2% 41 -19.6% Dec-2021 31 -13.9% 47 -26.6% Jan-2022 41 +2.5% 68 -9.3% Feb-2022 22 -35.3% 36 -45.5% Mar-2022 16 -38.5% 34 -29.2% Apr-2022 16 -20.0% 31 -34.0% May-2022 21 +5.0% 37 -5.1% Jun-2022 17 -10.5% 39 +5.4% Jul-2022 21 +10.5% 49 +16.7% Aug-2022 26 +4.0% 50 +16.3% Sep-2022 27 +17.4% 59 +47.5% 12-Month Avg* 22 -16.8% 42 -13.5% Historical Days on Market Until Sale by Month * Days on Market for all properties from October 2021 through September 2022. This is not the average of the individual figures above. Current as of October 11, 2022. All data from the San Francisco Association of REALTORS® MLS. Report © 2022 ShowingTime. | 9 Average number of days between when a property is listed and when an offer is accepted in a given month. 27 48 23 40 27 59 Single Family Condo/TIC/Coop September 0 20 40 60 80 100 120 1-2005 1-2006 1-2007 1-2008 1-2009 1-2010 1-2011 1-2012 1-2013 1-2014 1-2015 1-2016 1-2017 1-2018 1-2019 1-2020 1-2021 1-2022 Single Family Condo/TIC/Coop 27 42 24 47 21 42 Single Family Condo/TIC/Coop Year to Date 2020 2021 2022 + 47.5% - 16.7% + 17.4% - 14.8% + 11.9% - 12.5% - 11.1% - 10.6% 2020 2021 2022 2020 2021 2022 2020 2021 2022 - 10.0% - 3.6% + 5.0% + 17.1%
  • 10. Inventory of Active Listings Inventory of Active Listings Single Family Year-Over-Year Change Condo/TIC/ Coop Year-Over-Year Change Oct-2021 490 -35.4% 1,304 -36.9% Nov-2021 365 -41.7% 1,093 -39.9% Dec-2021 207 -48.1% 677 -40.8% Jan-2022 264 -34.3% 834 -33.1% Feb-2022 303 -20.3% 994 -19.6% Mar-2022 321 -12.3% 1,049 -8.7% Apr-2022 340 -13.5% 1,111 -0.1% May-2022 335 -17.3% 1,119 +4.5% Jun-2022 380 -8.7% 1,095 +3.3% Jul-2022 364 -14.4% 1,007 -5.1% Aug-2022 348 -19.3% 873 -14.8% Sep-2022 462 -2.7% 1,053 -19.1% 12-Month Avg* 348 -23.7% 1,017 -20.2% Historical Inventory of Active Listings by Month * Active Listings for all properties from October 2021 through September 2022. This is not the average of the individual figures above. Current as of October 11, 2022. All data from the San Francisco Association of REALTORS® MLS. Report © 2022 ShowingTime. | 10 The number of properties available for sale in active status at the end of a given month. 710 1,948 475 1,302 462 1,053 Single Family Condo/TIC/Coop September 0 500 1,000 1,500 2,000 2,500 1-2005 1-2006 1-2007 1-2008 1-2009 1-2010 1-2011 1-2012 1-2013 1-2014 1-2015 1-2016 1-2017 1-2018 1-2019 1-2020 1-2021 1-2022 Single Family Condo/TIC/Coop 2020 2021 2022 - 19.1% - 33.2% - 2.7% - 33.1% 2020 2021 2022 + 33.0% + 106.4%
  • 11. % of Properties Sold Over List Price % of Properties Sold Over List Price Single Family Year-Over-Year Change Condo/TIC/ Coop Year-Over-Year Change Oct-2021 84.5% +25.2% 60.7% +41.8% Nov-2021 79.5% +29.1% 55.8% +70.1% Dec-2021 78.7% +25.1% 46.5% +62.6% Jan-2022 75.4% +30.4% 38.7% +76.7% Feb-2022 86.8% +27.5% 58.4% +65.4% Mar-2022 86.4% +17.1% 58.1% +35.4% Apr-2022 88.7% +16.6% 63.0% +39.4% May-2022 86.9% +9.0% 55.3% +3.6% Jun-2022 86.3% +5.0% 57.3% +5.5% Jul-2022 78.1% -6.5% 40.1% -27.9% Aug-2022 76.1% -9.8% 37.3% -31.7% Sep-2022 67.2% -20.5% 31.4% -42.4% 12-Month Avg 82.0% +10.9% 52.3% +17.5% Historical % of Properties Sold Over List Price by Month * % of Properties Sold Over List Price for all properties from October 2021 through September 2022. This is not the average of the individual figures above. Current as of October 11, 2022. All data from the San Francisco Association of REALTORS® MLS. Report © 2022 ShowingTime. | 11 Percentage found when dividing the number of properties sold by properties sold over its original list price, not accounting for seller concessions. 65.0% 34.4% 84.5% 54.5% 67.2% 31.4% Single Family Condo/TIC/Coop September 0.0% 20.0% 40.0% 60.0% 80.0% 100.0% 1-2005 1-2006 1-2007 1-2008 1-2009 1-2010 1-2011 1-2012 1-2013 1-2014 1-2015 1-2016 1-2017 1-2018 1-2019 1-2020 1-2021 1-2022 Single Family Condo/TIC/Coop 66.2% 43.7% 78.0% 47.5% 82.4% 51.2% Single Family Condo/TIC/Coop Year to Date 2020 2021 2022 - 42.4% + 58.4% - 20.5% + 30.0% + 8.7% + 5.6% + 17.8% + 7.8% 2020 2021 2022 2020 2021 2022 2020 2021 2022 - 12.8% - 14.0% - 25.6% - 41.4%
  • 12. % of List Price Received % of List Price Received Single Family Year-Over-Year Change Condo/TIC/ Coop Year-Over-Year Change Oct-2021 117.0% +8.2% 105.5% +4.1% Nov-2021 114.8% +8.3% 104.6% +4.4% Dec-2021 114.3% +7.8% 103.5% +4.2% Jan-2022 117.4% +11.5% 101.1% +2.4% Feb-2022 121.2% +10.5% 106.1% +5.4% Mar-2022 121.9% +8.7% 106.4% +3.9% Apr-2022 123.1% +8.2% 107.3% +3.5% May-2022 119.6% +2.4% 105.9% +0.7% Jun-2022 116.8% +0.5% 105.3% 0.0% Jul-2022 110.9% -6.4% 101.5% -3.1% Aug-2022 108.4% -6.6% 100.7% -3.5% Sep-2022 108.6% -6.6% 100.7% -4.1% 12-Month Avg* 116.6% +3.8% 104.5% +1.6% Historical % of List Price Received by Month * % of List Price Received for all properties from October 2021 through September 2022. This is not the average of the individual figures above. Current as of October 11, 2022. All data from the San Francisco Association of REALTORS® MLS. Report © 2022 ShowingTime. | 12 Percentage found when dividing a property’s sales price by its most recent list price, then taking the average for all properties sold in a given month, not accounting for seller concessions. 106.8% 100.2% 116.3% 105.0% 108.6% 100.7% Single Family Condo/TIC/Coop September 108.0% 101.7% 114.5% 103.6% 117.0% 104.5% Single Family Condo/TIC/Coop Year to Date 90.0% 100.0% 110.0% 120.0% 130.0% 1-2005 1-2006 1-2007 1-2008 1-2009 1-2010 1-2011 1-2012 1-2013 1-2014 1-2015 1-2016 1-2017 1-2018 1-2019 1-2020 1-2021 1-2022 Single Family Condo/TIC/Coop 2020 2021 2022 - 4.1% + 4.8% - 6.6% + 8.9% 2020 2021 2022 - 5.2% - 4.5% 2020 2021 2022 + 0.9% + 1.9% + 2.2% + 6.0% 2020 2021 2022 - 4.2% - 3.6%
  • 13. Housing Affordability Ratio Housing Affordability Ratio Single Family Year-Over-Year Change Condo/TIC/ Coop Year-Over-Year Change Oct-2021 31 -13.9% 53 -10.2% Nov-2021 30 -14.3% 54 -8.5% Dec-2021 32 -13.5% 49 -21.0% Jan-2022 32 -11.1% 57 -9.5% Feb-2022 27 -18.2% 49 -7.5% Mar-2022 24 -25.0% 45 -13.5% Apr-2022 21 -32.3% 37 -32.7% May-2022 22 -26.7% 42 -22.2% Jun-2022 23 -17.9% 40 -23.1% Jul-2022 27 -10.0% 43 -20.4% Aug-2022 28 -6.7% 51 -10.5% Sep-2022 24 -25.0% 39 -29.1% 12-Month Avg* 27 -26.2% 46 -30.8% Historical Housing Affordability Ratio by Month * Affordability Ratio for all properties from October 2021 through September 2022. This is not the average of the individual figures above. Current as of October 11, 2022. All data from the San Francisco Association of REALTORS® MLS. Report © 2022 ShowingTime. | 13 This index measures housing affordability for the region. For example, an index of 120 means the median household income is 120% of what is necessary to qualify for the median-priced home under prevailing interest rates. A higher number means greater affordability. 35 57 32 55 24 39 Single Family Condo/TIC/Coop September 20 40 60 80 100 1-2005 1-2006 1-2007 1-2008 1-2009 1-2010 1-2011 1-2012 1-2013 1-2014 1-2015 1-2016 1-2017 1-2018 1-2019 1-2020 1-2021 1-2022 Single Family Condo/TIC/Coop 2020 2021 2022 - 29.1% - 3.5% - 25.0% - 8.6% 2020 2021 2022 0.0% + 18.8% 35 56 31 55 22 38 Single Family Condo/TIC/Coop Year to Date 2020 2021 2022 - 30.9% - 1.8% - 29.0% - 11.4% 2020 2021 2022 + 2.9% + 7.7%
  • 14. Months Supply of Inventory Months Supply of Inventory Single Family Year-Over-Year Change Condo/TIC/ Coop Year-Over-Year Change Oct-2021 1.9 -51.3% 3.5 -62.8% Nov-2021 1.4 -54.8% 2.9 -64.2% Dec-2021 0.8 -57.9% 1.8 -62.5% Jan-2022 1.1 -42.1% 2.3 -54.0% Feb-2022 1.2 -29.4% 2.7 -42.6% Mar-2022 1.3 -18.8% 2.9 -27.5% Apr-2022 1.4 -12.5% 3.2 -8.6% May-2022 1.4 -12.5% 3.3 +6.5% Jun-2022 1.6 0.0% 3.4 +13.3% Jul-2022 1.6 0.0% 3.2 +10.3% Aug-2022 1.5 -6.3% 2.8 0.0% Sep-2022 2.1 +16.7% 3.5 0.0% 12-Month Avg* 1.4 -27.4% 3.0 -35.4% Historical Months Supply of Inventory by Month * Months Supply for all properties from October 2021 through September 2022. This is not the average of the individual figures above. Current as of October 11, 2022. All data from the San Francisco Association of REALTORS® MLS. Report © 2022 ShowingTime. | 14 The inventory of homes for sale at the end of a given month, divided by the average monthly pending sales from the last 12 months. 3.7 8.9 1.8 3.5 2.1 3.5 Single Family Condo/TIC/Coop September 0.0 2.0 4.0 6.0 8.0 10.0 12.0 1-2005 1-2006 1-2007 1-2008 1-2009 1-2010 1-2011 1-2012 1-2013 1-2014 1-2015 1-2016 1-2017 1-2018 1-2019 1-2020 1-2021 1-2022 Single Family Condo/TIC/Coop 2020 2021 2022 0.0% - 60.7% + 16.7% - 51.4% 2020 2021 2022 + 42.3% + 128.2%
  • 15. All Properties Activity Overview Key metrics by report month and for year-to-date (YTD) starting from the first of the year. Key Metrics Historical Sparkbars 9-2021 9-2022 Percent Change YTD 2021 YTD 2022 Percent Change - 7.2% Pending Sales 676 454 - 32.8% 5,931 4,602 - 22.4% New Listings 1,162 960 - 17.4% 7,692 7,139 Sold Listings 546 391 - 28.4% 5,694 4,494 - 21.1% Median Sales Price $1,450,000 $1,365,000 - 5.9% $1,410,000 $1,470,000 + 4.3% + 1.7% 34 - 10.5% $1,756,692 -- -- Days on Market 32 44 + 37.5% 38 Avg. Sales Price $1,711,273 $1,587,402 - 7.2% $1,727,930 Active Listings 1,824 1,544 - 15.4% -- % of Properties Sold Over List Price 68.5% 47.6% - 30.5% 59.5% 38 64.3% + 8.1% + 1.7% 26 - 31.6% 109.7% % of List Price Received 110.0% 104.2% - 5.3% 107.9% Current as of October 11, 2022. All data from the San Francisco Association of REALTORS® MLS. Report © 2022 ShowingTime. | 15 Months Supply 2.8 3.0 + 7.1% -- -- -- Affordability Ratio 39 29 - 25.6% 9-2019 9-2020 9-2021 9-2022 9-2019 9-2020 9-2021 9-2022 9-2019 9-2020 9-2021 9-2022 9-2019 9-2020 9-2021 9-2022 9-2019 9-2020 9-2021 9-2022 9-2019 9-2020 9-2021 9-2022 9-2019 9-2020 9-2021 9-2022 9-2019 9-2020 9-2021 9-2022 9-2019 9-2020 9-2021 9-2022 9-2019 9-2020 9-2021 9-2022 9-2019 9-2020 9-2021 9-2022
  • 16. Activity by District SF District 1: Northwest (Sea Cliff, Lake, Jordan Park / Laurel Heights, Outer Richmond, Central Richmond, Inner Richmond, Lone Mountain) SF District 2: Central West (Outer Sunset, Central Sunset, Inner Sunset, Outer Parkside, Parkside, Inner Parkside, Golden Gate Heights) SF District 3: Southwest (Pine Lake Park, Lake Shore, Merced Manor, Stonestown, Lakeside, Merced Heights, Ingleside, Ingleside Heights, Oceanview) SF District 4: Twin Peaks W (Forest Hill (& Ext), W Portal, St Francis Wd, Balboa Terr, Mt Dav Manor, Ingleside Terr, Monterey Hts, Wstwd Pk & H'lnds, Shrwd Fst, Miraloma Pk, Dmnd Hts, Mdtwn Terr) SF District 5: Central (Haight Ashbury, Cole Vly / Prnssus Hts, Clarndn Hts, Corona Hts, Twin Pks, Glen Pk, Noe Vly, Eureka Vly / Dolores Hts, Mission Dolores, Duboce Trngl, Buena Vista / Ashbury Hts) SF District 6: Central North (Lower Pacific Heights, Anza Vista, Western Addition, North Panhandle, Alamo Square, Hayes Valley) SF District 7: North (Marina, Cow Hollow, Presidio Heights, Pacific Heights) SF District 8: Northeast (North Waterfront, North Beach, Russian Hill, Telegraph Hill, Nob Hill, Financial District / Barbary Coast, Downtown, Van Ness / Civic Center, Tenderloin) SF District 9: Central East (Yerba Buena, South Beach, South of Market, Mission Bay, Inner Mission, Potrero Hill, Central Waterfront / Dogpatch, Bernal Heights) SF District 10: Southeast (Outer Mission, Mission Terr, Excelsior, Portola, Bayview, Silver Terr, Hunters Pt, Candlestick Pt, Bayview Hts, Little Hollywood, Visitation Vly, Crocker Amazon) 9-2021 9-2022 + / – 9-2021 9-2022 + / – 9-2021 9-2022 + / – 9-2021 9-2022 + / – 9-2021 9-2022 + / – Single Family 1 SF District 1 33 34 +3.0% 25 18 -28.0% $2,700,000 $2,112,500 -21.8% 20 22 +10.0% 1.7 1.8 +5.9% 2 SF District 2 61 59 -3.3% 47 43 -8.5% $1,660,000 $1,508,000 -9.2% 20 26 +30.0% 1.3 1.4 +7.7% 3 SF District 3 31 31 0.0% 17 14 -17.6% $1,400,000 $1,355,500 -3.2% 18 23 +27.8% 1.9 2.0 +5.3% 4 SF District 4 42 61 +45.2% 28 28 0.0% $1,797,500 $1,825,000 +1.5% 17 26 +52.9% 1.1 2.1 +90.9% 5 SF District 5 72 71 -1.4% 36 13 -63.9% $2,950,000 $2,637,500 -10.6% 24 25 +4.2% 1.8 2.3 +27.8% 6 SF District 6 12 5 -58.3% 3 4 +33.3% $1,875,000 $2,430,000 +29.6% 35 15 -57.1% 2.2 1.3 -40.9% 7 SF District 7 50 48 -4.0% 7 8 +14.3% $6,750,000 $3,450,000 -48.9% 19 28 +47.4% 3.9 4.9 +25.6% 8 SF District 8 21 14 -33.3% 3 2 -33.3% $3,675,000 $3,725,000 +1.4% 20 38 +90.0% 8.0 4.5 -43.8% 9 SF District 9 73 48 -34.2% 24 19 -20.8% $1,903,025 $1,649,000 -13.3% 22 37 +68.2% 2.3 2.1 -8.7% 10 SF District 10 80 91 +13.8% 55 28 -49.1% $1,180,000 $1,050,000 -11.0% 30 32 +6.7% 1.6 2.2 +37.5% Condo/TIC/Coop 1 SF District 1 44 33 -25.0% 13 12 -7.7% $1,200,000 $1,460,000 +21.7% 16 33 +106.3% 2.3 2.1 -8.7% 2 SF District 2 15 14 -6.7% 3 2 -33.3% $1,070,000 $1,557,500 +45.6% 17 32 +88.2% 2.3 4.0 +73.9% 3 SF District 3 9 6 -33.3% 2 3 +50.0% $735,000 $852,000 +15.9% 36 13 -63.9% 2.3 1.6 -30.4% 4 SF District 4 17 12 -29.4% 2 5 +150.0% $537,000 $855,000 +59.2% 69 54 -21.7% 3.1 2.3 -25.8% 5 SF District 5 119 123 +3.4% 54 36 -33.3% $1,525,000 $1,335,000 -12.5% 20 43 +115.0% 2.1 2.4 +14.3% 6 SF District 6 114 84 -26.3% 34 18 -47.1% $1,265,000 $938,436 -25.8% 30 42 +40.0% 2.8 2.4 -14.3% 7 SF District 7 113 88 -22.1% 27 12 -55.6% $1,400,000 $1,393,500 -0.5% 31 44 +41.9% 2.8 2.8 0.0% 8 SF District 8 274 194 -29.2% 50 39 -22.0% $1,105,000 $1,200,000 +8.6% 60 57 -5.0% 4.5 3.8 -15.6% 9 SF District 9 548 474 -13.5% 102 76 -25.5% $973,000 $1,088,500 +11.9% 50 70 +40.0% 4.3 4.8 +11.6% 10 SF District 10 49 25 -49.0% 5 4 -20.0% $785,000 $637,500 -18.8% 72 231 +220.8% 6.3 3.4 -46.0% Key metrics by report month for the districts of San Fransisco. Current as of October 11, 2022. All data from the San Francisco Association of REALTORS® MLS. Report © 2022 ShowingTime. | 16 Active Listings Sold Listings Median Sales Price Days on Market Months Supply