SlideShare ist ein Scribd-Unternehmen logo
1 von 16
Downloaden Sie, um offline zu lesen
April 2022 Monthly Snapshot
One-Year Change in One-Year Change in
Median Sales Price Single
Family
Median Sales Price
Condo/TIC/Coop
2
3
4
5
6
7
8
9
10
11
12
13
14
15
16
Monthly Indicators
+ 13.9% + 13.3% + 14.3%
One-Year Change in
The average 30-year fixed rate mortgage exceeded 5% in April, the highest
level since 2011, according to Freddie Mac. The recent surge in mortgage rates
has reduced the pool of eligible buyers and has caused mortgage applications
to decline, with a significant impact on refinance applications, which are down
more than 70% compared to this time last year. As the rising costs of
homeownership force many Americans to adjust their budgets, an increasing
number of buyers are hoping to help offset the costs by moving from bigger,
more expensive cities to smaller areas that offer a more affordable cost of
living.
New Listings were down 38.7 percent for single family homes and 26.4 percent
for Condo/TIC/Coop properties. Pending Sales decreased 7.3 percent for single
family homes and 29.9 percent for Condo/TIC/Coop properties.
The Median Sales Price was up 13.9 percent to $2,050,000 for single family
homes and 13.3 percent to $1,360,000 for Condo/TIC/Coop properties. Months
Supply of Inventory decreased 44.4 percent for single family units and 27.1
percent for Condo/TIC/Coop units.
Affordability challenges are limiting buying activity, and early signs suggest
competition for homes may be cooling somewhat. Nationally, existing home
sales are down 2.7% as of last measure, while pending sales dropped 1.2%,
marking 5 straight months of under contract declines, according to the National
Association of REALTORS®. Inventory remains low, with only 2 months supply
at present, and home prices continue to rise, with the median existing home at
$373,500, a 15% increase from this time last year. Homes are still selling
quickly, however, and multiple offers are common in many markets.
Median Sales Price
All Property Types
Residential real estate activity in San Francisco County (Districts 1-10)
composed of single-family properties, townhomes and condominiums. Percent
changes are calculated using rounded figures.
Single Family Activity Overview
Months Supply of Inventory
For questions or more information, contact
communications@sfrealtors.com.
Current as of May 11, 2022. All data from the San Francisco Association of REALTORS® MLS. Report © 2022 ShowingTime.
Condo/TIC/Coop Activity Overview
Inventory of Active Listings
% of Properties Sold Over List Price
% of List Price Received
Housing Affordability Ratio
All Properties Activity Overview
New Listings
Pending Sales
Sold Listings
Median Sales Price
Average Sales Price
Days on Market Until Sale
Activity by District
Single Family Activity Overview
Key metrics by report month and for year-to-date (YTD) starting from the first of the year.
Key Metrics Historical Sparkbars 4-2021 4-2022 Percent Change YTD 2021 YTD 2022 Percent Change
Current as of May 11, 2022. All data from the San Francisco Association of REALTORS® MLS. Report © 2022 ShowingTime. | 2
Months Supply 2.7 1.5 - 44.4% -- -- --
Affordability Ratio 31 21 - 32.3%
% of List Price Received 113.8% 123.2% + 8.3% 111.0%
33
85.6% + 21.1%
+ 9.5%
23 - 30.3%
121.5%
% of Properties Sold Over List Price 76.1% 89.1% + 17.1% 70.7%
Active Listings 673 372 - 44.7% --
Avg. Sales Price $2,430,795 $2,516,916 + 3.5% $2,244,311
Days on Market 19 15 - 21.1% 25 19 - 24.0%
$2,419,123
-- --
Median Sales Price $1,800,000 $2,050,000 + 13.9% $1,705,000
Sold Listings 289 256 - 11.4% 883
New Listings 354 217 - 38.7% 1,265
Pending Sales 286 265 - 7.3% - 5.6%
971 917
- 16.0%
1,063
799 - 9.5%
$1,925,000 + 12.9%
+ 7.8%
4-2019 4-2020 4-2021 4-2022
4-2019 4-2020 4-2021 4-2022
4-2019 4-2020 4-2021 4-2022
4-2019 4-2020 4-2021 4-2022
4-2019 4-2020 4-2021 4-2022
4-2019 4-2020 4-2021 4-2022
4-2019 4-2020 4-2021 4-2022
4-2019 4-2020 4-2021 4-2022
4-2019 4-2020 4-2021 4-2022
4-2019 4-2020 4-2021 4-2022
4-2019 4-2020 4-2021 4-2022
Condo/TIC/Coop Activity Overview
Key metrics by report month and for year-to-date (YTD) starting from the first of the year.
Key Metrics Historical Sparkbars 4-2021 4-2022 Percent Change YTD 2021 YTD 2022 Percent Change
Current as of May 11, 2022. All data from the San Francisco Association of REALTORS® MLS. Report © 2022 ShowingTime. | 3
Months Supply 4.8 3.5 - 27.1% -- -- --
Affordability Ratio 55 37 - 32.7%
% of List Price Received 103.7% 107.3% + 3.5% 101.8%
55
56.6% + 48.2%
+ 3.9%
40 - 27.3%
105.8%
% of Properties Sold Over List Price 45.0% 63.1% + 40.2% 38.2%
Active Listings 1,523 1,220 - 19.9% --
Avg. Sales Price $1,347,315 $1,461,478 + 8.5% $1,328,618
Days on Market 45 29 - 35.6% 53
$1,250,000 + 5.0%
+ 6.1%
36 - 32.1%
$1,409,856
-- --
Sold Listings 462 369 - 20.1% 1,467 1,197 - 18.4%
Median Sales Price $1,200,000 $1,360,000 + 13.3% $1,190,000
- 11.3%
Pending Sales 479 336 - 29.9% 1,626 1,309 - 19.5%
New Listings 515 379 - 26.4% 2,171 1,926
4-2019 4-2020 4-2021 4-2022
4-2019 4-2020 4-2021 4-2022
4-2019 4-2020 4-2021 4-2022
4-2019 4-2020 4-2021 4-2022
4-2019 4-2020 4-2021 4-2022
4-2019 4-2020 4-2021 4-2022
4-2019 4-2020 4-2021 4-2022
4-2019 4-2020 4-2021 4-2022
4-2019 4-2020 4-2021 4-2022
4-2019 4-2020 4-2021 4-2022
4-2019 4-2020 4-2021 4-2022
New Listings
New Listings
Single
Family
Year-Over-Year
Change
Condo/TIC/
Coop
Year-Over-Year
Change
May-2021 314 +14.2% 527 +4.6%
Jun-2021 324 -9.7% 494 -14.7%
Jul-2021 304 -25.3% 428 -38.8%
Aug-2021 302 -14.7% 438 -32.8%
Sep-2021 376 +5.9% 586 -12.0%
Oct-2021 273 -26.6% 460 -11.9%
Nov-2021 164 -32.2% 277 +8.6%
Dec-2021 105 -28.6% 216 -12.9%
Jan-2022 259 +0.4% 504 -5.6%
Feb-2022 280 -8.5% 514 +2.4%
Mar-2022 307 -11.5% 529 -14.7%
Apr-2022 217 -38.7% 379 -26.4%
12-Month Avg 269 -14.6% 446 -15.0%
Historical New Listings by Month
Current as of May 11, 2022. All data from the San Francisco Association of REALTORS® MLS. Report © 2022 ShowingTime. | 4
A count of the properties that have been newly listed on the market in a given month.
176
230
354
515
217
379
Single Family Condo/TIC/Coop
April
0
200
400
600
800
1-2005 1-2006 1-2007 1-2008 1-2009 1-2010 1-2011 1-2012 1-2013 1-2014 1-2015 1-2016 1-2017 1-2018 1-2019 1-2020 1-2021 1-2022
Single Family Condo/TIC/Coop
881
1,273
1,265
2,171
1,063
1,926
Single Family Condo/TIC/Coop
Year to Date
2020 2021 2022
- 26.4%
+ 123.9%
- 38.7%
+ 101.1% + 70.5%
- 16.0%
+ 43.6% - 11.3%
2020 2021 2022 2020 2021 2022 2020 2021 2022
- 36.2% - 12.2% - 10.9%
- 37.3%
Pending Sales
Pending Sales
Single
Family
Year-Over-Year
Change
Condo/TIC/
Coop
Year-Over-Year
Change
May-2021 307 +89.5% 461 +224.6%
Jun-2021 275 +21.1% 388 +65.8%
Jul-2021 259 -6.2% 364 +50.4%
Aug-2021 226 -3.8% 316 -1.9%
Sep-2021 331 +17.8% 336 +9.8%
Oct-2021 273 -12.2% 403 +21.0%
Nov-2021 260 -15.3% 362 +20.7%
Dec-2021 129 -37.1% 226 -26.4%
Jan-2022 145 -14.7% 251 -14.0%
Feb-2022 216 -4.0% 293 -23.1%
Mar-2022 291 +0.3% 429 -9.5%
Apr-2022 265 -7.3% 336 -29.9%
12-Month Avg 248 +0.1% 347 +9.3%
Historical Pending Sales by Month
A count of the properties on which offers have been accepted in a given month.
Current as of May 11, 2022. All data from the San Francisco Association of REALTORS® MLS. Report © 2022 ShowingTime. | 5
79 92
286
479
265
336
Single Family Condo/TIC/Coop
April
0
100
200
300
400
500
1-2005 1-2006 1-2007 1-2008 1-2009 1-2010 1-2011 1-2012 1-2013 1-2014 1-2015 1-2016 1-2017 1-2018 1-2019 1-2020 1-2021 1-2022
Single Family Condo/TIC/Coop
517
664
971
1,626
917
1,309
Single Family Condo/TIC/Coop
Year to Date
2020 2021 2022
- 29.9%
+ 420.7%
- 7.3%
+ 262.0% - 5.6%
+ 87.8% +144.9% - 19.5%
2020 2021 2022 2020 2021 2022 2020 2021 2022
- 68.5% - 30.5% - 31.5%
- 70.0%
Sold Listings
Sold Listings
Single
Family
Year-Over-Year
Change
Condo/TIC/
Coop
Year-Over-Year
Change
May-2021 266 +133.3% 443 +288.6%
Jun-2021 325 +79.6% 471 +166.1%
Jul-2021 255 +7.1% 369 +38.7%
Aug-2021 256 +5.3% 348 +45.0%
Sep-2021 245 -4.7% 291 -9.9%
Oct-2021 310 +1.6% 362 +24.0%
Nov-2021 292 +2.8% 423 +24.0%
Dec-2021 216 -28.5% 325 -7.9%
Jan-2022 129 -19.9% 186 -31.1%
Feb-2022 159 -2.5% 250 -10.1%
Mar-2022 255 -5.6% 392 -14.2%
Apr-2022 256 -11.4% 369 -20.1%
12-Month Avg 247 +5.6% 352 +18.4%
Historical Sold Listings by Month
A count of the actual sales that closed in a given month.
Current as of May 11, 2022. All data from the San Francisco Association of REALTORS® MLS. Report © 2022 ShowingTime. | 6
120 117
289
462
256
369
Single Family Condo/TIC/Coop
April
0
100
200
300
400
500
1-2005 1-2006 1-2007 1-2008 1-2009 1-2010 1-2011 1-2012 1-2013 1-2014 1-2015 1-2016 1-2017 1-2018 1-2019 1-2020 1-2021 1-2022
Single Family Condo/TIC/Coop
539
682
883
1,467
799
1,197
Single Family Condo/TIC/Coop
Year to Date
2020 2021 2022
- 20.1%
+ 294.9%
- 11.4%
+ 140.8% - 9.5%
+ 63.8% +115.1% - 18.4%
2020 2021 2022 2020 2021 2022 2020 2021 2022
- 51.8% - 20.3% - 22.4%
- 64.0%
Median Sales Price
Median Sales Price
Single
Family
Year-Over-Year
Change
Condo/TIC/
Coop
Year-Over-Year
Change
May-2021 $1,886,500 +18.8% $1,227,000 +12.8%
Jun-2021 $1,950,000 +12.7% $1,250,000 +2.0%
Jul-2021 $1,850,000 +15.3% $1,210,000 -4.0%
Aug-2021 $1,847,500 +13.7% $1,150,000 -5.0%
Sep-2021 $1,750,000 +6.1% $1,200,000 +2.1%
Oct-2021 $1,805,000 +12.5% $1,242,500 +7.8%
Nov-2021 $1,884,444 +15.1% $1,260,000 +7.5%
Dec-2021 $1,690,000 +9.0% $1,300,000 +18.2%
Jan-2022 $1,630,000 +3.5% $1,070,000 -0.2%
Feb-2022 $1,930,000 +17.0% $1,227,500 +2.6%
Mar-2022 $2,060,000 +19.4% $1,209,250 -1.0%
Apr-2022 $2,050,000 +13.9% $1,360,000 +13.3%
12-Month Avg* $1,855,000 +12.4% $1,240,000 +5.1%
Historical Median Sales Price by Month
Point at which half of the sales sold for more and half sold for less, not accounting for seller concessions, in a given month.
* Median Sales Price for all properties from May 2021 through April 2022. This is not the average
of the individual figures above.
Current as of May 11, 2022. All data from the San Francisco Association of REALTORS® MLS. Report © 2022 ShowingTime. | 7
$1,605,000
$1,275,000
$1,800,000
$1,200,000
$2,050,000
$1,360,000
Single Family Condo/TIC/Coop
April
$500,000
$750,000
$1,000,000
$1,250,000
$1,500,000
$1,750,000
$2,000,000
$2,250,000
1-2005 1-2006 1-2007 1-2008 1-2009 1-2010 1-2011 1-2012 1-2013 1-2014 1-2015 1-2016 1-2017 1-2018 1-2019 1-2020 1-2021 1-2022
Single Family Condo/TIC/Coop
$1,570,000
$1,220,000
$1,705,000
$1,190,000
$1,925,000
$1,250,000
Single Family Condo/TIC/Coop
Year to Date
2020 2021 2022
+ 13.3%
- 5.9%
+ 13.9%
+ 12.1% - 2.5%
+ 12.9%
+ 8.6% + 5.0%
2020 2021 2022 2020 2021 2022 2020 2021 2022
+ 0.3% + 1.9% + 3.8%
+ 4.1%
Average Sales Price
Average Sales
Price
Single
Family
Year-Over-Year
Change
Condo/TIC/
Coop
Year-Over-Year
Change
May-2021 $2,479,992 +32.1% $1,379,360 +10.2%
Jun-2021 $2,504,876 +13.8% $1,388,929 -1.9%
Jul-2021 $2,292,230 +13.8% $1,357,053 -2.9%
Aug-2021 $2,128,296 +7.1% $1,425,053 +7.4%
Sep-2021 $2,165,489 +14.2% $1,330,272 +1.9%
Oct-2021 $2,359,157 +23.7% $1,456,361 +16.3%
Nov-2021 $2,359,312 +15.9% $1,539,719 +21.1%
Dec-2021 $2,365,749 +17.5% $1,488,734 +16.1%
Jan-2022 $1,977,367 +1.6% $1,311,263 +8.3%
Feb-2022 $2,417,245 +7.1% $1,398,389 +4.0%
Mar-2022 $2,545,596 +14.9% $1,415,356 +3.4%
Apr-2022 $2,516,916 +3.5% $1,461,478 +8.5%
12-Month Avg* $2,360,934 +14.0% $1,418,530 +7.7%
Historical Average Sales Price by Month
Average sales price for all closed sales, not accounting for seller concessions, in a given month.
* Avg. Sales Price for all properties from May 2021 through April 2022. This is not the average of
the individual figures above.
Current as of May 11, 2022. All data from the San Francisco Association of REALTORS® MLS. Report © 2022 ShowingTime. | 8
$2,183,677
$1,347,363
$2,430,795
$1,347,315
$2,516,916
$1,461,478
Single Family Condo/TIC/Coop
April
$500,000
$1,000,000
$1,500,000
$2,000,000
$2,500,000
$3,000,000
1-2005 1-2006 1-2007 1-2008 1-2009 1-2010 1-2011 1-2012 1-2013 1-2014 1-2015 1-2016 1-2017 1-2018 1-2019 1-2020 1-2021 1-2022
Single Family Condo/TIC/Coop
$2,053,979
$1,337,510
$2,244,311
$1,328,618
$2,419,123
$1,409,856
Single Family Condo/TIC/Coop
Year to Date
2020 2021 2022
+ 8.5%
- 0.0%
+ 3.5%
+ 11.3% - 0.7%
+ 7.8%
+ 9.3% + 6.1%
2020 2021 2022 2020 2021 2022 2020 2021 2022
+ 0.1% + 4.0% + 1.5%
- 0.2%
Days on Market Until Sale
Days on Market
Until Sale
Single
Family
Year-Over-Year
Change
Condo/TIC/
Coop
Year-Over-Year
Change
May-2021 18 -25.0% 36 -10.0%
Jun-2021 17 -34.6% 35 +2.9%
Jul-2021 18 -28.0% 40 +5.3%
Aug-2021 24 0.0% 40 0.0%
Sep-2021 22 -12.0% 37 -17.8%
Oct-2021 19 -29.6% 34 -17.1%
Nov-2021 20 -39.4% 40 -20.0%
Dec-2021 30 -14.3% 45 -27.4%
Jan-2022 37 +2.8% 62 -11.4%
Feb-2022 19 -36.7% 33 -46.8%
Mar-2022 15 -34.8% 32 -28.9%
Apr-2022 15 -21.1% 29 -35.6%
12-Month Avg* 20 -25.0% 38 -22.1%
Historical Days on Market Until Sale by Month
Average number of days between when a property is listed and when an offer is accepted in a given month.
* Days on Market for all properties from May 2021 through April 2022. This is not the average of
the individual figures above.
Current as of May 11, 2022. All data from the San Francisco Association of REALTORS® MLS. Report © 2022 ShowingTime. | 9
20
32
19
45
15
29
Single Family Condo/TIC/Coop
April
0
20
40
60
80
100
120
1-2005 1-2006 1-2007 1-2008 1-2009 1-2010 1-2011 1-2012 1-2013 1-2014 1-2015 1-2016 1-2017 1-2018 1-2019 1-2020 1-2021 1-2022
Single Family Condo/TIC/Coop
25
36
25
53
19
36
Single Family Condo/TIC/Coop
Year to Date
2020 2021 2022
- 35.6%
+ 40.6%
- 21.1%
- 5.0% + 47.2%
- 24.0%
0.0% - 32.1%
2020 2021 2022 2020 2021 2022 2020 2021 2022
- 25.9% - 13.8% - 10.0%
- 15.8%
Inventory of Active Listings
Inventory of Active
Listings
Single
Family
Year-Over-Year
Change
Condo/TIC/
Coop
Year-Over-Year
Change
May-2021 643 -6.5% 1,501 +11.8%
Jun-2021 641 -18.1% 1,484 -5.3%
Jul-2021 649 -24.5% 1,456 -24.6%
Aug-2021 682 -26.2% 1,470 -30.3%
Sep-2021 679 -26.8% 1,613 -30.5%
Oct-2021 635 -31.4% 1,549 -34.2%
Nov-2021 505 -36.2% 1,350 -35.5%
Dec-2021 368 -37.1% 1,004 -33.3%
Jan-2022 458 -23.0% 1,193 -25.6%
Feb-2022 492 -21.8% 1,334 -16.3%
Mar-2022 470 -26.2% 1,316 -17.0%
Apr-2022 372 -44.7% 1,220 -19.9%
12-Month Avg* 550 -26.9% 1,374 -23.4%
Historical Inventory of Active Listings by Month
The number of properties available for sale in active status at the end of a given month.
* Active Listings for all properties from May 2021 through April 2022. This is not the average of
the individual figures above.
Current as of May 11, 2022. All data from the San Francisco Association of REALTORS® MLS. Report © 2022 ShowingTime. | 10
608
1,071
673
1,523
372
1,220
Single Family Condo/TIC/Coop
April
0
500
1,000
1,500
2,000
2,500
1-2005 1-2006 1-2007 1-2008 1-2009 1-2010 1-2011 1-2012 1-2013 1-2014 1-2015 1-2016 1-2017 1-2018 1-2019 1-2020 1-2021 1-2022
Single Family Condo/TIC/Coop
2020 2021 2022
- 19.9%
+ 42.2%
- 44.7%
+ 10.7%
2020 2021 2022
+ 18.8% + 27.8%
% of Properties Sold Over List Price
% of Properties
Sold Over List Price
Single
Family
Year-Over-Year
Change
Condo/TIC/
Coop
Year-Over-Year
Change
May-2021 79.7% +26.1% 53.5% +27.1%
Jun-2021 82.5% +49.5% 54.4% +74.9%
Jul-2021 83.5% +29.1% 55.6% +25.2%
Aug-2021 84.4% +28.3% 54.6% +59.6%
Sep-2021 84.5% +30.0% 54.6% +58.7%
Oct-2021 84.5% +25.2% 61.0% +42.5%
Nov-2021 79.8% +29.5% 55.6% +69.5%
Dec-2021 78.7% +25.1% 46.5% +62.6%
Jan-2022 76.0% +31.5% 38.7% +76.7%
Feb-2022 86.8% +27.5% 58.4% +65.4%
Mar-2022 86.3% +16.5% 57.9% +35.0%
Apr-2022 89.1% +17.1% 63.1% +40.2%
12-Month Avg 83.2% +26.3% 55.1% +50.1%
Historical % of Properties Sold Over List Price by Month
Percentage found when dividing the number of properties sold by properties sold over its original list price, not accounting for seller
concessions.
* % of Properties Sold Over List Price for all properties from May 2021 through April 2022. This is
not the average of the individual figures above.
Current as of May 11, 2022. All data from the San Francisco Association of REALTORS® MLS. Report © 2022 ShowingTime. | 11
70.0%
59.8%
76.1%
45.0%
89.1%
63.1%
Single Family Condo/TIC/Coop
April
0.0%
20.0%
40.0%
60.0%
80.0%
100.0%
1-2005 1-2006 1-2007 1-2008 1-2009 1-2010 1-2011 1-2012 1-2013 1-2014 1-2015 1-2016 1-2017 1-2018 1-2019 1-2020 1-2021 1-2022
Single Family Condo/TIC/Coop
72.1%
54.8%
70.7%
38.2%
85.6%
56.6%
Single Family Condo/TIC/Coop
Year to Date
2020 2021 2022
+ 40.2%
- 24.7%
+ 17.1%
+ 8.7% - 30.3%
+ 21.1%
- 1.9% + 48.2%
2020 2021 2022 2020 2021 2022 2020 2021 2022
- 4.2% + 0.7% + 4.2%
+ 7.4%
% of List Price Received
% of List Price
Received
Single
Family
Year-Over-Year
Change
Condo/TIC/
Coop
Year-Over-Year
Change
May-2021 116.8% +10.4% 105.2% +4.8%
Jun-2021 116.3% +10.1% 105.3% +5.4%
Jul-2021 118.5% +11.8% 104.8% +3.8%
Aug-2021 116.1% +8.0% 104.3% +3.9%
Sep-2021 116.3% +8.9% 105.0% +4.8%
Oct-2021 117.0% +8.2% 105.6% +4.2%
Nov-2021 115.0% +8.5% 104.6% +4.4%
Dec-2021 114.3% +7.8% 103.5% +4.2%
Jan-2022 117.7% +11.8% 101.1% +2.4%
Feb-2022 121.2% +10.5% 106.1% +5.4%
Mar-2022 122.1% +8.8% 106.4% +3.9%
Apr-2022 123.2% +8.3% 107.3% +3.5%
12-Month Avg* 117.7% +9.0% 105.1% +4.1%
Historical % of List Price Received by Month
Percentage found when dividing a property’s sales price by its most recent list price, then taking the average for all properties sold in a given
month, not accounting for seller concessions.
* % of List Price Received for all properties from May 2021 through April 2022. This is not the
average of the individual figures above.
Current as of May 11, 2022. All data from the San Francisco Association of REALTORS® MLS. Report © 2022 ShowingTime. | 12
108.8% 105.3%
113.8%
103.7%
123.2%
107.3%
Single Family Condo/TIC/Coop
April
110.9%
103.8%
111.0%
101.8%
121.5%
105.8%
Single Family Condo/TIC/Coop
Year to Date
90.0%
100.0%
110.0%
120.0%
130.0%
1-2005 1-2006 1-2007 1-2008 1-2009 1-2010 1-2011 1-2012 1-2013 1-2014 1-2015 1-2016 1-2017 1-2018 1-2019 1-2020 1-2021 1-2022
Single Family Condo/TIC/Coop
2020 2021 2022
+ 3.5%
- 1.5%
+ 8.3%
+ 4.6%
2020 2021 2022
- 2.5% + 0.4%
2020 2021 2022
+ 3.9%
- 1.9%
+ 9.5%
+ 0.1%
2020 2021 2022
+ 0.3% - 0.2%
Housing Affordability Ratio
Housing
Affordability Ratio
Single
Family
Year-Over-Year
Change
Condo/TIC/
Coop
Year-Over-Year
Change
May-2021 30 -14.3% 54 -8.5%
Jun-2021 28 -12.5% 52 -3.7%
Jul-2021 30 -14.3% 54 +1.9%
Aug-2021 30 -14.3% 57 +1.8%
Sep-2021 32 -8.6% 55 -3.5%
Oct-2021 31 -13.9% 53 -10.2%
Nov-2021 30 -14.3% 54 -8.5%
Dec-2021 32 -13.5% 49 -21.0%
Jan-2022 32 -11.1% 57 -9.5%
Feb-2022 27 -18.2% 49 -7.5%
Mar-2022 23 -28.1% 45 -13.5%
Apr-2022 21 -32.3% 37 -32.7%
12-Month Avg* 29 -38.8% 51 -35.0%
Historical Housing Affordability Ratio by Month
This index measures housing affordability for the region. For example, an index of 120 means the median household income is 120% of what is
necessary to qualify for the median-priced home under prevailing interest rates. A higher number means greater affordability.
* Affordability Ratio for all properties from May 2021 through April 2022. This is not the average of
the individual figures above.
Current as of May 11, 2022. All data from the San Francisco Association of REALTORS® MLS. Report © 2022 ShowingTime. | 13
34
51
31
55
21
37
Single Family Condo/TIC/Coop
April
20
40
60
80
100
1-2005 1-2006 1-2007 1-2008 1-2009 1-2010 1-2011 1-2012 1-2013 1-2014 1-2015 1-2016 1-2017 1-2018 1-2019 1-2020 1-2021 1-2022
Single Family Condo/TIC/Coop
2020 2021 2022
- 32.7%
+ 7.8%
- 32.3%
- 8.8%
2020 2021 2022
+ 9.7% + 6.3%
35
53
33
55
23
40
Single Family Condo/TIC/Coop
Year to Date
2020 2021 2022
- 27.3%
+ 3.8%
- 30.3%
- 5.7%
2020 2021 2022
+ 6.1% + 6.0%
Months Supply of Inventory
Months Supply of
Inventory
Single
Family
Year-Over-Year
Change
Condo/TIC/
Coop
Year-Over-Year
Change
May-2021 2.5 -35.9% 4.4 -34.3%
Jun-2021 2.4 -45.5% 4.2 -46.2%
Jul-2021 2.5 -46.8% 4.0 -58.3%
Aug-2021 2.6 -46.9% 4.0 -60.0%
Sep-2021 2.6 -45.8% 4.4 -58.5%
Oct-2021 2.4 -48.9% 4.1 -61.7%
Nov-2021 2.0 -48.7% 3.6 -61.3%
Dec-2021 1.5 -46.4% 2.7 -57.1%
Jan-2022 1.8 -35.7% 3.2 -50.8%
Feb-2022 2.0 -28.6% 3.7 -39.3%
Mar-2022 1.9 -32.1% 3.7 -33.9%
Apr-2022 1.5 -44.4% 3.5 -27.1%
12-Month Avg* 2.1 -43.6% 3.8 -51.8%
Historical Months Supply of Inventory by Month
The inventory of homes for sale at the end of a given month, divided by the average monthly pending sales from the last 12 months.
* Months Supply for all properties from May 2021 through April 2022. This is not the average of
the individual figures above.
Current as of May 11, 2022. All data from the San Francisco Association of REALTORS® MLS. Report © 2022 ShowingTime. | 14
3.3
4.9
2.7
4.8
1.5
3.5
Single Family Condo/TIC/Coop
April
0.0
2.0
4.0
6.0
8.0
10.0
12.0
1-2005 1-2006 1-2007 1-2008 1-2009 1-2010 1-2011 1-2012 1-2013 1-2014 1-2015 1-2016 1-2017 1-2018 1-2019 1-2020 1-2021 1-2022
Single Family Condo/TIC/Coop
2020 2021 2022
- 27.1%
- 2.0%
- 44.4%
- 18.2%
2020 2021 2022
+ 32.0% + 44.1%
All Properties Activity Overview
Key metrics by report month and for year-to-date (YTD) starting from the first of the year.
Key Metrics Historical Sparkbars 4-2021 4-2022 Percent Change YTD 2021 YTD 2022 Percent Change
Current as of May 11, 2022. All data from the San Francisco Association of REALTORS® MLS. Report © 2022 ShowingTime. | 15
Months Supply 3.9 2.7 - 30.8% -- -- --
Affordability Ratio 38 27 - 28.9%
% of List Price Received 107.6% 113.8% + 5.8% 105.2%
40
68.2% + 35.3%
+ 6.5%
28 - 30.0%
112.0%
% of Properties Sold Over List Price 57.1% 73.9% + 29.4% 50.4%
Active Listings 2,235 1,624 - 27.3% --
Avg. Sales Price $1,763,711 $1,885,960 + 6.9% $1,675,768
Days on Market 34 24 - 29.4% 43
$1,500,000 + 11.1%
+ 8.0%
30 - 30.2%
$1,810,347
-- --
Sold Listings 760 631 - 17.0% 2,381 2,016 - 15.3%
Median Sales Price $1,400,000 $1,600,000 + 14.3% $1,350,000
- 13.2%
Pending Sales 773 606 - 21.6% 2,625 2,246 - 14.4%
New Listings 883 605 - 31.5% 3,481 3,020
4-2019 4-2020 4-2021 4-2022
4-2019 4-2020 4-2021 4-2022
4-2019 4-2020 4-2021 4-2022
4-2019 4-2020 4-2021 4-2022
4-2019 4-2020 4-2021 4-2022
4-2019 4-2020 4-2021 4-2022
4-2019 4-2020 4-2021 4-2022
4-2019 4-2020 4-2021 4-2022
4-2019 4-2020 4-2021 4-2022
4-2019 4-2020 4-2021 4-2022
4-2019 4-2020 4-2021 4-2022
Activity by District
SF District 1: Northwest (Sea Cliff, Lake, Jordan Park / Laurel Heights, Outer Richmond, Central Ric The
SF District 2: Central West (Outer Sunset, Central Sunset, Inner Sunset, Outer Parkside, Parkside, Inner Parkside, Golden Gate Heights)
SF District 3: Southwest (Pine Lake Park, Lake Shore, Merced Manor, Stonestown, Lakeside, Merced Heights, Ingleside, Ingleside Heights, Oceanview)
SF District 4: Twin Peaks W (Forest Hill (& Ext), W Portal, St Francis Wd, Balboa Terr, Mt Dav Manor, Ingleside Terr, Monterey Hts, Wstwd Pk & H'lnds, Shrwd Fst, Miraloma Pk, Dmnd Hts, Mdtwn Terr)
SF District 5: Central (Haight Ashbury, Cole Vly / Prnssus Hts, Clarndn Hts, Corona Hts, Twin Pks, Glen Pk, Noe Vly, Eureka Vly / Dolores Hts, Mission Dolores, Duboce Trngl, Buena Vista / Ashbury Hts)
SF District 6: Central North (Lower Pacific Heights, Anza Vista, Western Addition, North Panhandle, Alamo Square, Hayes Valley)
SF District 7: North (Marina, Cow Hollow, Presidio Heights, Pacific Heights)
SF District 8: Northeast (North Waterfront, North Beach, Russian Hill, Telegraph Hill, Nob Hill, Financial District / Barbary Coast, Downtown, Van Ness / Civic Center, Tenderloin)
SF District 9: Central East (Yerba Buena, South Beach, South of Market, Mission Bay, Inner Mission, Potrero Hill, Central Waterfront / Dogpatch, Bernal Heights)
SF District 10: Southeast (Outer Mission, Mission Terr, Excelsior, Portola, Bayview, Silver Terr, Hunters Pt, Candlestick Pt, Bayview Hts, Little Hollywood, Visitation Vly, Crocker Amazon)
4-2021 4-2022 + / – 4-2021 4-2022 + / – 4-2021 4-2022 + / – 4-2021 4-2022 + / – 4-2021 4-2022 + / –
Single Family
1 SF District 1 28 25 -10.7% 17 31 +82.4% $2,482,000 $3,000,000 +20.9% 20 12 -40.0% 1.4 1.1 -21.4%
2 SF District 2 75 55 -26.7% 57 43 -24.6% $1,688,000 $1,900,000 +12.6% 13 11 -15.4% 1.8 1.2 -33.3%
3 SF District 3 34 24 -29.4% 19 18 -5.3% $1,400,000 $1,770,000 +26.4% 15 11 -26.7% 2.1 1.5 -28.6%
4 SF District 4 72 36 -50.0% 39 26 -33.3% $2,040,000 $2,168,863 +6.3% 12 13 +8.3% 2.0 1.1 -45.0%
5 SF District 5 133 62 -53.4% 48 39 -18.8% $2,517,500 $2,850,000 +13.2% 24 18 -25.0% 3.5 1.7 -51.4%
6 SF District 6 20 7 -65.0% 6 4 -33.3% $3,190,000 $3,575,000 +12.1% 19 11 -42.1% 3.6 1.4 -61.1%
7 SF District 7 66 33 -50.0% 19 11 -42.1% $5,900,000 $4,100,000 -30.5% 33 22 -33.3% 6.2 2.8 -54.8%
8 SF District 8 22 20 -9.1% 2 6 +200.0% $2,600,000 $3,125,001 +20.2% 99 27 -72.7% 9.3 6.5 -30.1%
9 SF District 9 106 36 -66.0% 38 34 -10.5% $1,677,924 $1,920,000 +14.4% 21 19 -9.5% 3.5 1.3 -62.9%
10 SF District 10 117 74 -36.8% 44 44 0.0% $1,200,000 $1,350,000 +12.5% 16 14 -12.5% 2.5 1.6 -36.0%
Condo/TIC/Coop
1 SF District 1 36 35 -2.8% 24 18 -25.0% $1,392,500 $1,497,500 +7.5% 28 20 -28.6% 1.9 2.0 +5.3%
2 SF District 2 15 11 -26.7% 9 4 -55.6% $1,100,000 $1,350,000 +22.7% 13 16 +23.1% 2.6 2.3 -11.5%
3 SF District 3 6 6 0.0% 7 3 -57.1% $1,350,000 $890,000 -34.1% 105 21 -80.0% 1.7 1.6 -5.9%
4 SF District 4 14 17 +21.4% 5 13 +160.0% $1,000,000 $800,000 -20.0% 24 33 +37.5% 2.6 3.0 +15.4%
5 SF District 5 142 125 -12.0% 64 64 0.0% $1,350,000 $1,587,000 +17.6% 29 17 -41.4% 2.7 2.3 -14.8%
6 SF District 6 120 102 -15.0% 44 47 +6.8% $1,189,500 $1,385,000 +16.4% 36 33 -8.3% 3.2 2.6 -18.8%
7 SF District 7 148 96 -35.1% 57 40 -29.8% $1,595,000 $1,875,000 +17.6% 37 16 -56.8% 4.0 2.6 -35.0%
8 SF District 8 287 251 -12.5% 75 56 -25.3% $1,175,000 $1,262,500 +7.4% 50 35 -30.0% 5.8 4.1 -29.3%
9 SF District 9 699 536 -23.3% 168 116 -31.0% $1,150,000 $1,210,000 +5.2% 54 36 -33.3% 6.8 4.5 -33.8%
10 SF District 10 56 41 -26.8% 9 8 -11.1% $700,000 $727,500 +3.9% 60 67 +11.7% 8.4 5.1 -39.3%
Key metrics by report month for the districts of San Fransisco.
Current as of May 11, 2022. All data from the San Francisco Association of REALTORS® MLS. Report © 2022 ShowingTime. | 16
Active Listings Sold Listings Median Sales Price Days on Market Months Supply

Weitere ähnliche Inhalte

Ähnlich wie San Francisco Market Report April 2022.pdf

San Francisco Market Report December 2021
San Francisco Market Report December 2021San Francisco Market Report December 2021
San Francisco Market Report December 2021Ronny Budiutama
 
San Francisco Market Report December 2022.pdf
San Francisco Market Report December 2022.pdfSan Francisco Market Report December 2022.pdf
San Francisco Market Report December 2022.pdfRonny Budiutama
 
San Francisco Market Report October 2022.pdf
San Francisco Market Report October 2022.pdfSan Francisco Market Report October 2022.pdf
San Francisco Market Report October 2022.pdfRonny Budiutama
 
San Francisco Market Report November 2022.pdf
San Francisco Market Report November 2022.pdfSan Francisco Market Report November 2022.pdf
San Francisco Market Report November 2022.pdfRonny Budiutama
 
San Francisco Market Report February 2023
San Francisco Market Report February 2023San Francisco Market Report February 2023
San Francisco Market Report February 2023Ronny Budiutama
 
San Francisco December 2023 Market Report
San Francisco December 2023 Market ReportSan Francisco December 2023 Market Report
San Francisco December 2023 Market ReportRonny Budiutama
 
San Francisco Market Report October 2021
San Francisco Market Report October 2021San Francisco Market Report October 2021
San Francisco Market Report October 2021Ronny Budiutama
 
San Francisco May 2023 Market Report.pdf
San Francisco May 2023 Market Report.pdfSan Francisco May 2023 Market Report.pdf
San Francisco May 2023 Market Report.pdfRonny Budiutama
 
San Francisco Market Report March 2023.pdf
San Francisco Market Report March 2023.pdfSan Francisco Market Report March 2023.pdf
San Francisco Market Report March 2023.pdfRonny Budiutama
 
San Francisco market focus report December 2019
San Francisco market focus report December 2019San Francisco market focus report December 2019
San Francisco market focus report December 2019Ronny Budiutama
 
San Francisco Market Report January 2023.pdf
San Francisco Market Report January 2023.pdfSan Francisco Market Report January 2023.pdf
San Francisco Market Report January 2023.pdfRonny Budiutama
 
San Francisco Market Report June 2021
San Francisco Market Report June 2021San Francisco Market Report June 2021
San Francisco Market Report June 2021Ronny Budiutama
 
San Francisco Market Report November 2021
San Francisco Market Report November 2021San Francisco Market Report November 2021
San Francisco Market Report November 2021Ronny Budiutama
 
San Francisco Market Report September 2021
San Francisco Market Report September 2021San Francisco Market Report September 2021
San Francisco Market Report September 2021Ronny Budiutama
 
San Francisco January 2024 Market Report
San Francisco January 2024 Market ReportSan Francisco January 2024 Market Report
San Francisco January 2024 Market ReportRonny Budiutama
 
San Francisco Market Report February 2021
San Francisco Market Report February 2021San Francisco Market Report February 2021
San Francisco Market Report February 2021Ronny Budiutama
 
San Francisco Market Report August 2021
San Francisco Market Report August 2021San Francisco Market Report August 2021
San Francisco Market Report August 2021Ronny Budiutama
 
San Francisco June 2023 Market Report.pdf
San Francisco June 2023 Market Report.pdfSan Francisco June 2023 Market Report.pdf
San Francisco June 2023 Market Report.pdfRonny Budiutama
 
San Francisco Market Report May 2021
San Francisco Market Report May 2021San Francisco Market Report May 2021
San Francisco Market Report May 2021Ronny Budiutama
 
October 2023 Report: San Francisco Real Estate Market Insights
October 2023 Report: San Francisco Real Estate Market InsightsOctober 2023 Report: San Francisco Real Estate Market Insights
October 2023 Report: San Francisco Real Estate Market InsightsRonny Budiutama
 

Ähnlich wie San Francisco Market Report April 2022.pdf (20)

San Francisco Market Report December 2021
San Francisco Market Report December 2021San Francisco Market Report December 2021
San Francisco Market Report December 2021
 
San Francisco Market Report December 2022.pdf
San Francisco Market Report December 2022.pdfSan Francisco Market Report December 2022.pdf
San Francisco Market Report December 2022.pdf
 
San Francisco Market Report October 2022.pdf
San Francisco Market Report October 2022.pdfSan Francisco Market Report October 2022.pdf
San Francisco Market Report October 2022.pdf
 
San Francisco Market Report November 2022.pdf
San Francisco Market Report November 2022.pdfSan Francisco Market Report November 2022.pdf
San Francisco Market Report November 2022.pdf
 
San Francisco Market Report February 2023
San Francisco Market Report February 2023San Francisco Market Report February 2023
San Francisco Market Report February 2023
 
San Francisco December 2023 Market Report
San Francisco December 2023 Market ReportSan Francisco December 2023 Market Report
San Francisco December 2023 Market Report
 
San Francisco Market Report October 2021
San Francisco Market Report October 2021San Francisco Market Report October 2021
San Francisco Market Report October 2021
 
San Francisco May 2023 Market Report.pdf
San Francisco May 2023 Market Report.pdfSan Francisco May 2023 Market Report.pdf
San Francisco May 2023 Market Report.pdf
 
San Francisco Market Report March 2023.pdf
San Francisco Market Report March 2023.pdfSan Francisco Market Report March 2023.pdf
San Francisco Market Report March 2023.pdf
 
San Francisco market focus report December 2019
San Francisco market focus report December 2019San Francisco market focus report December 2019
San Francisco market focus report December 2019
 
San Francisco Market Report January 2023.pdf
San Francisco Market Report January 2023.pdfSan Francisco Market Report January 2023.pdf
San Francisco Market Report January 2023.pdf
 
San Francisco Market Report June 2021
San Francisco Market Report June 2021San Francisco Market Report June 2021
San Francisco Market Report June 2021
 
San Francisco Market Report November 2021
San Francisco Market Report November 2021San Francisco Market Report November 2021
San Francisco Market Report November 2021
 
San Francisco Market Report September 2021
San Francisco Market Report September 2021San Francisco Market Report September 2021
San Francisco Market Report September 2021
 
San Francisco January 2024 Market Report
San Francisco January 2024 Market ReportSan Francisco January 2024 Market Report
San Francisco January 2024 Market Report
 
San Francisco Market Report February 2021
San Francisco Market Report February 2021San Francisco Market Report February 2021
San Francisco Market Report February 2021
 
San Francisco Market Report August 2021
San Francisco Market Report August 2021San Francisco Market Report August 2021
San Francisco Market Report August 2021
 
San Francisco June 2023 Market Report.pdf
San Francisco June 2023 Market Report.pdfSan Francisco June 2023 Market Report.pdf
San Francisco June 2023 Market Report.pdf
 
San Francisco Market Report May 2021
San Francisco Market Report May 2021San Francisco Market Report May 2021
San Francisco Market Report May 2021
 
October 2023 Report: San Francisco Real Estate Market Insights
October 2023 Report: San Francisco Real Estate Market InsightsOctober 2023 Report: San Francisco Real Estate Market Insights
October 2023 Report: San Francisco Real Estate Market Insights
 

Mehr von Ronny Budiutama

San Francisco November 2023 Market Report
San Francisco November 2023 Market ReportSan Francisco November 2023 Market Report
San Francisco November 2023 Market ReportRonny Budiutama
 
2023 Annual San Francisco Housing Market
2023 Annual San Francisco Housing Market2023 Annual San Francisco Housing Market
2023 Annual San Francisco Housing MarketRonny Budiutama
 
CA Weekly MLS Market Data Report - August 2023
CA Weekly MLS Market Data Report - August 2023CA Weekly MLS Market Data Report - August 2023
CA Weekly MLS Market Data Report - August 2023Ronny Budiutama
 
San Francisco Market Report July 2023.pdf
San Francisco Market Report July 2023.pdfSan Francisco Market Report July 2023.pdf
San Francisco Market Report July 2023.pdfRonny Budiutama
 
Annual Report on the San Francisco County Housing Market.pdf
Annual Report on the San Francisco County Housing Market.pdfAnnual Report on the San Francisco County Housing Market.pdf
Annual Report on the San Francisco County Housing Market.pdfRonny Budiutama
 
San Francisco Market Report For July 2021
San Francisco Market Report For July 2021San Francisco Market Report For July 2021
San Francisco Market Report For July 2021Ronny Budiutama
 

Mehr von Ronny Budiutama (6)

San Francisco November 2023 Market Report
San Francisco November 2023 Market ReportSan Francisco November 2023 Market Report
San Francisco November 2023 Market Report
 
2023 Annual San Francisco Housing Market
2023 Annual San Francisco Housing Market2023 Annual San Francisco Housing Market
2023 Annual San Francisco Housing Market
 
CA Weekly MLS Market Data Report - August 2023
CA Weekly MLS Market Data Report - August 2023CA Weekly MLS Market Data Report - August 2023
CA Weekly MLS Market Data Report - August 2023
 
San Francisco Market Report July 2023.pdf
San Francisco Market Report July 2023.pdfSan Francisco Market Report July 2023.pdf
San Francisco Market Report July 2023.pdf
 
Annual Report on the San Francisco County Housing Market.pdf
Annual Report on the San Francisco County Housing Market.pdfAnnual Report on the San Francisco County Housing Market.pdf
Annual Report on the San Francisco County Housing Market.pdf
 
San Francisco Market Report For July 2021
San Francisco Market Report For July 2021San Francisco Market Report For July 2021
San Francisco Market Report For July 2021
 

Kürzlich hochgeladen

Ganga Fusion 85 Gurugram - PDF Download.pdf
Ganga Fusion 85 Gurugram - PDF Download.pdfGanga Fusion 85 Gurugram - PDF Download.pdf
Ganga Fusion 85 Gurugram - PDF Download.pdfanjalisaini334541
 
Prestige Somerville Whitefield Bangalore E- Brochure.pdf
Prestige Somerville Whitefield Bangalore E- Brochure.pdfPrestige Somerville Whitefield Bangalore E- Brochure.pdf
Prestige Somerville Whitefield Bangalore E- Brochure.pdffaheemali990101
 
Prestige Sector 94 at Noida E Brochure.pdf
Prestige Sector 94 at Noida E Brochure.pdfPrestige Sector 94 at Noida E Brochure.pdf
Prestige Sector 94 at Noida E Brochure.pdfsarak0han45400
 
LCAR Unit 20 - Appraising Real Estate - 14th Edition Revised
LCAR Unit 20 - Appraising Real Estate - 14th Edition RevisedLCAR Unit 20 - Appraising Real Estate - 14th Edition Revised
LCAR Unit 20 - Appraising Real Estate - 14th Edition RevisedTom Blefko
 
Sobha Oakshire Devanhalli Bangalore.pdf.pdf
Sobha Oakshire Devanhalli Bangalore.pdf.pdfSobha Oakshire Devanhalli Bangalore.pdf.pdf
Sobha Oakshire Devanhalli Bangalore.pdf.pdfkratirudram
 
Kolte Patil Universe Hinjewadi Pune Brochure.pdf
Kolte Patil Universe Hinjewadi Pune Brochure.pdfKolte Patil Universe Hinjewadi Pune Brochure.pdf
Kolte Patil Universe Hinjewadi Pune Brochure.pdfPrachiRudram
 
Sankla East World Hadapsar Pune Brochure.pdf
Sankla East World Hadapsar Pune Brochure.pdfSankla East World Hadapsar Pune Brochure.pdf
Sankla East World Hadapsar Pune Brochure.pdfabbu831446
 
Pride Wonderland Dhanori Pune Brochure.pdf
Pride Wonderland Dhanori Pune Brochure.pdfPride Wonderland Dhanori Pune Brochure.pdf
Pride Wonderland Dhanori Pune Brochure.pdfabbu831446
 
LCAR RE Practice - The Pearson Vue State Exam
LCAR RE Practice - The Pearson Vue State ExamLCAR RE Practice - The Pearson Vue State Exam
LCAR RE Practice - The Pearson Vue State ExamTom Blefko
 
Shriram Hebbal One Kempapura Bangalore E- Brochure.pdf
Shriram Hebbal One Kempapura Bangalore E- Brochure.pdfShriram Hebbal One Kempapura Bangalore E- Brochure.pdf
Shriram Hebbal One Kempapura Bangalore E- Brochure.pdffaheemali990101
 
LCAR Unit 21 - Closing the Real Estate Transaction - 14th Edition Revised
LCAR Unit 21 - Closing the Real Estate Transaction - 14th Edition RevisedLCAR Unit 21 - Closing the Real Estate Transaction - 14th Edition Revised
LCAR Unit 21 - Closing the Real Estate Transaction - 14th Edition RevisedTom Blefko
 
Purva Park Hill Kanakapura Road Bangalore.pdf
Purva Park Hill  Kanakapura Road Bangalore.pdfPurva Park Hill  Kanakapura Road Bangalore.pdf
Purva Park Hill Kanakapura Road Bangalore.pdfashiyadav24
 
It’s Time to Fight Back Against the Media Narrative Regarding Real Estate Com...
It’s Time to Fight Back Against the Media Narrative Regarding Real Estate Com...It’s Time to Fight Back Against the Media Narrative Regarding Real Estate Com...
It’s Time to Fight Back Against the Media Narrative Regarding Real Estate Com...Tom Blefko
 
Honer Richmont Hyderabad E brochure - A Life With A View
Honer Richmont Hyderabad E brochure - A Life With A ViewHoner Richmont Hyderabad E brochure - A Life With A View
Honer Richmont Hyderabad E brochure - A Life With A ViewAhanundefined
 
Listing Turkey - Resim Modern Catalog Istanbul
Listing Turkey - Resim Modern Catalog IstanbulListing Turkey - Resim Modern Catalog Istanbul
Listing Turkey - Resim Modern Catalog IstanbulListing Turkey
 
Saheel ITREND Futura At Baner Annexe Pune - PDF.pdf
Saheel ITREND Futura At Baner Annexe Pune - PDF.pdfSaheel ITREND Futura At Baner Annexe Pune - PDF.pdf
Saheel ITREND Futura At Baner Annexe Pune - PDF.pdfmonikasharma630
 
Raymond Ten X Era Viviana Mall Thane Brochure.pdf
Raymond Ten X Era Viviana Mall Thane Brochure.pdfRaymond Ten X Era Viviana Mall Thane Brochure.pdf
Raymond Ten X Era Viviana Mall Thane Brochure.pdfPrachiRudram
 
Experion Elements Sector 45 Noida_Brochure.pdf.pdf
Experion Elements Sector 45 Noida_Brochure.pdf.pdfExperion Elements Sector 45 Noida_Brochure.pdf.pdf
Experion Elements Sector 45 Noida_Brochure.pdf.pdfkratirudram
 
Radiance Majestic Valasaravakkam Chennai.pdf
Radiance Majestic Valasaravakkam Chennai.pdfRadiance Majestic Valasaravakkam Chennai.pdf
Radiance Majestic Valasaravakkam Chennai.pdfashiyadav24
 
Shapoorji Pallonji Vanaha GolfLand 2 | A Space For You To Find Your Space
Shapoorji Pallonji Vanaha GolfLand 2 | A Space For You To Find Your SpaceShapoorji Pallonji Vanaha GolfLand 2 | A Space For You To Find Your Space
Shapoorji Pallonji Vanaha GolfLand 2 | A Space For You To Find Your Spaceaidasheikh47
 

Kürzlich hochgeladen (20)

Ganga Fusion 85 Gurugram - PDF Download.pdf
Ganga Fusion 85 Gurugram - PDF Download.pdfGanga Fusion 85 Gurugram - PDF Download.pdf
Ganga Fusion 85 Gurugram - PDF Download.pdf
 
Prestige Somerville Whitefield Bangalore E- Brochure.pdf
Prestige Somerville Whitefield Bangalore E- Brochure.pdfPrestige Somerville Whitefield Bangalore E- Brochure.pdf
Prestige Somerville Whitefield Bangalore E- Brochure.pdf
 
Prestige Sector 94 at Noida E Brochure.pdf
Prestige Sector 94 at Noida E Brochure.pdfPrestige Sector 94 at Noida E Brochure.pdf
Prestige Sector 94 at Noida E Brochure.pdf
 
LCAR Unit 20 - Appraising Real Estate - 14th Edition Revised
LCAR Unit 20 - Appraising Real Estate - 14th Edition RevisedLCAR Unit 20 - Appraising Real Estate - 14th Edition Revised
LCAR Unit 20 - Appraising Real Estate - 14th Edition Revised
 
Sobha Oakshire Devanhalli Bangalore.pdf.pdf
Sobha Oakshire Devanhalli Bangalore.pdf.pdfSobha Oakshire Devanhalli Bangalore.pdf.pdf
Sobha Oakshire Devanhalli Bangalore.pdf.pdf
 
Kolte Patil Universe Hinjewadi Pune Brochure.pdf
Kolte Patil Universe Hinjewadi Pune Brochure.pdfKolte Patil Universe Hinjewadi Pune Brochure.pdf
Kolte Patil Universe Hinjewadi Pune Brochure.pdf
 
Sankla East World Hadapsar Pune Brochure.pdf
Sankla East World Hadapsar Pune Brochure.pdfSankla East World Hadapsar Pune Brochure.pdf
Sankla East World Hadapsar Pune Brochure.pdf
 
Pride Wonderland Dhanori Pune Brochure.pdf
Pride Wonderland Dhanori Pune Brochure.pdfPride Wonderland Dhanori Pune Brochure.pdf
Pride Wonderland Dhanori Pune Brochure.pdf
 
LCAR RE Practice - The Pearson Vue State Exam
LCAR RE Practice - The Pearson Vue State ExamLCAR RE Practice - The Pearson Vue State Exam
LCAR RE Practice - The Pearson Vue State Exam
 
Shriram Hebbal One Kempapura Bangalore E- Brochure.pdf
Shriram Hebbal One Kempapura Bangalore E- Brochure.pdfShriram Hebbal One Kempapura Bangalore E- Brochure.pdf
Shriram Hebbal One Kempapura Bangalore E- Brochure.pdf
 
LCAR Unit 21 - Closing the Real Estate Transaction - 14th Edition Revised
LCAR Unit 21 - Closing the Real Estate Transaction - 14th Edition RevisedLCAR Unit 21 - Closing the Real Estate Transaction - 14th Edition Revised
LCAR Unit 21 - Closing the Real Estate Transaction - 14th Edition Revised
 
Purva Park Hill Kanakapura Road Bangalore.pdf
Purva Park Hill  Kanakapura Road Bangalore.pdfPurva Park Hill  Kanakapura Road Bangalore.pdf
Purva Park Hill Kanakapura Road Bangalore.pdf
 
It’s Time to Fight Back Against the Media Narrative Regarding Real Estate Com...
It’s Time to Fight Back Against the Media Narrative Regarding Real Estate Com...It’s Time to Fight Back Against the Media Narrative Regarding Real Estate Com...
It’s Time to Fight Back Against the Media Narrative Regarding Real Estate Com...
 
Honer Richmont Hyderabad E brochure - A Life With A View
Honer Richmont Hyderabad E brochure - A Life With A ViewHoner Richmont Hyderabad E brochure - A Life With A View
Honer Richmont Hyderabad E brochure - A Life With A View
 
Listing Turkey - Resim Modern Catalog Istanbul
Listing Turkey - Resim Modern Catalog IstanbulListing Turkey - Resim Modern Catalog Istanbul
Listing Turkey - Resim Modern Catalog Istanbul
 
Saheel ITREND Futura At Baner Annexe Pune - PDF.pdf
Saheel ITREND Futura At Baner Annexe Pune - PDF.pdfSaheel ITREND Futura At Baner Annexe Pune - PDF.pdf
Saheel ITREND Futura At Baner Annexe Pune - PDF.pdf
 
Raymond Ten X Era Viviana Mall Thane Brochure.pdf
Raymond Ten X Era Viviana Mall Thane Brochure.pdfRaymond Ten X Era Viviana Mall Thane Brochure.pdf
Raymond Ten X Era Viviana Mall Thane Brochure.pdf
 
Experion Elements Sector 45 Noida_Brochure.pdf.pdf
Experion Elements Sector 45 Noida_Brochure.pdf.pdfExperion Elements Sector 45 Noida_Brochure.pdf.pdf
Experion Elements Sector 45 Noida_Brochure.pdf.pdf
 
Radiance Majestic Valasaravakkam Chennai.pdf
Radiance Majestic Valasaravakkam Chennai.pdfRadiance Majestic Valasaravakkam Chennai.pdf
Radiance Majestic Valasaravakkam Chennai.pdf
 
Shapoorji Pallonji Vanaha GolfLand 2 | A Space For You To Find Your Space
Shapoorji Pallonji Vanaha GolfLand 2 | A Space For You To Find Your SpaceShapoorji Pallonji Vanaha GolfLand 2 | A Space For You To Find Your Space
Shapoorji Pallonji Vanaha GolfLand 2 | A Space For You To Find Your Space
 

San Francisco Market Report April 2022.pdf

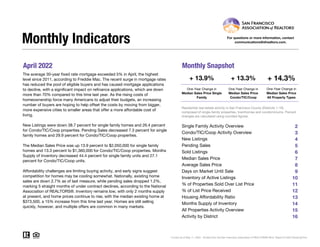
  • 1. April 2022 Monthly Snapshot One-Year Change in One-Year Change in Median Sales Price Single Family Median Sales Price Condo/TIC/Coop 2 3 4 5 6 7 8 9 10 11 12 13 14 15 16 Monthly Indicators + 13.9% + 13.3% + 14.3% One-Year Change in The average 30-year fixed rate mortgage exceeded 5% in April, the highest level since 2011, according to Freddie Mac. The recent surge in mortgage rates has reduced the pool of eligible buyers and has caused mortgage applications to decline, with a significant impact on refinance applications, which are down more than 70% compared to this time last year. As the rising costs of homeownership force many Americans to adjust their budgets, an increasing number of buyers are hoping to help offset the costs by moving from bigger, more expensive cities to smaller areas that offer a more affordable cost of living. New Listings were down 38.7 percent for single family homes and 26.4 percent for Condo/TIC/Coop properties. Pending Sales decreased 7.3 percent for single family homes and 29.9 percent for Condo/TIC/Coop properties. The Median Sales Price was up 13.9 percent to $2,050,000 for single family homes and 13.3 percent to $1,360,000 for Condo/TIC/Coop properties. Months Supply of Inventory decreased 44.4 percent for single family units and 27.1 percent for Condo/TIC/Coop units. Affordability challenges are limiting buying activity, and early signs suggest competition for homes may be cooling somewhat. Nationally, existing home sales are down 2.7% as of last measure, while pending sales dropped 1.2%, marking 5 straight months of under contract declines, according to the National Association of REALTORS®. Inventory remains low, with only 2 months supply at present, and home prices continue to rise, with the median existing home at $373,500, a 15% increase from this time last year. Homes are still selling quickly, however, and multiple offers are common in many markets. Median Sales Price All Property Types Residential real estate activity in San Francisco County (Districts 1-10) composed of single-family properties, townhomes and condominiums. Percent changes are calculated using rounded figures. Single Family Activity Overview Months Supply of Inventory For questions or more information, contact communications@sfrealtors.com. Current as of May 11, 2022. All data from the San Francisco Association of REALTORS® MLS. Report © 2022 ShowingTime. Condo/TIC/Coop Activity Overview Inventory of Active Listings % of Properties Sold Over List Price % of List Price Received Housing Affordability Ratio All Properties Activity Overview New Listings Pending Sales Sold Listings Median Sales Price Average Sales Price Days on Market Until Sale Activity by District
  • 2. Single Family Activity Overview Key metrics by report month and for year-to-date (YTD) starting from the first of the year. Key Metrics Historical Sparkbars 4-2021 4-2022 Percent Change YTD 2021 YTD 2022 Percent Change Current as of May 11, 2022. All data from the San Francisco Association of REALTORS® MLS. Report © 2022 ShowingTime. | 2 Months Supply 2.7 1.5 - 44.4% -- -- -- Affordability Ratio 31 21 - 32.3% % of List Price Received 113.8% 123.2% + 8.3% 111.0% 33 85.6% + 21.1% + 9.5% 23 - 30.3% 121.5% % of Properties Sold Over List Price 76.1% 89.1% + 17.1% 70.7% Active Listings 673 372 - 44.7% -- Avg. Sales Price $2,430,795 $2,516,916 + 3.5% $2,244,311 Days on Market 19 15 - 21.1% 25 19 - 24.0% $2,419,123 -- -- Median Sales Price $1,800,000 $2,050,000 + 13.9% $1,705,000 Sold Listings 289 256 - 11.4% 883 New Listings 354 217 - 38.7% 1,265 Pending Sales 286 265 - 7.3% - 5.6% 971 917 - 16.0% 1,063 799 - 9.5% $1,925,000 + 12.9% + 7.8% 4-2019 4-2020 4-2021 4-2022 4-2019 4-2020 4-2021 4-2022 4-2019 4-2020 4-2021 4-2022 4-2019 4-2020 4-2021 4-2022 4-2019 4-2020 4-2021 4-2022 4-2019 4-2020 4-2021 4-2022 4-2019 4-2020 4-2021 4-2022 4-2019 4-2020 4-2021 4-2022 4-2019 4-2020 4-2021 4-2022 4-2019 4-2020 4-2021 4-2022 4-2019 4-2020 4-2021 4-2022
  • 3. Condo/TIC/Coop Activity Overview Key metrics by report month and for year-to-date (YTD) starting from the first of the year. Key Metrics Historical Sparkbars 4-2021 4-2022 Percent Change YTD 2021 YTD 2022 Percent Change Current as of May 11, 2022. All data from the San Francisco Association of REALTORS® MLS. Report © 2022 ShowingTime. | 3 Months Supply 4.8 3.5 - 27.1% -- -- -- Affordability Ratio 55 37 - 32.7% % of List Price Received 103.7% 107.3% + 3.5% 101.8% 55 56.6% + 48.2% + 3.9% 40 - 27.3% 105.8% % of Properties Sold Over List Price 45.0% 63.1% + 40.2% 38.2% Active Listings 1,523 1,220 - 19.9% -- Avg. Sales Price $1,347,315 $1,461,478 + 8.5% $1,328,618 Days on Market 45 29 - 35.6% 53 $1,250,000 + 5.0% + 6.1% 36 - 32.1% $1,409,856 -- -- Sold Listings 462 369 - 20.1% 1,467 1,197 - 18.4% Median Sales Price $1,200,000 $1,360,000 + 13.3% $1,190,000 - 11.3% Pending Sales 479 336 - 29.9% 1,626 1,309 - 19.5% New Listings 515 379 - 26.4% 2,171 1,926 4-2019 4-2020 4-2021 4-2022 4-2019 4-2020 4-2021 4-2022 4-2019 4-2020 4-2021 4-2022 4-2019 4-2020 4-2021 4-2022 4-2019 4-2020 4-2021 4-2022 4-2019 4-2020 4-2021 4-2022 4-2019 4-2020 4-2021 4-2022 4-2019 4-2020 4-2021 4-2022 4-2019 4-2020 4-2021 4-2022 4-2019 4-2020 4-2021 4-2022 4-2019 4-2020 4-2021 4-2022
  • 4. New Listings New Listings Single Family Year-Over-Year Change Condo/TIC/ Coop Year-Over-Year Change May-2021 314 +14.2% 527 +4.6% Jun-2021 324 -9.7% 494 -14.7% Jul-2021 304 -25.3% 428 -38.8% Aug-2021 302 -14.7% 438 -32.8% Sep-2021 376 +5.9% 586 -12.0% Oct-2021 273 -26.6% 460 -11.9% Nov-2021 164 -32.2% 277 +8.6% Dec-2021 105 -28.6% 216 -12.9% Jan-2022 259 +0.4% 504 -5.6% Feb-2022 280 -8.5% 514 +2.4% Mar-2022 307 -11.5% 529 -14.7% Apr-2022 217 -38.7% 379 -26.4% 12-Month Avg 269 -14.6% 446 -15.0% Historical New Listings by Month Current as of May 11, 2022. All data from the San Francisco Association of REALTORS® MLS. Report © 2022 ShowingTime. | 4 A count of the properties that have been newly listed on the market in a given month. 176 230 354 515 217 379 Single Family Condo/TIC/Coop April 0 200 400 600 800 1-2005 1-2006 1-2007 1-2008 1-2009 1-2010 1-2011 1-2012 1-2013 1-2014 1-2015 1-2016 1-2017 1-2018 1-2019 1-2020 1-2021 1-2022 Single Family Condo/TIC/Coop 881 1,273 1,265 2,171 1,063 1,926 Single Family Condo/TIC/Coop Year to Date 2020 2021 2022 - 26.4% + 123.9% - 38.7% + 101.1% + 70.5% - 16.0% + 43.6% - 11.3% 2020 2021 2022 2020 2021 2022 2020 2021 2022 - 36.2% - 12.2% - 10.9% - 37.3%
  • 5. Pending Sales Pending Sales Single Family Year-Over-Year Change Condo/TIC/ Coop Year-Over-Year Change May-2021 307 +89.5% 461 +224.6% Jun-2021 275 +21.1% 388 +65.8% Jul-2021 259 -6.2% 364 +50.4% Aug-2021 226 -3.8% 316 -1.9% Sep-2021 331 +17.8% 336 +9.8% Oct-2021 273 -12.2% 403 +21.0% Nov-2021 260 -15.3% 362 +20.7% Dec-2021 129 -37.1% 226 -26.4% Jan-2022 145 -14.7% 251 -14.0% Feb-2022 216 -4.0% 293 -23.1% Mar-2022 291 +0.3% 429 -9.5% Apr-2022 265 -7.3% 336 -29.9% 12-Month Avg 248 +0.1% 347 +9.3% Historical Pending Sales by Month A count of the properties on which offers have been accepted in a given month. Current as of May 11, 2022. All data from the San Francisco Association of REALTORS® MLS. Report © 2022 ShowingTime. | 5 79 92 286 479 265 336 Single Family Condo/TIC/Coop April 0 100 200 300 400 500 1-2005 1-2006 1-2007 1-2008 1-2009 1-2010 1-2011 1-2012 1-2013 1-2014 1-2015 1-2016 1-2017 1-2018 1-2019 1-2020 1-2021 1-2022 Single Family Condo/TIC/Coop 517 664 971 1,626 917 1,309 Single Family Condo/TIC/Coop Year to Date 2020 2021 2022 - 29.9% + 420.7% - 7.3% + 262.0% - 5.6% + 87.8% +144.9% - 19.5% 2020 2021 2022 2020 2021 2022 2020 2021 2022 - 68.5% - 30.5% - 31.5% - 70.0%
  • 6. Sold Listings Sold Listings Single Family Year-Over-Year Change Condo/TIC/ Coop Year-Over-Year Change May-2021 266 +133.3% 443 +288.6% Jun-2021 325 +79.6% 471 +166.1% Jul-2021 255 +7.1% 369 +38.7% Aug-2021 256 +5.3% 348 +45.0% Sep-2021 245 -4.7% 291 -9.9% Oct-2021 310 +1.6% 362 +24.0% Nov-2021 292 +2.8% 423 +24.0% Dec-2021 216 -28.5% 325 -7.9% Jan-2022 129 -19.9% 186 -31.1% Feb-2022 159 -2.5% 250 -10.1% Mar-2022 255 -5.6% 392 -14.2% Apr-2022 256 -11.4% 369 -20.1% 12-Month Avg 247 +5.6% 352 +18.4% Historical Sold Listings by Month A count of the actual sales that closed in a given month. Current as of May 11, 2022. All data from the San Francisco Association of REALTORS® MLS. Report © 2022 ShowingTime. | 6 120 117 289 462 256 369 Single Family Condo/TIC/Coop April 0 100 200 300 400 500 1-2005 1-2006 1-2007 1-2008 1-2009 1-2010 1-2011 1-2012 1-2013 1-2014 1-2015 1-2016 1-2017 1-2018 1-2019 1-2020 1-2021 1-2022 Single Family Condo/TIC/Coop 539 682 883 1,467 799 1,197 Single Family Condo/TIC/Coop Year to Date 2020 2021 2022 - 20.1% + 294.9% - 11.4% + 140.8% - 9.5% + 63.8% +115.1% - 18.4% 2020 2021 2022 2020 2021 2022 2020 2021 2022 - 51.8% - 20.3% - 22.4% - 64.0%
  • 7. Median Sales Price Median Sales Price Single Family Year-Over-Year Change Condo/TIC/ Coop Year-Over-Year Change May-2021 $1,886,500 +18.8% $1,227,000 +12.8% Jun-2021 $1,950,000 +12.7% $1,250,000 +2.0% Jul-2021 $1,850,000 +15.3% $1,210,000 -4.0% Aug-2021 $1,847,500 +13.7% $1,150,000 -5.0% Sep-2021 $1,750,000 +6.1% $1,200,000 +2.1% Oct-2021 $1,805,000 +12.5% $1,242,500 +7.8% Nov-2021 $1,884,444 +15.1% $1,260,000 +7.5% Dec-2021 $1,690,000 +9.0% $1,300,000 +18.2% Jan-2022 $1,630,000 +3.5% $1,070,000 -0.2% Feb-2022 $1,930,000 +17.0% $1,227,500 +2.6% Mar-2022 $2,060,000 +19.4% $1,209,250 -1.0% Apr-2022 $2,050,000 +13.9% $1,360,000 +13.3% 12-Month Avg* $1,855,000 +12.4% $1,240,000 +5.1% Historical Median Sales Price by Month Point at which half of the sales sold for more and half sold for less, not accounting for seller concessions, in a given month. * Median Sales Price for all properties from May 2021 through April 2022. This is not the average of the individual figures above. Current as of May 11, 2022. All data from the San Francisco Association of REALTORS® MLS. Report © 2022 ShowingTime. | 7 $1,605,000 $1,275,000 $1,800,000 $1,200,000 $2,050,000 $1,360,000 Single Family Condo/TIC/Coop April $500,000 $750,000 $1,000,000 $1,250,000 $1,500,000 $1,750,000 $2,000,000 $2,250,000 1-2005 1-2006 1-2007 1-2008 1-2009 1-2010 1-2011 1-2012 1-2013 1-2014 1-2015 1-2016 1-2017 1-2018 1-2019 1-2020 1-2021 1-2022 Single Family Condo/TIC/Coop $1,570,000 $1,220,000 $1,705,000 $1,190,000 $1,925,000 $1,250,000 Single Family Condo/TIC/Coop Year to Date 2020 2021 2022 + 13.3% - 5.9% + 13.9% + 12.1% - 2.5% + 12.9% + 8.6% + 5.0% 2020 2021 2022 2020 2021 2022 2020 2021 2022 + 0.3% + 1.9% + 3.8% + 4.1%
  • 8. Average Sales Price Average Sales Price Single Family Year-Over-Year Change Condo/TIC/ Coop Year-Over-Year Change May-2021 $2,479,992 +32.1% $1,379,360 +10.2% Jun-2021 $2,504,876 +13.8% $1,388,929 -1.9% Jul-2021 $2,292,230 +13.8% $1,357,053 -2.9% Aug-2021 $2,128,296 +7.1% $1,425,053 +7.4% Sep-2021 $2,165,489 +14.2% $1,330,272 +1.9% Oct-2021 $2,359,157 +23.7% $1,456,361 +16.3% Nov-2021 $2,359,312 +15.9% $1,539,719 +21.1% Dec-2021 $2,365,749 +17.5% $1,488,734 +16.1% Jan-2022 $1,977,367 +1.6% $1,311,263 +8.3% Feb-2022 $2,417,245 +7.1% $1,398,389 +4.0% Mar-2022 $2,545,596 +14.9% $1,415,356 +3.4% Apr-2022 $2,516,916 +3.5% $1,461,478 +8.5% 12-Month Avg* $2,360,934 +14.0% $1,418,530 +7.7% Historical Average Sales Price by Month Average sales price for all closed sales, not accounting for seller concessions, in a given month. * Avg. Sales Price for all properties from May 2021 through April 2022. This is not the average of the individual figures above. Current as of May 11, 2022. All data from the San Francisco Association of REALTORS® MLS. Report © 2022 ShowingTime. | 8 $2,183,677 $1,347,363 $2,430,795 $1,347,315 $2,516,916 $1,461,478 Single Family Condo/TIC/Coop April $500,000 $1,000,000 $1,500,000 $2,000,000 $2,500,000 $3,000,000 1-2005 1-2006 1-2007 1-2008 1-2009 1-2010 1-2011 1-2012 1-2013 1-2014 1-2015 1-2016 1-2017 1-2018 1-2019 1-2020 1-2021 1-2022 Single Family Condo/TIC/Coop $2,053,979 $1,337,510 $2,244,311 $1,328,618 $2,419,123 $1,409,856 Single Family Condo/TIC/Coop Year to Date 2020 2021 2022 + 8.5% - 0.0% + 3.5% + 11.3% - 0.7% + 7.8% + 9.3% + 6.1% 2020 2021 2022 2020 2021 2022 2020 2021 2022 + 0.1% + 4.0% + 1.5% - 0.2%
  • 9. Days on Market Until Sale Days on Market Until Sale Single Family Year-Over-Year Change Condo/TIC/ Coop Year-Over-Year Change May-2021 18 -25.0% 36 -10.0% Jun-2021 17 -34.6% 35 +2.9% Jul-2021 18 -28.0% 40 +5.3% Aug-2021 24 0.0% 40 0.0% Sep-2021 22 -12.0% 37 -17.8% Oct-2021 19 -29.6% 34 -17.1% Nov-2021 20 -39.4% 40 -20.0% Dec-2021 30 -14.3% 45 -27.4% Jan-2022 37 +2.8% 62 -11.4% Feb-2022 19 -36.7% 33 -46.8% Mar-2022 15 -34.8% 32 -28.9% Apr-2022 15 -21.1% 29 -35.6% 12-Month Avg* 20 -25.0% 38 -22.1% Historical Days on Market Until Sale by Month Average number of days between when a property is listed and when an offer is accepted in a given month. * Days on Market for all properties from May 2021 through April 2022. This is not the average of the individual figures above. Current as of May 11, 2022. All data from the San Francisco Association of REALTORS® MLS. Report © 2022 ShowingTime. | 9 20 32 19 45 15 29 Single Family Condo/TIC/Coop April 0 20 40 60 80 100 120 1-2005 1-2006 1-2007 1-2008 1-2009 1-2010 1-2011 1-2012 1-2013 1-2014 1-2015 1-2016 1-2017 1-2018 1-2019 1-2020 1-2021 1-2022 Single Family Condo/TIC/Coop 25 36 25 53 19 36 Single Family Condo/TIC/Coop Year to Date 2020 2021 2022 - 35.6% + 40.6% - 21.1% - 5.0% + 47.2% - 24.0% 0.0% - 32.1% 2020 2021 2022 2020 2021 2022 2020 2021 2022 - 25.9% - 13.8% - 10.0% - 15.8%
  • 10. Inventory of Active Listings Inventory of Active Listings Single Family Year-Over-Year Change Condo/TIC/ Coop Year-Over-Year Change May-2021 643 -6.5% 1,501 +11.8% Jun-2021 641 -18.1% 1,484 -5.3% Jul-2021 649 -24.5% 1,456 -24.6% Aug-2021 682 -26.2% 1,470 -30.3% Sep-2021 679 -26.8% 1,613 -30.5% Oct-2021 635 -31.4% 1,549 -34.2% Nov-2021 505 -36.2% 1,350 -35.5% Dec-2021 368 -37.1% 1,004 -33.3% Jan-2022 458 -23.0% 1,193 -25.6% Feb-2022 492 -21.8% 1,334 -16.3% Mar-2022 470 -26.2% 1,316 -17.0% Apr-2022 372 -44.7% 1,220 -19.9% 12-Month Avg* 550 -26.9% 1,374 -23.4% Historical Inventory of Active Listings by Month The number of properties available for sale in active status at the end of a given month. * Active Listings for all properties from May 2021 through April 2022. This is not the average of the individual figures above. Current as of May 11, 2022. All data from the San Francisco Association of REALTORS® MLS. Report © 2022 ShowingTime. | 10 608 1,071 673 1,523 372 1,220 Single Family Condo/TIC/Coop April 0 500 1,000 1,500 2,000 2,500 1-2005 1-2006 1-2007 1-2008 1-2009 1-2010 1-2011 1-2012 1-2013 1-2014 1-2015 1-2016 1-2017 1-2018 1-2019 1-2020 1-2021 1-2022 Single Family Condo/TIC/Coop 2020 2021 2022 - 19.9% + 42.2% - 44.7% + 10.7% 2020 2021 2022 + 18.8% + 27.8%
  • 11. % of Properties Sold Over List Price % of Properties Sold Over List Price Single Family Year-Over-Year Change Condo/TIC/ Coop Year-Over-Year Change May-2021 79.7% +26.1% 53.5% +27.1% Jun-2021 82.5% +49.5% 54.4% +74.9% Jul-2021 83.5% +29.1% 55.6% +25.2% Aug-2021 84.4% +28.3% 54.6% +59.6% Sep-2021 84.5% +30.0% 54.6% +58.7% Oct-2021 84.5% +25.2% 61.0% +42.5% Nov-2021 79.8% +29.5% 55.6% +69.5% Dec-2021 78.7% +25.1% 46.5% +62.6% Jan-2022 76.0% +31.5% 38.7% +76.7% Feb-2022 86.8% +27.5% 58.4% +65.4% Mar-2022 86.3% +16.5% 57.9% +35.0% Apr-2022 89.1% +17.1% 63.1% +40.2% 12-Month Avg 83.2% +26.3% 55.1% +50.1% Historical % of Properties Sold Over List Price by Month Percentage found when dividing the number of properties sold by properties sold over its original list price, not accounting for seller concessions. * % of Properties Sold Over List Price for all properties from May 2021 through April 2022. This is not the average of the individual figures above. Current as of May 11, 2022. All data from the San Francisco Association of REALTORS® MLS. Report © 2022 ShowingTime. | 11 70.0% 59.8% 76.1% 45.0% 89.1% 63.1% Single Family Condo/TIC/Coop April 0.0% 20.0% 40.0% 60.0% 80.0% 100.0% 1-2005 1-2006 1-2007 1-2008 1-2009 1-2010 1-2011 1-2012 1-2013 1-2014 1-2015 1-2016 1-2017 1-2018 1-2019 1-2020 1-2021 1-2022 Single Family Condo/TIC/Coop 72.1% 54.8% 70.7% 38.2% 85.6% 56.6% Single Family Condo/TIC/Coop Year to Date 2020 2021 2022 + 40.2% - 24.7% + 17.1% + 8.7% - 30.3% + 21.1% - 1.9% + 48.2% 2020 2021 2022 2020 2021 2022 2020 2021 2022 - 4.2% + 0.7% + 4.2% + 7.4%
  • 12. % of List Price Received % of List Price Received Single Family Year-Over-Year Change Condo/TIC/ Coop Year-Over-Year Change May-2021 116.8% +10.4% 105.2% +4.8% Jun-2021 116.3% +10.1% 105.3% +5.4% Jul-2021 118.5% +11.8% 104.8% +3.8% Aug-2021 116.1% +8.0% 104.3% +3.9% Sep-2021 116.3% +8.9% 105.0% +4.8% Oct-2021 117.0% +8.2% 105.6% +4.2% Nov-2021 115.0% +8.5% 104.6% +4.4% Dec-2021 114.3% +7.8% 103.5% +4.2% Jan-2022 117.7% +11.8% 101.1% +2.4% Feb-2022 121.2% +10.5% 106.1% +5.4% Mar-2022 122.1% +8.8% 106.4% +3.9% Apr-2022 123.2% +8.3% 107.3% +3.5% 12-Month Avg* 117.7% +9.0% 105.1% +4.1% Historical % of List Price Received by Month Percentage found when dividing a property’s sales price by its most recent list price, then taking the average for all properties sold in a given month, not accounting for seller concessions. * % of List Price Received for all properties from May 2021 through April 2022. This is not the average of the individual figures above. Current as of May 11, 2022. All data from the San Francisco Association of REALTORS® MLS. Report © 2022 ShowingTime. | 12 108.8% 105.3% 113.8% 103.7% 123.2% 107.3% Single Family Condo/TIC/Coop April 110.9% 103.8% 111.0% 101.8% 121.5% 105.8% Single Family Condo/TIC/Coop Year to Date 90.0% 100.0% 110.0% 120.0% 130.0% 1-2005 1-2006 1-2007 1-2008 1-2009 1-2010 1-2011 1-2012 1-2013 1-2014 1-2015 1-2016 1-2017 1-2018 1-2019 1-2020 1-2021 1-2022 Single Family Condo/TIC/Coop 2020 2021 2022 + 3.5% - 1.5% + 8.3% + 4.6% 2020 2021 2022 - 2.5% + 0.4% 2020 2021 2022 + 3.9% - 1.9% + 9.5% + 0.1% 2020 2021 2022 + 0.3% - 0.2%
  • 13. Housing Affordability Ratio Housing Affordability Ratio Single Family Year-Over-Year Change Condo/TIC/ Coop Year-Over-Year Change May-2021 30 -14.3% 54 -8.5% Jun-2021 28 -12.5% 52 -3.7% Jul-2021 30 -14.3% 54 +1.9% Aug-2021 30 -14.3% 57 +1.8% Sep-2021 32 -8.6% 55 -3.5% Oct-2021 31 -13.9% 53 -10.2% Nov-2021 30 -14.3% 54 -8.5% Dec-2021 32 -13.5% 49 -21.0% Jan-2022 32 -11.1% 57 -9.5% Feb-2022 27 -18.2% 49 -7.5% Mar-2022 23 -28.1% 45 -13.5% Apr-2022 21 -32.3% 37 -32.7% 12-Month Avg* 29 -38.8% 51 -35.0% Historical Housing Affordability Ratio by Month This index measures housing affordability for the region. For example, an index of 120 means the median household income is 120% of what is necessary to qualify for the median-priced home under prevailing interest rates. A higher number means greater affordability. * Affordability Ratio for all properties from May 2021 through April 2022. This is not the average of the individual figures above. Current as of May 11, 2022. All data from the San Francisco Association of REALTORS® MLS. Report © 2022 ShowingTime. | 13 34 51 31 55 21 37 Single Family Condo/TIC/Coop April 20 40 60 80 100 1-2005 1-2006 1-2007 1-2008 1-2009 1-2010 1-2011 1-2012 1-2013 1-2014 1-2015 1-2016 1-2017 1-2018 1-2019 1-2020 1-2021 1-2022 Single Family Condo/TIC/Coop 2020 2021 2022 - 32.7% + 7.8% - 32.3% - 8.8% 2020 2021 2022 + 9.7% + 6.3% 35 53 33 55 23 40 Single Family Condo/TIC/Coop Year to Date 2020 2021 2022 - 27.3% + 3.8% - 30.3% - 5.7% 2020 2021 2022 + 6.1% + 6.0%
  • 14. Months Supply of Inventory Months Supply of Inventory Single Family Year-Over-Year Change Condo/TIC/ Coop Year-Over-Year Change May-2021 2.5 -35.9% 4.4 -34.3% Jun-2021 2.4 -45.5% 4.2 -46.2% Jul-2021 2.5 -46.8% 4.0 -58.3% Aug-2021 2.6 -46.9% 4.0 -60.0% Sep-2021 2.6 -45.8% 4.4 -58.5% Oct-2021 2.4 -48.9% 4.1 -61.7% Nov-2021 2.0 -48.7% 3.6 -61.3% Dec-2021 1.5 -46.4% 2.7 -57.1% Jan-2022 1.8 -35.7% 3.2 -50.8% Feb-2022 2.0 -28.6% 3.7 -39.3% Mar-2022 1.9 -32.1% 3.7 -33.9% Apr-2022 1.5 -44.4% 3.5 -27.1% 12-Month Avg* 2.1 -43.6% 3.8 -51.8% Historical Months Supply of Inventory by Month The inventory of homes for sale at the end of a given month, divided by the average monthly pending sales from the last 12 months. * Months Supply for all properties from May 2021 through April 2022. This is not the average of the individual figures above. Current as of May 11, 2022. All data from the San Francisco Association of REALTORS® MLS. Report © 2022 ShowingTime. | 14 3.3 4.9 2.7 4.8 1.5 3.5 Single Family Condo/TIC/Coop April 0.0 2.0 4.0 6.0 8.0 10.0 12.0 1-2005 1-2006 1-2007 1-2008 1-2009 1-2010 1-2011 1-2012 1-2013 1-2014 1-2015 1-2016 1-2017 1-2018 1-2019 1-2020 1-2021 1-2022 Single Family Condo/TIC/Coop 2020 2021 2022 - 27.1% - 2.0% - 44.4% - 18.2% 2020 2021 2022 + 32.0% + 44.1%
  • 15. All Properties Activity Overview Key metrics by report month and for year-to-date (YTD) starting from the first of the year. Key Metrics Historical Sparkbars 4-2021 4-2022 Percent Change YTD 2021 YTD 2022 Percent Change Current as of May 11, 2022. All data from the San Francisco Association of REALTORS® MLS. Report © 2022 ShowingTime. | 15 Months Supply 3.9 2.7 - 30.8% -- -- -- Affordability Ratio 38 27 - 28.9% % of List Price Received 107.6% 113.8% + 5.8% 105.2% 40 68.2% + 35.3% + 6.5% 28 - 30.0% 112.0% % of Properties Sold Over List Price 57.1% 73.9% + 29.4% 50.4% Active Listings 2,235 1,624 - 27.3% -- Avg. Sales Price $1,763,711 $1,885,960 + 6.9% $1,675,768 Days on Market 34 24 - 29.4% 43 $1,500,000 + 11.1% + 8.0% 30 - 30.2% $1,810,347 -- -- Sold Listings 760 631 - 17.0% 2,381 2,016 - 15.3% Median Sales Price $1,400,000 $1,600,000 + 14.3% $1,350,000 - 13.2% Pending Sales 773 606 - 21.6% 2,625 2,246 - 14.4% New Listings 883 605 - 31.5% 3,481 3,020 4-2019 4-2020 4-2021 4-2022 4-2019 4-2020 4-2021 4-2022 4-2019 4-2020 4-2021 4-2022 4-2019 4-2020 4-2021 4-2022 4-2019 4-2020 4-2021 4-2022 4-2019 4-2020 4-2021 4-2022 4-2019 4-2020 4-2021 4-2022 4-2019 4-2020 4-2021 4-2022 4-2019 4-2020 4-2021 4-2022 4-2019 4-2020 4-2021 4-2022 4-2019 4-2020 4-2021 4-2022
  • 16. Activity by District SF District 1: Northwest (Sea Cliff, Lake, Jordan Park / Laurel Heights, Outer Richmond, Central Ric The SF District 2: Central West (Outer Sunset, Central Sunset, Inner Sunset, Outer Parkside, Parkside, Inner Parkside, Golden Gate Heights) SF District 3: Southwest (Pine Lake Park, Lake Shore, Merced Manor, Stonestown, Lakeside, Merced Heights, Ingleside, Ingleside Heights, Oceanview) SF District 4: Twin Peaks W (Forest Hill (& Ext), W Portal, St Francis Wd, Balboa Terr, Mt Dav Manor, Ingleside Terr, Monterey Hts, Wstwd Pk & H'lnds, Shrwd Fst, Miraloma Pk, Dmnd Hts, Mdtwn Terr) SF District 5: Central (Haight Ashbury, Cole Vly / Prnssus Hts, Clarndn Hts, Corona Hts, Twin Pks, Glen Pk, Noe Vly, Eureka Vly / Dolores Hts, Mission Dolores, Duboce Trngl, Buena Vista / Ashbury Hts) SF District 6: Central North (Lower Pacific Heights, Anza Vista, Western Addition, North Panhandle, Alamo Square, Hayes Valley) SF District 7: North (Marina, Cow Hollow, Presidio Heights, Pacific Heights) SF District 8: Northeast (North Waterfront, North Beach, Russian Hill, Telegraph Hill, Nob Hill, Financial District / Barbary Coast, Downtown, Van Ness / Civic Center, Tenderloin) SF District 9: Central East (Yerba Buena, South Beach, South of Market, Mission Bay, Inner Mission, Potrero Hill, Central Waterfront / Dogpatch, Bernal Heights) SF District 10: Southeast (Outer Mission, Mission Terr, Excelsior, Portola, Bayview, Silver Terr, Hunters Pt, Candlestick Pt, Bayview Hts, Little Hollywood, Visitation Vly, Crocker Amazon) 4-2021 4-2022 + / – 4-2021 4-2022 + / – 4-2021 4-2022 + / – 4-2021 4-2022 + / – 4-2021 4-2022 + / – Single Family 1 SF District 1 28 25 -10.7% 17 31 +82.4% $2,482,000 $3,000,000 +20.9% 20 12 -40.0% 1.4 1.1 -21.4% 2 SF District 2 75 55 -26.7% 57 43 -24.6% $1,688,000 $1,900,000 +12.6% 13 11 -15.4% 1.8 1.2 -33.3% 3 SF District 3 34 24 -29.4% 19 18 -5.3% $1,400,000 $1,770,000 +26.4% 15 11 -26.7% 2.1 1.5 -28.6% 4 SF District 4 72 36 -50.0% 39 26 -33.3% $2,040,000 $2,168,863 +6.3% 12 13 +8.3% 2.0 1.1 -45.0% 5 SF District 5 133 62 -53.4% 48 39 -18.8% $2,517,500 $2,850,000 +13.2% 24 18 -25.0% 3.5 1.7 -51.4% 6 SF District 6 20 7 -65.0% 6 4 -33.3% $3,190,000 $3,575,000 +12.1% 19 11 -42.1% 3.6 1.4 -61.1% 7 SF District 7 66 33 -50.0% 19 11 -42.1% $5,900,000 $4,100,000 -30.5% 33 22 -33.3% 6.2 2.8 -54.8% 8 SF District 8 22 20 -9.1% 2 6 +200.0% $2,600,000 $3,125,001 +20.2% 99 27 -72.7% 9.3 6.5 -30.1% 9 SF District 9 106 36 -66.0% 38 34 -10.5% $1,677,924 $1,920,000 +14.4% 21 19 -9.5% 3.5 1.3 -62.9% 10 SF District 10 117 74 -36.8% 44 44 0.0% $1,200,000 $1,350,000 +12.5% 16 14 -12.5% 2.5 1.6 -36.0% Condo/TIC/Coop 1 SF District 1 36 35 -2.8% 24 18 -25.0% $1,392,500 $1,497,500 +7.5% 28 20 -28.6% 1.9 2.0 +5.3% 2 SF District 2 15 11 -26.7% 9 4 -55.6% $1,100,000 $1,350,000 +22.7% 13 16 +23.1% 2.6 2.3 -11.5% 3 SF District 3 6 6 0.0% 7 3 -57.1% $1,350,000 $890,000 -34.1% 105 21 -80.0% 1.7 1.6 -5.9% 4 SF District 4 14 17 +21.4% 5 13 +160.0% $1,000,000 $800,000 -20.0% 24 33 +37.5% 2.6 3.0 +15.4% 5 SF District 5 142 125 -12.0% 64 64 0.0% $1,350,000 $1,587,000 +17.6% 29 17 -41.4% 2.7 2.3 -14.8% 6 SF District 6 120 102 -15.0% 44 47 +6.8% $1,189,500 $1,385,000 +16.4% 36 33 -8.3% 3.2 2.6 -18.8% 7 SF District 7 148 96 -35.1% 57 40 -29.8% $1,595,000 $1,875,000 +17.6% 37 16 -56.8% 4.0 2.6 -35.0% 8 SF District 8 287 251 -12.5% 75 56 -25.3% $1,175,000 $1,262,500 +7.4% 50 35 -30.0% 5.8 4.1 -29.3% 9 SF District 9 699 536 -23.3% 168 116 -31.0% $1,150,000 $1,210,000 +5.2% 54 36 -33.3% 6.8 4.5 -33.8% 10 SF District 10 56 41 -26.8% 9 8 -11.1% $700,000 $727,500 +3.9% 60 67 +11.7% 8.4 5.1 -39.3% Key metrics by report month for the districts of San Fransisco. Current as of May 11, 2022. All data from the San Francisco Association of REALTORS® MLS. Report © 2022 ShowingTime. | 16 Active Listings Sold Listings Median Sales Price Days on Market Months Supply