San Francisco Market Focus Report September 2018
•
1 like•79 views

San Francisco Market Focus Report September 2018

Recommended
Recommended
More Related Content
What's hot
What's hot (20)
Similar to San Francisco Market Focus Report September 2018
Similar to San Francisco Market Focus Report September 2018 (15)
More from Ronny Budiutama
More from Ronny Budiutama (20)
Recently uploaded
Recently uploaded (20)
San Francisco Market Focus Report September 2018
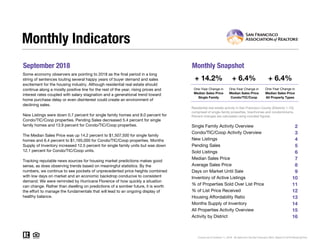
- 1. September 2018 Monthly Snapshot One-Year Change in One-Year Change in Median Sales Price Single Family Median Sales Price Condo/TIC/Coop 2 3 4 5 6 7 8 9 10 11 12 13 14 15 16 Monthly Indicators + 14.2% + 6.4% + 6.4% One-Year Change in Some economy observers are pointing to 2018 as the final period in a long string of sentences touting several happy years of buyer demand and sales excitement for the housing industry. Although residential real estate should continue along a mostly positive line for the rest of the year, rising prices and interest rates coupled with salary stagnation and a generational trend toward home purchase delay or even disinterest could create an environment of declining sales. New Listings were down 0.7 percent for single family homes and 8.0 percent for Condo/TIC/Coop properties. Pending Sales decreased 5.4 percent for single family homes and 13.9 percent for Condo/TIC/Coop properties. The Median Sales Price was up 14.2 percent to $1,507,500 for single family homes and 6.4 percent to $1,165,000 for Condo/TIC/Coop properties. Months Supply of Inventory increased 12.5 percent for single family units but was down 12.1 percent for Condo/TIC/Coop units. Tracking reputable news sources for housing market predictions makes good sense, as does observing trends based on meaningful statistics. By the numbers, we continue to see pockets of unprecedented price heights combined with low days on market and an economic backdrop conducive to consistent demand. We were reminded by Hurricane Florence of how quickly a situation can change. Rather than dwelling on predictions of a somber future, it is worth the effort to manage the fundamentals that will lead to an ongoing display of healthy balance. Median Sales Price All Property Types Residential real estate activity in San Francisco County (Districts 1-10), comprised of single-family properties, townhomes and condominiums. Percent changes are calculated using rounded figures. Single Family Activity Overview Months Supply of Inventory Current as of October 11, 2018. All data from the San Francisco MLS. Report © 2018 ShowingTime. Condo/TIC/Coop Activity Overview Inventory of Active Listings % of Properties Sold Over List Price % of List Price Received Housing Affordability Ratio All Properties Activity Overview New Listings Pending Sales Sold Listings Median Sales Price Average Sales Price Days on Market Until Sale Activity by District
- 2. Single Family Activity Overview Key metrics by report month and for year-to-date (YTD) starting from the first of the year. Key Metrics Historical Sparkbars 9-2017 9-2018 Percent Change YTD 2017 YTD 2018 Percent Change Current as of October 11, 2018. All data from the San Francisco MLS. Report © 2018 ShowingTime. | 2 Months Supply 2.4 2.7 + 12.5% -- -- -- Affordability Ratio 39 31 - 20.5% % of List Price Received 116.3% 115.7% - 0.5% 115.0% 38 81.7% + 4.2% + 2.1% 29 - 23.7% 117.4% % of Properties Sold Over List Price 85.9% 82.2% - 4.3% 78.4% Active Listings 446 496 + 11.2% -- Avg. Sales Price $1,611,232 $1,832,477 + 13.7% $1,737,142 Days on Market 28 23 - 17.9% 28 21 - 25.0% $1,966,920 -- -- Median Sales Price $1,320,000 $1,507,500 + 14.2% $1,375,000 Sold Listings 177 146 - 17.5% 1,640 New Listings 301 299 - 0.7% 2,139 Pending Sales 204 193 - 5.4% - 1.9%1,711 1,678 + 3.7%2,219 1,599 - 2.5% $1,608,000 + 16.9% + 13.2% 9-2015 9-2016 9-2017 9-2018 9-2015 9-2016 9-2017 9-2018 9-2015 9-2016 9-2017 9-2018 9-2015 9-2016 9-2017 9-2018 9-2015 9-2016 9-2017 9-2018 9-2015 9-2016 9-2017 9-2018 9-2015 9-2016 9-2017 9-2018 9-2015 9-2016 9-2017 9-2018 9-2015 9-2016 9-2017 9-2018 9-2015 9-2016 9-2017 9-2018 9-2015 9-2016 9-2017 9-2018
- 3. Condo/TIC/Coop Activity Overview Key metrics by report month and for year-to-date (YTD) starting from the first of the year. Key Metrics Historical Sparkbars 9-2017 9-2018 Percent Change YTD 2017 YTD 2018 Percent Change Current as of October 11, 2018. All data from the San Francisco MLS. Report © 2018 ShowingTime. | 3 Months Supply 3.3 2.9 - 12.1% -- -- -- Affordability Ratio 55 46 - 16.4% % of List Price Received 104.8% 106.6% + 1.7% 105.0% 54 61.5% + 5.1% + 1.7% 45 - 16.7% 106.8% % of Properties Sold Over List Price 53.1% 63.1% + 18.8% 58.5% Active Listings 773 747 - 3.4% -- Avg. Sales Price $1,217,558 $1,261,574 + 3.6% $1,288,913 Days on Market 42 30 - 28.6% 37 $1,200,000 + 6.7% + 2.9% 31 - 16.2% $1,325,875 -- -- Sold Listings 175 179 + 2.3% 2,055 2,252 + 9.6% Median Sales Price $1,095,000 $1,165,000 + 6.4% $1,125,000 + 4.9% Pending Sales 245 211 - 13.9% 2,144 2,312 + 7.8% New Listings 439 404 - 8.0% 2,975 3,121 9-2015 9-2016 9-2017 9-2018 9-2015 9-2016 9-2017 9-2018 9-2015 9-2016 9-2017 9-2018 9-2015 9-2016 9-2017 9-2018 9-2015 9-2016 9-2017 9-2018 9-2015 9-2016 9-2017 9-2018 9-2015 9-2016 9-2017 9-2018 9-2015 9-2016 9-2017 9-2018 9-2015 9-2016 9-2017 9-2018 9-2015 9-2016 9-2017 9-2018 9-2015 9-2016 9-2017 9-2018
- 4. New Listings New Listings Single Family Year-Over-Year Change Condo/TIC/ Coop Year-Over-Year Change Oct-2017 239 +7.7% 329 +9.7% Nov-2017 145 +5.1% 209 +31.4% Dec-2017 78 +11.4% 129 +7.5% Jan-2018 188 +5.6% 354 +7.6% Feb-2018 206 +10.2% 355 +7.6% Mar-2018 275 -0.7% 378 +8.0% Apr-2018 269 +8.9% 377 +32.3% May-2018 272 -5.2% 366 +1.4% Jun-2018 261 +9.7% 351 +12.1% Jul-2018 232 +10.0% 256 -6.6% Aug-2018 217 +1.9% 280 -4.8% Sep-2018 299 -0.7% 404 -8.0% 12-Month Avg 223 +4.4% 316 +6.6% Historical New Listings by Month Current as of October 11, 2018. All data from the San Francisco MLS. Report © 2018 ShowingTime. | 4 A count of the properties that have been newly listed on the market in a given month. 347 435 301 439 299 404 Single Family Condo/TIC/Coop September 0 100 200 300 400 500 600 700 1-2005 1-2006 1-2007 1-2008 1-2009 1-2010 1-2011 1-2012 1-2013 1-2014 1-2015 1-2016 1-2017 1-2018 Single Family Condo/TIC/Coop 2,242 3,161 2,139 2,975 2,219 3,121 Single Family Condo/TIC/Coop Year to Date 2016 2017 2018 - 8.0%+ 0.9%- 0.7%- 13.3% - 5.9%+ 3.7%- 4.6% + 4.9% 2016 2017 2018 2016 2017 2018 2016 2017 2018 + 6.8% - 1.1% + 8.4%- 0.7%
- 5. Pending Sales Pending Sales Single Family Year-Over-Year Change Condo/TIC/ Coop Year-Over-Year Change Oct-2017 248 +11.7% 330 +33.1% Nov-2017 198 -4.8% 234 -11.0% Dec-2017 108 -12.2% 192 +7.9% Jan-2018 87 -6.5% 180 +25.0% Feb-2018 158 +17.0% 224 +7.2% Mar-2018 216 +1.4% 336 +10.5% Apr-2018 207 +4.5% 287 +27.6% May-2018 275 +14.6% 298 -2.6% Jun-2018 203 -18.5% 301 +3.8% Jul-2018 165 -5.2% 244 +16.7% Aug-2018 174 -15.1% 231 +9.0% Sep-2018 193 -5.4% 211 -13.9% 12-Month Avg 186 -1.4% 256 +8.3% Historical Pending Sales by Month A count of the properties on which offers have been accepted in a given month. Current as of October 11, 2018. All data from the San Francisco MLS. Report © 2018 ShowingTime. | 5 186 216 204 245 193 211 Single Family Condo/TIC/Coop September 0 100 200 300 400 1-2005 1-2006 1-2007 1-2008 1-2009 1-2010 1-2011 1-2012 1-2013 1-2014 1-2015 1-2016 1-2017 1-2018 Single Family Condo/TIC/Coop 1,664 2,096 1,711 2,144 1,678 2,312 Single Family Condo/TIC/Coop Year to Date 2016 2017 2018 - 13.9%+ 13.4%- 5.4%+ 9.7% + 2.3%- 1.9%+ 2.8% + 7.8% 2016 2017 2018 2016 2017 2018 2016 2017 2018 - 6.5% - 4.8% - 5.2%+ 0.5%
- 6. Sold Listings Sold Listings Single Family Year-Over-Year Change Condo/TIC/ Coop Year-Over-Year Change Oct-2017 233 +2.6% 311 +31.8% Nov-2017 245 +18.9% 278 +5.7% Dec-2017 149 -25.5% 250 +5.0% Jan-2018 95 -10.4% 149 -0.7% Feb-2018 107 -3.6% 201 +28.0% Mar-2018 200 +15.6% 289 +0.7% Apr-2018 191 -5.9% 295 +27.2% May-2018 248 +13.8% 312 +14.7% Jun-2018 231 +0.4% 302 -6.8% Jul-2018 192 -8.6% 268 +12.1% Aug-2018 189 -10.8% 257 +17.4% Sep-2018 146 -17.5% 179 +2.3% 12-Month Avg 186 -2.1% 258 +10.7% Historical Sold Listings by Month A count of the actual sales that closed in a given month. Current as of October 11, 2018. All data from the San Francisco MLS. Report © 2018 ShowingTime. | 6 178 234 177 175 146 179 Single Family Condo/TIC/Coop September 0 100 200 300 400 1-2005 1-2006 1-2007 1-2008 1-2009 1-2010 1-2011 1-2012 1-2013 1-2014 1-2015 1-2016 1-2017 1-2018 Single Family Condo/TIC/Coop 1,590 2,058 1,640 2,055 1,599 2,252 Single Family Condo/TIC/Coop Year to Date 2016 2017 2018 + 2.3%- 25.2%- 17.5%- 0.6% - 0.1%- 2.5%+ 3.1% + 9.6% 2016 2017 2018 2016 2017 2018 2016 2017 2018 + 8.5% - 4.7% - 3.4%+ 29.3%
- 7. Median Sales Price Median Sales Price Single Family Year-Over-Year Change Condo/TIC/ Coop Year-Over-Year Change Oct-2017 $1,575,000 +12.5% $1,140,000 +0.2% Nov-2017 $1,495,000 +10.5% $1,237,500 +17.0% Dec-2017 $1,450,000 +11.4% $1,120,000 +10.8% Jan-2018 $1,330,000 +6.4% $1,100,000 +10.0% Feb-2018 $1,700,000 +31.8% $1,076,000 -9.2% Mar-2018 $1,687,500 +25.0% $1,250,000 +9.9% Apr-2018 $1,650,000 +19.6% $1,250,000 +13.6% May-2018 $1,616,944 +9.6% $1,257,500 +7.6% Jun-2018 $1,625,000 +11.2% $1,169,750 +4.0% Jul-2018 $1,626,250 +16.2% $1,158,333 +0.7% Aug-2018 $1,550,000 +12.5% $1,240,000 +5.5% Sep-2018 $1,507,500 +14.2% $1,165,000 +6.4% 12-Month Avg* $1,584,500 +15.9% $1,195,000 +8.1% Historical Median Sales Price by Month Point at which half of the sales sold for more and half sold for less, not accounting for seller concessions, in a given month. * Median Sales Price for all properties from October 2017 through September 2018. This is not the average of the individual figures above. Current as of October 11, 2018. All data from the San Francisco MLS. Report © 2018 ShowingTime. | 7 $1,216,875 $1,022,500 $1,320,000 $1,095,000 $1,507,500 $1,165,000 Single Family Condo/TIC/Coop September $400,000 $600,000 $800,000 $1,000,000 $1,200,000 $1,400,000 $1,600,000 $1,800,000 1-2005 1-2006 1-2007 1-2008 1-2009 1-2010 1-2011 1-2012 1-2013 1-2014 1-2015 1-2016 1-2017 1-2018 Single Family Condo/TIC/Coop $1,320,000 $1,090,830 $1,375,000 $1,125,000 $1,608,000 $1,200,000 Single Family Condo/TIC/Coop Year to Date 2016 2017 2018 + 6.4%+ 7.1%+ 14.2%+ 8.5% + 3.1%+ 16.9%+ 4.2% + 6.7% 2016 2017 2018 2016 2017 2018 2016 2017 2018 + 5.4% + 5.6% + 1.7%- 1.7%
- 8. Average Sales Price Avg. Sales Price Single Family Year-Over-Year Change Condo/TIC/ Coop Year-Over-Year Change Oct-2017 $2,007,445 +0.4% $1,275,773 +0.9% Nov-2017 $1,755,315 -0.7% $1,386,511 +21.6% Dec-2017 $1,908,433 +15.1% $1,263,727 +1.1% Jan-2018 $1,787,311 +9.4% $1,321,377 +13.7% Feb-2018 $2,107,409 +25.1% $1,263,105 -7.0% Mar-2018 $1,949,493 +3.1% $1,371,131 +6.9% Apr-2018 $2,202,113 +17.1% $1,335,718 +3.0% May-2018 $1,992,346 +8.5% $1,399,046 +3.9% Jun-2018 $1,943,346 +12.5% $1,335,648 -1.2% Jul-2018 $1,977,816 +13.7% $1,239,628 -0.3% Aug-2018 $1,846,660 +17.8% $1,349,794 +6.3% Sep-2018 $1,832,477 +13.7% $1,261,574 +3.6% 12-Month Avg* $1,943,957 +10.5% $1,321,261 +4.1% Historical Average Sales Price by Month Average sales price for all closed sales, not accounting for seller concessions, in a given month. * Avg. Sales Price for all properties from October 2017 through September 2018. This is not the average of the individual figures above. Current as of October 11, 2018. All data from the San Francisco MLS. Report © 2018 ShowingTime. | 8 $1,487,123 $1,208,334 $1,611,232 $1,217,558 $1,832,477 $1,261,574 Single Family Condo/TIC/Coop September $500,000 $750,000 $1,000,000 $1,250,000 $1,500,000 $1,750,000 $2,000,000 $2,250,000 1-2005 1-2006 1-2007 1-2008 1-2009 1-2010 1-2011 1-2012 1-2013 1-2014 1-2015 1-2016 1-2017 1-2018 Single Family Condo/TIC/Coop $1,661,963 $1,239,952 $1,737,142 $1,288,913 $1,966,920 $1,325,875 Single Family Condo/TIC/Coop Year to Date 2016 2017 2018 + 3.6%+ 0.8%+ 13.7%+ 8.3% + 3.9%+ 13.2%+ 4.5% + 2.9% 2016 2017 2018 2016 2017 2018 2016 2017 2018 + 6.9% + 1.2% - 0.5%+ 3.6%
- 9. Days on Market Until Sale Days on Market Single Family Year-Over-Year Change Condo/TIC/ Coop Year-Over-Year Change Oct-2017 23 -14.8% 31 -8.8% Nov-2017 26 -31.6% 35 -12.5% Dec-2017 28 -31.7% 45 -6.3% Jan-2018 33 -21.4% 55 -6.8% Feb-2018 22 -35.3% 37 +2.8% Mar-2018 22 -29.0% 26 -18.8% Apr-2018 18 -30.8% 26 -18.8% May-2018 20 -16.7% 27 -18.2% Jun-2018 18 -33.3% 27 -27.0% Jul-2018 21 -12.5% 31 -6.1% Aug-2018 22 -18.5% 36 -12.2% Sep-2018 23 -17.9% 30 -28.6% 12-Month Avg* 22 -25.1% 33 -14.3% Historical Days on Market Until Sale by Month Average number of days between when a property is listed and when an offer is accepted in a given month. * Days on Market for all properties from October 2017 through September 2018. This is not the average of the individual figures above. Current as of October 11, 2018. All data from the San Francisco MLS. Report © 2018 ShowingTime. | 9 41 40 28 42 23 30 Single Family Condo/TIC/Coop September 0 20 40 60 80 100 120 1-2005 1-2006 1-2007 1-2008 1-2009 1-2010 1-2011 1-2012 1-2013 1-2014 1-2015 1-2016 1-2017 1-2018 Single Family Condo/TIC/Coop 32 38 28 37 21 31 Single Family Condo/TIC/Coop Year to Date 2016 2017 2018 - 28.6%+ 5.0%- 17.9%- 31.7% - 2.6%- 25.0%- 12.5% - 16.2% 2016 2017 2018 2016 2017 2018 2016 2017 2018 + 51.9% + 18.5% + 26.7%+ 17.6%
- 10. Inventory of Active Listings Active Listings Single Family Year-Over-Year Change Condo/TIC/ Coop Year-Over-Year Change Oct-2017 412 -16.1% 708 -12.2% Nov-2017 334 -13.2% 612 +2.3% Dec-2017 229 -12.6% 424 +2.4% Jan-2018 321 -1.5% 572 +1.2% Feb-2018 353 -2.5% 659 +3.1% Mar-2018 395 -0.3% 654 +1.7% Apr-2018 431 +1.7% 702 +6.7% May-2018 404 -8.0% 716 +6.2% Jun-2018 425 +6.8% 695 +10.5% Jul-2018 448 +10.9% 633 +2.4% Aug-2018 441 +15.4% 615 -1.8% Sep-2018 496 +11.2% 747 -3.4% 12-Month Avg* 391 -0.6% 645 +1.2% Historical Inventory of Active Listings by Month The number of properties available for sale in active status at the end of a given month. * Active Listings for all properties from October 2017 through September 2018. This is not the average of the individual figures above. Current as of October 11, 2018. All data from the San Francisco MLS. Report © 2018 ShowingTime. | 10 531 830 446 773 496 747 Single Family Condo/TIC/Coop September 200 400 600 800 1,000 1,200 1,400 1,600 1-2005 1-2006 1-2007 1-2008 1-2009 1-2010 1-2011 1-2012 1-2013 1-2014 1-2015 1-2016 1-2017 1-2018 Single Family Condo/TIC/Coop 2016 2017 2018 - 3.4%- 6.9%+ 11.2%- 16.0% 2016 2017 2018 + 10.9% + 22.2%
- 11. % of Properties Sold Over List Price % of Properties Sold Over List Price Single Family Year-Over-Year Change Condo/TIC/ Coop Year-Over-Year Change Oct-2017 83.7% +6.1% 66.6% +23.8% Nov-2017 80.8% +11.0% 58.3% -7.6% Dec-2017 73.2% +6.1% 54.4% +28.3% Jan-2018 70.5% +13.2% 33.6% -13.2% Feb-2018 80.4% +2.6% 58.7% +2.4% Mar-2018 77.5% +3.9% 59.2% -4.5% Apr-2018 77.5% +0.3% 66.8% +7.6% May-2018 84.7% +7.4% 67.6% +10.8% Jun-2018 88.3% +10.4% 68.2% +16.4% Jul-2018 84.9% +4.3% 63.8% +1.6% Aug-2018 81.0% +2.8% 57.6% -5.1% Sep-2018 82.2% -4.3% 63.1% +18.8% 12-Month Avg 81.2% +5.4% 61.1% +7.0% Historical % of Properties Sold Over List Price by Month Percentage found when dividing the number of properties sold by properties sold over its original list price, not accounting for seller concessions. * % of Properties Sold Over List Price for all properties from October 2017 through September 2018. This is not the average of the individual figures above. Current as of October 11, 2018. All data from the San Francisco MLS. Report © 2018 ShowingTime. | 11 77.5% 58.1% 85.9% 53.1% 82.2% 63.1% Single Family Condo/TIC/Coop September 0.0% 20.0% 40.0% 60.0% 80.0% 100.0% 1-2005 1-2006 1-2007 1-2008 1-2009 1-2010 1-2011 1-2012 1-2013 1-2014 1-2015 1-2016 1-2017 1-2018 Single Family Condo/TIC/Coop 76.7% 60.0% 78.4% 58.5% 81.7% 61.5% Single Family Condo/TIC/Coop Year to Date 2016 2017 2018 + 18.8%- 8.6%- 4.3%+ 10.8% - 2.5%+ 4.2%+ 2.2% + 5.1% 2016 2017 2018 2016 2017 2018 2016 2017 2018 - 12.3% - 7.6% - 15.7%- 19.1%
- 12. % of List Price Received % of List Price Received Single Family Year-Over-Year Change Condo/TIC/ Coop Year-Over-Year Change Oct-2017 115.6% +4.0% 106.6% +2.3% Nov-2017 115.5% +5.9% 104.5% -0.1% Dec-2017 114.3% +5.4% 103.8% +2.3% Jan-2018 112.3% +4.4% 101.7% +0.3% Feb-2018 115.8% +1.8% 105.1% +1.2% Mar-2018 117.5% +4.5% 107.1% +2.1% Apr-2018 119.2% +3.3% 108.9% +3.6% May-2018 119.4% +3.6% 108.4% +2.8% Jun-2018 120.1% +2.8% 107.3% +1.4% Jul-2018 117.0% -0.1% 107.3% +1.2% Aug-2018 114.7% -0.7% 105.7% 0.0% Sep-2018 115.7% -0.5% 106.6% +1.7% 12-Month Avg* 116.8% +2.9% 106.3% +1.7% Historical % of List Price Received by Month Percentage found when dividing a property’s sales price by its most recent list price, then taking the average for all properties sold in a given month, not accounting for seller concessions. * % of List Price Received for all properties from October 2017 through September 2018. This is not the average of the individual figures above. Current as of October 11, 2018. All data from the San Francisco MLS. Report © 2018 ShowingTime. | 12 110.8% 104.1% 116.3% 104.8% 115.7% 106.6% Single Family Condo/TIC/Coop September 112.3% 105.0% 115.0% 105.0% 117.4% 106.8% Single Family Condo/TIC/Coop Year to Date 90.0% 100.0% 110.0% 120.0% 130.0% 1-2005 1-2006 1-2007 1-2008 1-2009 1-2010 1-2011 1-2012 1-2013 1-2014 1-2015 1-2016 1-2017 1-2018 Single Family Condo/TIC/Coop 2016 2017 2018 + 1.7%+ 0.7%- 0.5%+ 5.0% 2016 2017 2018 - 5.9% - 4.2% 2016 2017 2018 + 1.7%0.0%+ 2.1%+ 2.4% 2016 2017 2018 - 3.4% - 3.9%
- 13. Housing Affordability Ratio Affordability Ratio Single Family Year-Over-Year Change Condo/TIC/ Coop Year-Over-Year Change Oct-2017 32 -17.9% 52 -7.1% Nov-2017 35 -7.9% 49 -12.5% Dec-2017 35 -7.9% 53 -5.4% Jan-2018 37 -5.1% 52 -7.1% Feb-2018 29 -25.6% 53 +8.2% Mar-2018 29 -21.6% 46 -9.8% Apr-2018 29 -21.6% 45 -16.7% May-2018 30 -14.3% 44 -13.7% Jun-2018 30 -14.3% 48 -9.4% Jul-2018 30 -18.9% 49 -5.8% Aug-2018 31 -18.4% 45 -13.5% Sep-2018 31 -20.5% 46 -16.4% 12-Month Avg* 32 -17.5% 38 -14.1% Historical Housing Affordability Ratio by Month This index measures housing affordability for the region. For example, an index of 120 means the median household income is 120% of what is necessary to qualify for the median-priced home under prevailing interest rates. A higher number means greater affordability. * Affordability Ratio for all properties from October 2017 through September 2018. This is not the average of the individual figures above. Current as of October 11, 2018. All data from the San Francisco MLS. Report © 2018 ShowingTime. | 13 44 61 39 55 31 46 Single Family Condo/TIC/Coop September 20 40 60 80 100 1-2005 1-2006 1-2007 1-2008 1-2009 1-2010 1-2011 1-2012 1-2013 1-2014 1-2015 1-2016 1-2017 1-2018 Single Family Condo/TIC/Coop 2016 2017 2018 - 16.4%- 9.8%- 20.5%- 11.4% 2016 2017 2018 + 4.8% + 13.0% 40 57 38 54 29 45 Single Family Condo/TIC/Coop Year to Date 2016 2017 2018 - 16.7%- 5.3%- 23.7%- 5.0% 2016 2017 2018 + 2.6% + 7.5%
- 14. Months Supply of Inventory Months Supply Single Family Year-Over-Year Change Condo/TIC/ Coop Year-Over-Year Change Oct-2017 2.2 -18.5% 2.9 -17.1% Nov-2017 1.8 -14.3% 2.5 -3.8% Dec-2017 1.2 -14.3% 1.8 0.0% Jan-2018 1.7 -5.6% 2.3 -4.2% Feb-2018 1.9 -5.0% 2.7 -3.6% Mar-2018 2.1 0.0% 2.6 -3.7% Apr-2018 2.3 0.0% 2.8 0.0% May-2018 2.1 -12.5% 2.8 0.0% Jun-2018 2.2 +4.8% 2.7 +3.8% Jul-2018 2.4 +9.1% 2.5 -3.8% Aug-2018 2.4 +20.0% 2.4 -11.1% Sep-2018 2.7 +12.5% 2.9 -12.1% 12-Month Avg* 2.1 -2.7% 2.6 -5.1% Historical Months Supply of Inventory by Month The inventory of homes for sale at the end of a given month, divided by the average monthly pending sales from the last 12 months. * Months Supply for all properties from October 2017 through September 2018. This is not the average of the individual figures above. Current as of October 11, 2018. All data from the San Francisco MLS. Report © 2018 ShowingTime. | 14 2.8 3.6 2.4 3.3 2.7 2.9 Single Family Condo/TIC/Coop September 0.0 2.0 4.0 6.0 8.0 10.0 1-2005 1-2006 1-2007 1-2008 1-2009 1-2010 1-2011 1-2012 1-2013 1-2014 1-2015 1-2016 1-2017 1-2018 Single Family Condo/TIC/Coop 2016 2017 2018 - 12.1%- 8.3%+ 12.5%- 14.3% 2016 2017 2018 + 16.7% + 28.6%
- 15. All Properties Activity Overview Key metrics by report month and for year-to-date (YTD) starting from the first of the year. Key Metrics Historical Sparkbars 9-2017 9-2018 Percent Change YTD 2017 YTD 2018 Percent Change Current as of October 11, 2018. All data from the San Francisco MLS. Report © 2018 ShowingTime. | 15 Months Supply 2.9 2.8 - 3.4% -- -- -- Affordability Ratio 43 36 - 16.3% % of List Price Received 110.6% 110.7% + 0.1% 109.4% 41 69.9% + 3.9% + 1.6% 34 - 17.1% 111.2% % of Properties Sold Over List Price 69.6% 71.7% + 3.0% 67.3% Active Listings 1,219 1,243 + 2.0% -- Avg. Sales Price $1,415,513 $1,518,041 + 7.2% $1,487,857 Days on Market 35 27 - 22.9% 33 $1,350,027 + 8.0% + 7.0% 27 - 18.2% $1,592,048 -- -- Sold Listings 352 325 - 7.7% 3,695 3,851 + 4.2% Median Sales Price $1,245,000 $1,325,000 + 6.4% $1,250,000 + 4.4% Pending Sales 449 404 - 10.0% 3,855 3,990 + 3.5% New Listings 740 703 - 5.0% 5,114 5,340 9-2015 9-2016 9-2017 9-2018 9-2015 9-2016 9-2017 9-2018 9-2015 9-2016 9-2017 9-2018 9-2015 9-2016 9-2017 9-2018 9-2015 9-2016 9-2017 9-2018 9-2015 9-2016 9-2017 9-2018 9-2015 9-2016 9-2017 9-2018 9-2015 9-2016 9-2017 9-2018 9-2015 9-2016 9-2017 9-2018 9-2015 9-2016 9-2017 9-2018 9-2015 9-2016 9-2017 9-2018
- 16. Activity by District SF District 1: Northwest (Sea Cliff, Lake, Jordan Park / Laurel Heights, Outer Richmond, Central Richmond, Inner Richmond, Lone Mountain) SF District 2: Central West (Outer Sunset, Central Sunset, Inner Sunset, Outer Parkside, Parkside, Inner Parkside, Golden Gate Heights) SF District 3: Southwest (Pine Lake Park, Lake Shore, Merced Manor, Stonestown, Lakeside, Merced Heights, Ingleside, Ingleside Heights, Oceanview) SF District 4: Twin Peaks W (Forest Hill (& Ext), W Portal, St Francis Wd, Balboa Terr, Mt Dav Manor, Ingleside Terr, Monterey Hts, Wstwd Pk & H'lnds, Shrwd Fst, Miraloma Pk, Dmnd Hts, Mdtwn Terr) SF District 5: Central (Haight Ashbury, Cole Vly / Prnssus Hts, Clarndn Hts, Corona Hts, Twin Pks, Glen Pk, Noe Vly, Eureka Vly / Dolores Hts, Mission Dolores, Duboce Trngl, Buena Vista / Ashbury Hts) SF District 6: Central North (Lower Pacific Heights, Anza Vista, Western Addition, North Panhandle, Alamo Square, Hayes Valley) SF District 7: North (Marina, Cow Hollow, Presidio Heights, Pacific Heights) SF District 8: Northeast (North Waterfront, North Beach, Russian Hill, Telegraph Hill, Nob Hill, Financial District / Barbary Coast, Downtown, Van Ness / Civic Center, Tenderloin) SF District 9: Central East (Yerba Buena, South Beach, South of Market, Mission Bay, Inner Mission, Potrero Hill, Central Waterfront / Dogpatch, Bernal Heights) SF District 10: Southeast (Outer Mission, Mission Terr, Excelsior, Portola, Bayview, Silver Terr, Hunters Pt, Candlestick Pt, Bayview Hts, Little Hollywood, Visitation Vly, Crocker Amazon) 9-2017 9-2018 + / – 9-2017 9-2018 + / – 9-2017 9-2018 + / – 9-2017 9-2018 + / – 9-2017 9-2018 + / – Single Family 1 SF District 1 36 34 -5.6% 8 11 +37.5% $2,412,500 $2,650,000 +9.8% 9 22 +144.4% 2.6 2.2 -15.4% 2 SF District 2 45 59 +31.1% 40 35 -12.5% $1,366,500 $1,370,000 +0.3% 23 18 -21.7% 1.3 1.8 +38.5% 3 SF District 3 22 32 +45.5% 18 11 -38.9% $1,115,000 $1,225,000 +9.9% 22 31 +40.9% 1.6 2.4 +50.0% 4 SF District 4 50 66 +32.0% 23 20 -13.0% $1,420,000 $1,772,500 +24.8% 14 28 +100.0% 2.0 2.5 +25.0% 5 SF District 5 78 80 +2.6% 17 14 -17.6% $1,800,000 $1,986,360 +10.4% 28 33 +17.9% 2.9 3.1 +6.9% 6 SF District 6 14 10 -28.6% 1 3 +200.0% $2,950,000 $1,515,000 -48.6% 28 38 +35.7% 4.7 2.8 -40.4% 7 SF District 7 40 37 -7.5% 5 5 0.0% $3,500,000 $6,200,000 +77.1% 85 59 -30.6% 5.0 4.3 -14.0% 8 SF District 8 12 17 +41.7% 4 2 -50.0% $2,642,500 $4,123,500 +56.0% 40 10 -75.0% 4.7 6.7 +42.6% 9 SF District 9 56 66 +17.9% 16 12 -25.0% $1,475,000 $1,550,000 +5.1% 36 16 -55.6% 2.6 3.2 +23.1% 10 SF District 10 93 95 +2.2% 45 33 -26.7% $875,000 $1,000,000 +14.3% 34 15 -55.9% 2.4 2.5 +4.2% Condo/TIC/Coop 1 SF District 1 30 35 +16.7% 3 9 +200.0% $1,400,000 $1,600,000 +14.3% 15 26 +73.3% 3.2 2.5 -21.9% 2 SF District 2 6 10 +66.7% 4 2 -50.0% $857,500 $1,189,500 +38.7% 44 26 -40.9% 1.9 2.4 +26.3% 3 SF District 3 9 8 -11.1% 0 1 -- $0 $700,000 -- 0 12 -- 2.8 2.7 -3.6% 4 SF District 4 11 21 +90.9% 5 2 -60.0% $875,000 $1,380,000 +57.7% 15 62 +313.3% 3.7 4.5 +21.6% 5 SF District 5 100 80 -20.0% 17 25 +47.1% $1,407,000 $1,550,000 +10.2% 28 18 -35.7% 2.9 2.1 -27.6% 6 SF District 6 83 64 -22.9% 22 13 -40.9% $1,362,500 $1,300,000 -4.6% 31 16 -48.4% 3.1 2.7 -12.9% 7 SF District 7 54 63 +16.7% 14 16 +14.3% $1,360,000 $1,462,500 +7.5% 27 26 -3.7% 2.0 2.5 +25.0% 8 SF District 8 147 167 +13.6% 31 37 +19.4% $1,115,000 $1,020,000 -8.5% 66 33 -50.0% 3.7 4.0 +8.1% 9 SF District 9 304 275 -9.5% 73 68 -6.8% $1,050,000 $1,015,000 -3.3% 40 34 -15.0% 3.7 2.9 -21.6% 10 SF District 10 29 24 -17.2% 6 6 0.0% $782,500 $795,000 +1.6% 95 66 -30.5% 4.2 3.2 -23.8% Key metrics by report month for the districts of San Fransisco. Current as of October 11, 2018. All data from the San Francisco MLS. Report © 2018 ShowingTime. | 16 Active Listings Sold Listings Median Sales Price Days on Market Months Supply