SlideShare a Scribd company logo
1 of 16
Download to read offline
May 2019 Monthly Snapshot
One-Year Change in One-Year Change in
Median Sales Price
Single Family
Median Sales Price
Condo/TIC/Coop
2
3
4
5
6
7
8
9
10
11
12
13
14
15
16
Current as of June 11, 2019. All data from the San Francisco MLS. Report © 2019 ShowingTime.
Condo/TIC/Coop Activity Overview
Inventory of Active Listings
% of Properties Sold Over List Price
% of List Price Received
Housing Affordability Ratio
All Properties Activity Overview
New Listings
Pending Sales
Sold Listings
Median Sales Price
Average Sales Price
Days on Market Until Sale
Activity by District
Monthly Indicators
+ 4.9% - 0.7% + 1.1%
One-Year Change in
At this point in the year, we are getting a good sense for how the housing
market is likely to perform for the foreseeable future. And although it is not a
particularly exciting forecast, it is a desirable one. Markets across the country
are regulating toward a middle ground between buyers and sellers. While it
remains true that sales prices are running higher and that inventory options are
relatively low, buyers are beginning to find wiggle room at some price points
and geographies.
New Listings were down 15.1 percent for single family homes and 20.3 percent
for Condo/TIC/Coop properties. Pending Sales decreased 10.2 percent for
single family homes but increased 12.8 percent for Condo/TIC/Coop properties.
The Median Sales Price was up 4.9 percent to $1,697,500 for single family
homes but decreased 0.7 percent to $1,249,000 for Condo/TIC/Coop
properties. Months Supply of Inventory decreased 4.8 percent for single family
units and 20.7 percent for Condo/TIC/Coop units.
An extended trend of low unemployment, higher wages and favorable mortgage
rates has been a terrific driver of housing stability in recent years. What is
different about this year so far is that prices are not rising as quickly. Some of
the hottest Western markets are even cooling slightly, while some Northeast
markets are achieving a state of recovery after a decade of battling back from
recession. As a whole, the selling season is looking fairly stable across the
nation.
Median Sales Price
All Property Types
Residential real estate activity in San Francisco County (Districts 1-10)
composed of single-family properties, townhomes and condominiums.
Percent changes are calculated using rounded figures.
Single Family Activity Overview
Months Supply of Inventory
Single Family Activity Overview
Key metrics by report month and for year-to-date (YTD) starting from the first of the year.
Key Metrics Historical Sparkbars 5-2018 5-2019 Percent Change YTD 2018 YTD 2019 Percent Change
- 10.8%1,085
844 + 0.4%
$1,600,000 - 0.9%
+ 1.9%
Pending Sales 275 247 - 10.2% - 3.3%942 911
New Listings 271 230 - 15.1% 1,216
Sold Listings 249 234 - 6.0% 841
Median Sales Price $1,618,888 $1,697,500 + 4.9% $1,615,000
27 + 22.7%
$2,064,986
-- --
Days on Market 20 22 + 10.0% 22
Avg. Sales Price $2,020,490 $2,147,560 + 6.3% $2,025,614
Active Listings 405 373 - 7.9% --
% of Properties Sold Over List Price 84.7% 79.9% - 5.7% 79.3%
30
74.4% - 6.2%
- 5.2%
31 + 3.3%
111.6%% of List Price Received 119.5% 113.5% - 5.0% 117.7%
Current as of June 11, 2019. All data from the San Francisco MLS. Report © 2019 ShowingTime. | 2
Months Supply 2.1 2.0 - 4.8% -- -- --
Affordability Ratio 30 30 0.0%
5-2016 5-2017 5-2018 5-2019
5-2016 5-2017 5-2018 5-2019
5-2016 5-2017 5-2018 5-2019
5-2016 5-2017 5-2018 5-2019
5-2016 5-2017 5-2018 5-2019
5-2016 5-2017 5-2018 5-2019
5-2016 5-2017 5-2018 5-2019
5-2016 5-2017 5-2018 5-2019
5-2016 5-2017 5-2018 5-2019
5-2016 5-2017 5-2018 5-2019
5-2016 5-2017 5-2018 5-2019
Condo/TIC/Coop Activity Overview
Key metrics by report month and for year-to-date (YTD) starting from the first of the year.
Key Metrics Historical Sparkbars 5-2018 5-2019 Percent Change YTD 2018 YTD 2019 Percent Change
- 12.7%
Pending Sales 297 335 + 12.8% 1,324 1,296 - 2.1%
New Listings 370 295 - 20.3% 1,852 1,616
Sold Listings 312 329 + 5.4% 1,248 1,188 - 4.8%
Median Sales Price $1,257,500 $1,249,000 - 0.7% $1,215,000 $1,200,000 - 1.2%
- 0.9%
37 + 15.6%
$1,334,135
-- --
Days on Market 27 29 + 7.4% 32
Avg. Sales Price $1,399,046 $1,340,145 - 4.2% $1,346,516
Active Listings 723 574 - 20.6% --
% of Properties Sold Over List Price 67.6% 65.3% - 3.4% 59.9%
46
56.6% - 5.5%
- 1.7%
49 + 6.5%
105.1%% of List Price Received 108.4% 107.4% - 0.9% 106.9%
Current as of June 11, 2019. All data from the San Francisco MLS. Report © 2019 ShowingTime. | 3
Months Supply 2.9 2.3 - 20.7% -- -- --
Affordability Ratio 44 47 + 6.8%
5-2016 5-2017 5-2018 5-2019
5-2016 5-2017 5-2018 5-2019
5-2016 5-2017 5-2018 5-2019
5-2016 5-2017 5-2018 5-2019
5-2016 5-2017 5-2018 5-2019
5-2016 5-2017 5-2018 5-2019
5-2016 5-2017 5-2018 5-2019
5-2016 5-2017 5-2018 5-2019
5-2016 5-2017 5-2018 5-2019
5-2016 5-2017 5-2018 5-2019
5-2016 5-2017 5-2018 5-2019
New Listings
New Listings
Single
Family
Year-Over-Year
Change
Condo/TIC/
Coop
Year-Over-Year
Change
Jun-2018 266 +11.8% 358 +14.4%
Jul-2018 239 +13.3% 259 -5.5%
Aug-2018 249 +16.4% 311 +6.1%
Sep-2018 337 +12.0% 452 +3.0%
Oct-2018 258 +7.9% 341 +3.6%
Nov-2018 156 +7.6% 196 -6.2%
Dec-2018 81 +3.8% 122 -5.4%
Jan-2019 220 +17.0% 350 -5.1%
Feb-2019 184 -11.5% 296 -16.9%
Mar-2019 222 -20.1% 334 -11.9%
Apr-2019 229 -15.5% 341 -9.8%
May-2019 230 -15.1% 295 -20.3%
12-Month Avg 223 +1.1% 305 -4.8%
Historical New Listings by Month
Current as of June 11, 2019. All data from the San Francisco MLS. Report © 2019 ShowingTime. | 4
A count of the properties that have been newly listed on the market in a given month.
287
361
271
370
230
295
Single Family Condo/TIC/Coop
May
0
100
200
300
400
500
600
700
1-2005 1-2006 1-2007 1-2008 1-2009 1-2010 1-2011 1-2012 1-2013 1-2014 1-2015 1-2016 1-2017 1-2018 1-2019
Single Family Condo/TIC/Coop
1,175
1,656
1,216
1,852
1,085
1,616
Single Family Condo/TIC/Coop
Year to Date
2017 2018 2019
- 20.3%+ 2.5%- 15.1%- 5.6% + 11.8%- 10.8%+ 3.5% - 12.7%
2017 2018 2019 2017 2018 2019 2017 2018 2019
+ 11.7% - 3.9% - 5.6%- 3.5%
Pending Sales
Pending Sales
Single
Family
Year-Over-Year
Change
Condo/TIC/
Coop
Year-Over-Year
Change
Jun-2018 203 -18.5% 302 +4.1%
Jul-2018 165 -4.6% 247 +18.2%
Aug-2018 172 -16.5% 232 +9.4%
Sep-2018 193 -5.4% 219 -10.2%
Oct-2018 251 +1.2% 291 -11.8%
Nov-2018 187 -5.6% 222 -5.1%
Dec-2018 121 +13.1% 147 -23.4%
Jan-2019 89 +2.3% 121 -32.8%
Feb-2019 145 -8.2% 228 +1.8%
Mar-2019 209 -2.8% 298 -11.3%
Apr-2019 221 +6.8% 314 +9.4%
May-2019 247 -10.2% 335 +12.8%
12-Month Avg 184 -5.3% 246 -2.6%
Historical Pending Sales by Month
Current as of June 11, 2019. All data from the San Francisco MLS. Report © 2019 ShowingTime. | 5
A count of the properties on which offers have been accepted in a given month.
240
306
275
297
247
335
Single Family Condo/TIC/Coop
May
0
100
200
300
400
1-2005 1-2006 1-2007 1-2008 1-2009 1-2010 1-2011 1-2012 1-2013 1-2014 1-2015 1-2016 1-2017 1-2018 1-2019
Single Family Condo/TIC/Coop
879
1,189
942
1,324
911
1,296
Single Family Condo/TIC/Coop
Year to Date
2017 2018 2019
+ 12.8%- 2.9%- 10.2%+ 14.6% + 11.4%- 3.3%+ 7.2% - 2.1%
2017 2018 2019 2017 2018 2019 2017 2018 2019
- 4.0% - 0.3% + 5.7%+ 7.4%
Sold Listings
Sold Listings
Single
Family
Year-Over-Year
Change
Condo/TIC/
Coop
Year-Over-Year
Change
Jun-2018 231 +0.4% 303 -6.5%
Jul-2018 192 -8.6% 273 +14.2%
Aug-2018 192 -9.9% 260 +18.7%
Sep-2018 146 -17.5% 183 +4.6%
Oct-2018 246 +5.1% 293 -5.8%
Nov-2018 220 -10.2% 264 -5.0%
Dec-2018 160 +7.4% 194 -22.4%
Jan-2019 100 +5.3% 114 -23.5%
Feb-2019 113 +5.6% 164 -18.8%
Mar-2019 171 -14.5% 263 -9.0%
Apr-2019 226 +18.9% 318 +7.4%
May-2019 234 -6.0% 329 +5.4%
12-Month Avg 186 -3.0% 247 -2.8%
Historical Sold Listings by Month
Current as of June 11, 2019. All data from the San Francisco MLS. Report © 2019 ShowingTime. | 6
A count of the actual sales that closed in a given month.
218
272
249
312
234
329
Single Family Condo/TIC/Coop
May
0
100
200
300
400
1-2005 1-2006 1-2007 1-2008 1-2009 1-2010 1-2011 1-2012 1-2013 1-2014 1-2015 1-2016 1-2017 1-2018 1-2019
Single Family Condo/TIC/Coop
811
1,098
841
1,248
844
1,188
Single Family Condo/TIC/Coop
Year to Date
2017 2018 2019
+ 5.4%+ 14.7%- 6.0%+ 14.2% + 13.7%+ 0.4%+ 3.7% - 4.8%
2017 2018 2019 2017 2018 2019 2017 2018 2019
+ 9.0% + 4.9% + 4.8%+ 5.4%
Median Sales Price
Median Sales Price
Single
Family
Year-Over-Year
Change
Condo/TIC/
Coop
Year-Over-Year
Change
Jun-2018 $1,625,000 +11.2% $1,170,000 +4.0%
Jul-2018 $1,626,250 +16.2% $1,150,000 0.0%
Aug-2018 $1,544,000 +12.3% $1,234,400 +5.1%
Sep-2018 $1,500,000 +13.6% $1,150,000 +5.0%
Oct-2018 $1,600,000 +1.6% $1,215,000 +6.6%
Nov-2018 $1,427,500 -4.5% $1,193,625 -3.5%
Dec-2018 $1,492,500 +2.9% $1,170,000 +4.5%
Jan-2019 $1,389,000 +4.4% $1,040,000 -5.5%
Feb-2019 $1,500,000 -11.8% $1,130,000 +4.1%
Mar-2019 $1,650,000 -2.2% $1,250,000 0.0%
Apr-2019 $1,612,500 -2.2% $1,222,500 -2.2%
May-2019 $1,697,500 +4.9% $1,249,000 -0.7%
12-Month Avg* $1,575,000 +5.0% $1,200,000 +2.1%
Historical Median Sales Price by Month
* Median Sales Price for all properties from June 2018 through May 2019. This is not the average
of the individual figures above.
Current as of June 11, 2019. All data from the San Francisco MLS. Report © 2019 ShowingTime. | 7
Point at which half of the sales sold for more and half sold for less, not accounting for seller concessions, in a given month.
$1,475,000
$1,169,044
$1,618,888
$1,257,500
$1,697,500
$1,249,000
Single Family Condo/TIC/Coop
May
$400,000
$600,000
$800,000
$1,000,000
$1,200,000
$1,400,000
$1,600,000
$1,800,000
1-2005 1-2006 1-2007 1-2008 1-2009 1-2010 1-2011 1-2012 1-2013 1-2014 1-2015 1-2016 1-2017 1-2018 1-2019
Single Family Condo/TIC/Coop
$1,360,666
$1,129,125
$1,615,000
$1,215,000
$1,600,000
$1,200,000
Single Family Condo/TIC/Coop
Year to Date
2017 2018 2019
- 0.7%+ 7.6%+ 4.9%+ 9.8% + 7.6%- 0.9%+ 18.7% - 1.2%
2017 2018 2019 2017 2018 2019 2017 2018 2019
+ 9.3% + 0.8% + 2.6%+ 8.0%
Average Sales Price
Avg. Sales Price
Single
Family
Year-Over-Year
Change
Condo/TIC/
Coop
Year-Over-Year
Change
Jun-2018 $1,943,346 +12.5% $1,337,494 -1.0%
Jul-2018 $1,969,483 +13.3% $1,242,275 -0.1%
Aug-2018 $1,834,962 +17.6% $1,347,161 +6.1%
Sep-2018 $1,826,997 +13.4% $1,255,936 +3.2%
Oct-2018 $2,160,394 +7.9% $1,343,310 +5.3%
Nov-2018 $1,864,335 +6.2% $1,263,347 -8.9%
Dec-2018 $1,786,072 -6.4% $1,329,973 +5.2%
Jan-2019 $1,751,963 -2.0% $1,177,310 -10.9%
Feb-2019 $1,871,058 -11.2% $1,363,140 +7.8%
Mar-2019 $2,037,898 +4.5% $1,341,515 -2.2%
Apr-2019 $2,235,456 +2.3% $1,363,076 +2.1%
May-2019 $2,147,560 +6.3% $1,340,145 -4.2%
12-Month Avg* $1,979,533 +6.7% $1,316,626 +0.1%
Historical Average Sales Price by Month
* Avg. Sales Price for all properties from June 2018 through May 2019. This is not the average of
the individual figures above.
Current as of June 11, 2019. All data from the San Francisco MLS. Report © 2019 ShowingTime. | 8
Average sales price for all closed sales, not accounting for seller concessions, in a given month.
$1,835,738
$1,346,544
$2,020,490
$1,399,046
$2,147,560
$1,340,145
Single Family Condo/TIC/Coop
May
$500,000
$1,000,000
$1,500,000
$2,000,000
$2,500,000
1-2005 1-2006 1-2007 1-2008 1-2009 1-2010 1-2011 1-2012 1-2013 1-2014 1-2015 1-2016 1-2017 1-2018 1-2019
Single Family Condo/TIC/Coop
$1,811,450
$1,295,754
$2,025,614
$1,346,516
$2,064,986
$1,334,135
Single Family Condo/TIC/Coop
Year to Date
2017 2018 2019
- 4.2%+ 3.9%+ 6.3%+ 10.1% + 3.9%+ 1.9%+ 11.8% - 0.9%
2017 2018 2019 2017 2018 2019 2017 2018 2019
+ 12.4% + 7.3% + 2.6%+ 6.1%
Days on Market Until Sale
Days on Market
Single
Family
Year-Over-Year
Change
Condo/TIC/
Coop
Year-Over-Year
Change
Jun-2018 18 -33.3% 27 -27.0%
Jul-2018 21 -12.5% 31 -6.1%
Aug-2018 22 -18.5% 36 -12.2%
Sep-2018 23 -17.9% 30 -28.6%
Oct-2018 24 +9.1% 27 -12.9%
Nov-2018 26 0.0% 38 +8.6%
Dec-2018 33 +17.9% 44 -2.2%
Jan-2019 39 +18.2% 55 0.0%
Feb-2019 29 +31.8% 40 +8.1%
Mar-2019 26 +18.2% 35 +34.6%
Apr-2019 26 +44.4% 38 +46.2%
May-2019 22 +10.0% 29 +7.4%
12-Month Avg* 25 +2.0% 34 -1.6%
Historical Days on Market Until Sale by Month
* Days on Market for all properties from June 2018 through May 2019. This is not the average of
the individual figures above.
Current as of June 11, 2019. All data from the San Francisco MLS. Report © 2019 ShowingTime. | 9
Average number of days between when a property is listed and when an offer is accepted in a given month.
24
33
20
27
22
29
Single Family Condo/TIC/Coop
May
0
20
40
60
80
100
120
1-2005 1-2006 1-2007 1-2008 1-2009 1-2010 1-2011 1-2012 1-2013 1-2014 1-2015 1-2016 1-2017 1-2018 1-2019
Single Family Condo/TIC/Coop
30
37
22
32
27
37
Single Family Condo/TIC/Coop
Year to Date
2017 2018 2019
+ 7.4%- 18.2%+ 10.0%- 16.7% - 13.5%+ 22.7%- 26.7% + 15.6%
2017 2018 2019 2017 2018 2019 2017 2018 2019
- 7.7% 0.0% + 5.7%0.0%
Inventory of Active Listings
Active Listings
Single
Family
Year-Over-Year
Change
Condo/TIC/
Coop
Year-Over-Year
Change
Jun-2018 431 +12.2% 715 +16.4%
Jul-2018 463 +18.1% 654 +8.5%
Aug-2018 490 +32.8% 667 +9.0%
Sep-2018 590 +35.9% 845 +11.8%
Oct-2018 539 +33.7% 830 +20.6%
Nov-2018 458 +41.4% 709 +18.8%
Dec-2018 322 +43.8% 502 +21.0%
Jan-2019 437 +37.4% 675 +16.4%
Feb-2019 444 +26.5% 695 +5.9%
Mar-2019 434 +9.9% 674 +3.1%
Apr-2019 425 -1.6% 656 -6.7%
May-2019 373 -7.9% 574 -20.6%
12-Month Avg* 451 +22.0% 683 +7.8%
Historical Inventory of Active Listings by Month
* Active Listings for all properties from June 2018 through May 2019. This is not the average of
the individual figures above.
Current as of June 11, 2019. All data from the San Francisco MLS. Report © 2019 ShowingTime. | 10
The number of properties available for sale in active status at the end of a given month.
429
661
405
723
373
574
Single Family Condo/TIC/Coop
May
0
250
500
750
1,000
1,250
1,500
1-2005 1-2006 1-2007 1-2008 1-2009 1-2010 1-2011 1-2012 1-2013 1-2014 1-2015 1-2016 1-2017 1-2018 1-2019
Single Family Condo/TIC/Coop
2017 2018 2019
- 20.6%+ 9.4%- 7.9%- 5.6%
2017 2018 2019
- 5.7% - 7.9%
% of Properties Sold Over List Price
% of Properties
Sold Over List Price
Single
Family
Year-Over-Year
Change
Condo/TIC/
Coop
Year-Over-Year
Change
Jun-2018 88.3% +10.4% 68.3% +16.6%
Jul-2018 85.4% +4.9% 63.4% +1.0%
Aug-2018 80.2% +2.3% 57.7% -4.9%
Sep-2018 81.5% -5.1% 63.4% +19.4%
Oct-2018 82.5% -1.6% 68.3% +2.6%
Nov-2018 73.6% -8.9% 54.5% -6.5%
Dec-2018 68.1% -7.0% 45.9% -15.6%
Jan-2019 60.0% -14.9% 41.2% +22.6%
Feb-2019 77.9% -3.1% 53.0% -10.0%
Mar-2019 73.7% -4.9% 56.3% -4.9%
Apr-2019 73.9% -5.1% 55.3% -17.0%
May-2019 79.9% -5.7% 65.3% -3.4%
12-Month Avg 78.1% -2.6% 59.2% -0.9%
Historical % of Properties Sold Over List Price by Month
* % of Properties Sold Over List Price for all properties from June 2018 through May 2019. This is
not the average of the individual figures above.
Current as of June 11, 2019. All data from the San Francisco MLS. Report © 2019 ShowingTime. | 11
Percentage found when dividing the number of properties sold by properties sold over its original list price, not accounting for seller
concessions.
78.9%
61.0%
84.7%
67.6%
79.9%
65.3%
Single Family Condo/TIC/Coop
May
0.0%
20.0%
40.0%
60.0%
80.0%
100.0%
1-2005 1-2006 1-2007 1-2008 1-2009 1-2010 1-2011 1-2012 1-2013 1-2014 1-2015 1-2016 1-2017 1-2018 1-2019
Single Family Condo/TIC/Coop
75.3%
57.9%
79.3%
59.9%
74.4%
56.6%
Single Family Condo/TIC/Coop
Year to Date
2017 2018 2019
- 3.4%+ 10.8%- 5.7%+ 7.4% + 3.5%- 6.2%+ 5.3% - 5.5%
2017 2018 2019 2017 2018 2019 2017 2018 2019
- 0.8% - 3.8% - 7.4%- 9.5%
% of List Price Received
% of List Price
Received
Single
Family
Year-Over-Year
Change
Condo/TIC/
Coop
Year-Over-Year
Change
Jun-2018 120.1% +2.8% 107.3% +1.4%
Jul-2018 117.2% +0.1% 107.1% +1.0%
Aug-2018 114.7% -0.6% 105.6% -0.1%
Sep-2018 115.4% -0.8% 106.5% +1.6%
Oct-2018 114.0% -1.4% 107.7% +1.0%
Nov-2018 111.2% -3.7% 104.1% -0.4%
Dec-2018 110.5% -3.3% 102.1% -1.6%
Jan-2019 106.0% -5.6% 101.0% -0.7%
Feb-2019 112.6% -2.8% 104.2% -0.9%
Mar-2019 110.6% -5.9% 104.7% -2.2%
Apr-2019 112.4% -5.8% 104.9% -3.7%
May-2019 113.5% -5.0% 107.4% -0.9%
12-Month Avg* 113.6% -2.5% 105.6% -0.3%
Historical % of List Price Received by Month
* % of List Price Received for all properties from June 2018 through May 2019. This is not the
average of the individual figures above.
Current as of June 11, 2019. All data from the San Francisco MLS. Report © 2019 ShowingTime. | 12
Percentage found when dividing a property’s sales price by its most recent list price, then taking the average for all properties sold in a given
month, not accounting for seller concessions.
115.3%
105.4%
119.5%
108.4%
113.5%
107.4%
Single Family Condo/TIC/Coop
May
113.5%
104.4%
117.7%
106.9%
111.6%
105.1%
Single Family Condo/TIC/Coop
Year to Date
90.0%
100.0%
110.0%
120.0%
130.0%
1-2005 1-2006 1-2007 1-2008 1-2009 1-2010 1-2011 1-2012 1-2013 1-2014 1-2015 1-2016 1-2017 1-2018 1-2019
Single Family Condo/TIC/Coop
2017 2018 2019
- 0.9%+ 2.8%- 5.0%+ 3.6%
2017 2018 2019
+ 0.1% - 0.7%
2017 2018 2019
- 1.7%+ 2.4%- 5.2%+ 3.7%
2017 2018 2019
- 0.2% - 1.1%
Housing Affordability Ratio
Affordability Ratio
Single
Family
Year-Over-Year
Change
Condo/TIC/
Coop
Year-Over-Year
Change
Jun-2018 30 -14.3% 48 -9.4%
Jul-2018 30 -18.9% 49 -5.8%
Aug-2018 31 -18.4% 45 -13.5%
Sep-2018 31 -20.5% 47 -14.5%
Oct-2018 28 -12.5% 41 -21.2%
Nov-2018 32 -8.6% 43 -12.2%
Dec-2018 33 -5.7% 48 -9.4%
Jan-2019 35 -5.4% 54 +3.8%
Feb-2019 33 +13.8% 51 -3.8%
Mar-2019 30 +3.4% 46 0.0%
Apr-2019 31 +6.9% 48 +6.7%
May-2019 30 0.0% 47 +6.8%
12-Month Avg* 31 -11.4% 34 -6.9%
Historical Housing Affordability Ratio by Month
* Affordability Ratio for all properties from June 2018 through May 2019. This is not the average
of the individual figures above.
Current as of June 11, 2019. All data from the San Francisco MLS. Report © 2019 ShowingTime. | 13
This index measures housing affordability for the region. For example, an index of 120 means the median household income is 120% of what is
necessary to qualify for the median-priced home under prevailing interest rates. A higher number means greater affordability.
35
51
30
44
30
47
Single Family Condo/TIC/Coop
May
20
40
60
80
100
1-2005 1-2006 1-2007 1-2008 1-2009 1-2010 1-2011 1-2012 1-2013 1-2014 1-2015 1-2016 1-2017 1-2018 1-2019
Single Family Condo/TIC/Coop
2017 2018 2019
+ 6.8%- 13.7%0.0%- 14.3%
2017 2018 2019
- 10.3% - 8.9%
38
53
30
46
31
49
Single Family Condo/TIC/Coop
Year to Date
2017 2018 2019
+ 6.5%- 13.2%+ 3.3%- 21.1%
2017 2018 2019
- 2.6% - 5.4%
Months Supply of Inventory
Months Supply
Single
Family
Year-Over-Year
Change
Condo/TIC/
Coop
Year-Over-Year
Change
Jun-2018 2.3 +9.5% 2.8 +7.7%
Jul-2018 2.4 +14.3% 2.5 -3.8%
Aug-2018 2.6 +30.0% 2.6 0.0%
Sep-2018 3.2 +39.1% 3.3 +3.1%
Oct-2018 2.9 +38.1% 3.3 +17.9%
Nov-2018 2.5 +47.1% 2.8 +12.0%
Dec-2018 1.7 +41.7% 2.0 +17.6%
Jan-2019 2.3 +35.3% 2.8 +16.7%
Feb-2019 2.4 +33.3% 2.8 +3.7%
Mar-2019 2.3 +9.5% 2.8 +7.7%
Apr-2019 2.3 0.0% 2.7 -3.6%
May-2019 2.0 -4.8% 2.3 -20.7%
12-Month Avg* 2.4 +24.0% 2.7 +4.8%
Historical Months Supply of Inventory by Month
* Months Supply for all properties from June 2018 through May 2019. This is not the average of
the individual figures above.
Current as of June 11, 2019. All data from the San Francisco MLS. Report © 2019 ShowingTime. | 14
The inventory of homes for sale at the end of a given month, divided by the average monthly pending sales from the last 12 months.
2.3
2.8
2.1
2.9
2.0
2.3
Single Family Condo/TIC/Coop
May
0.0
2.0
4.0
6.0
8.0
10.0
1-2005 1-2006 1-2007 1-2008 1-2009 1-2010 1-2011 1-2012 1-2013 1-2014 1-2015 1-2016 1-2017 1-2018 1-2019
Single Family Condo/TIC/Coop
2017 2018 2019
- 20.7%+ 3.6%- 4.8%- 8.7%
2017 2018 2019
- 4.2% - 9.7%
All Properties Activity Overview
Key metrics by report month and for year-to-date (YTD) starting from the first of the year.
Key Metrics Historical Sparkbars 5-2018 5-2019 Percent Change YTD 2018 YTD 2019 Percent Change
- 12.0%
Pending Sales 572 582 + 1.7% 2,266 2,207 - 2.6%
New Listings 641 525 - 18.1% 3,068 2,701
Sold Listings 561 563 + 0.4% 2,089 2,032 - 2.7%
Median Sales Price $1,385,000 $1,400,000 + 1.1% $1,360,000 $1,355,500 - 0.3%
+ 1.1%
33 + 17.9%
$1,637,697
-- --
Days on Market 24 26 + 8.3% 28
Avg. Sales Price $1,674,874 $1,675,731 + 0.1% $1,619,911
Active Listings 1,128 947 - 16.0% --
% of Properties Sold Over List Price 75.2% 71.4% - 5.1% 67.7%
35
64.0% - 5.5%
- 3.1%
36 + 2.9%
107.8%% of List Price Received 113.3% 109.9% - 3.0% 111.2%
Current as of June 11, 2019. All data from the San Francisco MLS. Report © 2019 ShowingTime. | 15
Months Supply 2.5 2.2 - 12.0% -- -- --
Affordability Ratio 34 35 + 2.9%
5-2016 5-2017 5-2018 5-2019
5-2016 5-2017 5-2018 5-2019
5-2016 5-2017 5-2018 5-2019
5-2016 5-2017 5-2018 5-2019
5-2016 5-2017 5-2018 5-2019
5-2016 5-2017 5-2018 5-2019
5-2016 5-2017 5-2018 5-2019
5-2016 5-2017 5-2018 5-2019
5-2016 5-2017 5-2018 5-2019
5-2016 5-2017 5-2018 5-2019
5-2016 5-2017 5-2018 5-2019
Activity by District
SF District 1: Northwest (Sea Cliff, Lake, Jordan Park / Laurel Heights, Outer Richmond, Central Richmond, Inner Richmond, Lone Mountain)
SF District 2: Central West (Outer Sunset, Central Sunset, Inner Sunset, Outer Parkside, Parkside, Inner Parkside, Golden Gate Heights)
SF District 3: Southwest (Pine Lake Park, Lake Shore, Merced Manor, Stonestown, Lakeside, Merced Heights, Ingleside, Ingleside Heights, Oceanview)
SF District 4: Twin Peaks W (Forest Hill (& Ext), W Portal, St Francis Wd, Balboa Terr, Mt Dav Manor, Ingleside Terr, Monterey Hts, Wstwd Pk & H'lnds, Shrwd Fst, Miraloma Pk, Dmnd Hts, Mdtwn Terr)
SF District 5: Central (Haight Ashbury, Cole Vly / Prnssus Hts, Clarndn Hts, Corona Hts, Twin Pks, Glen Pk, Noe Vly, Eureka Vly / Dolores Hts, Mission Dolores, Duboce Trngl, Buena Vista / Ashbury Hts)
SF District 6: Central North (Lower Pacific Heights, Anza Vista, Western Addition, North Panhandle, Alamo Square, Hayes Valley)
SF District 7: North (Marina, Cow Hollow, Presidio Heights, Pacific Heights)
SF District 8: Northeast (North Waterfront, North Beach, Russian Hill, Telegraph Hill, Nob Hill, Financial District / Barbary Coast, Downtown, Van Ness / Civic Center, Tenderloin)
SF District 9: Central East (Yerba Buena, South Beach, South of Market, Mission Bay, Inner Mission, Potrero Hill, Central Waterfront / Dogpatch, Bernal Heights)
SF District 10: Southeast (Outer Mission, Mission Terr, Excelsior, Portola, Bayview, Silver Terr, Hunters Pt, Candlestick Pt, Bayview Hts, Little Hollywood, Visitation Vly, Crocker Amazon)
5-2018 5-2019 + / – 5-2018 5-2019 + / – 5-2018 5-2019 + / – 5-2018 5-2019 + / – 5-2018 5-2019 + / –
Single Family
1 SF District 1 31 28 -9.7% 27 22 -18.5% $2,100,000 $2,520,000 +20.0% 25 23 -8.0% 2.1 1.8 -14.3%
2 SF District 2 46 47 +2.2% 41 43 +4.9% $1,600,000 $1,695,000 +5.9% 15 19 +26.7% 1.3 1.5 +15.4%
3 SF District 3 28 26 -7.1% 23 11 -52.2% $1,228,200 $1,305,000 +6.3% 23 16 -30.4% 2.0 2.2 +10.0%
4 SF District 4 50 29 -42.0% 43 35 -18.6% $1,850,000 $1,685,000 -8.9% 17 21 +23.5% 1.8 1.1 -38.9%
5 SF District 5 73 56 -23.3% 26 28 +7.7% $2,325,000 $2,875,000 +23.7% 19 28 +47.4% 2.8 2.1 -25.0%
6 SF District 6 11 14 +27.3% 3 4 +33.3% $4,300,000 $3,177,500 -26.1% 31 22 -29.0% 3.4 3.4 0.0%
7 SF District 7 34 30 -11.8% 9 15 +66.7% $6,050,000 $4,150,000 -31.4% 23 43 +87.0% 3.8 3.5 -7.9%
8 SF District 8 12 18 +50.0% 3 5 +66.7% $3,564,875 $4,600,000 +29.0% 82 27 -67.1% 4.5 7.9 +75.6%
9 SF District 9 57 53 -7.0% 27 28 +3.7% $1,630,000 $1,505,000 -7.7% 18 15 -16.7% 2.6 2.7 +3.8%
10 SF District 10 63 72 +14.3% 47 43 -8.5% $1,100,000 $1,150,000 +4.5% 22 23 +4.5% 1.5 2.0 +33.3%
Condo/TIC/Coop
1 SF District 1 25 22 -12.0% 16 14 -12.5% $1,117,500 $1,447,500 +29.5% 16 27 +68.8% 2.0 1.6 -20.0%
2 SF District 2 5 5 0.0% 4 4 0.0% $1,242,500 $1,315,000 +5.8% 8 18 +125.0% 1.4 1.3 -7.1%
3 SF District 3 5 6 +20.0% 3 5 +66.7% $1,380,000 $1,220,000 -11.6% 31 50 +61.3% 1.9 1.9 0.0%
4 SF District 4 17 7 -58.8% 5 13 +160.0% $760,000 $879,000 +15.7% 13 40 +207.7% 4.1 1.3 -68.3%
5 SF District 5 95 49 -48.4% 47 51 +8.5% $1,500,000 $1,455,000 -3.0% 18 16 -11.1% 2.7 1.3 -51.9%
6 SF District 6 65 52 -20.0% 31 34 +9.7% $1,329,000 $1,187,500 -10.6% 36 19 -47.2% 2.5 2.4 -4.0%
7 SF District 7 65 39 -40.0% 31 26 -16.1% $1,555,555 $2,125,000 +36.6% 16 33 +106.3% 2.6 1.6 -38.5%
8 SF District 8 168 145 -13.7% 41 46 +12.2% $1,130,000 $1,090,000 -3.5% 32 40 +25.0% 4.1 3.4 -17.1%
9 SF District 9 254 212 -16.5% 126 129 +2.4% $1,250,000 $1,185,000 -5.2% 31 31 0.0% 2.7 2.4 -11.1%
10 SF District 10 24 37 +54.2% 8 7 -12.5% $690,250 $800,000 +15.9% 46 27 -41.3% 2.9 6.3 +117.2%
Key metrics by report month for the districts of San Fransisco.
Current as of June 11, 2019. All data from the San Francisco MLS. Report © 2019 ShowingTime. | 16
Active Listings Sold Listings Median Sales Price Days on Market Months Supply

More Related Content

What's hot

San Francisco market report June 2020
San Francisco market report June 2020San Francisco market report June 2020
San Francisco market report June 2020Ronny Budiutama
 
San Francisco Market Focus Report Jan 2020
San Francisco Market Focus Report Jan 2020San Francisco Market Focus Report Jan 2020
San Francisco Market Focus Report Jan 2020Ronny Budiutama
 
San Francisco Market Focus Report July 2019
San Francisco Market Focus Report July 2019San Francisco Market Focus Report July 2019
San Francisco Market Focus Report July 2019Ronny Budiutama
 
San Francisco market report September 2020
San Francisco market report September 2020San Francisco market report September 2020
San Francisco market report September 2020Ronny Budiutama
 
San Francisco market report April 2020
San Francisco market report April 2020San Francisco market report April 2020
San Francisco market report April 2020Ronny Budiutama
 
San Francisco Market Focus Report Feb 2020
San Francisco Market Focus Report Feb 2020San Francisco Market Focus Report Feb 2020
San Francisco Market Focus Report Feb 2020Ronny Budiutama
 
San Francisco Market Report March 2021
San Francisco Market Report March 2021San Francisco Market Report March 2021
San Francisco Market Report March 2021Ronny Budiutama
 
San Francisco Market Data October 2020
San Francisco Market Data October 2020San Francisco Market Data October 2020
San Francisco Market Data October 2020Ronny Budiutama
 
San Francisco market report May 2020
San Francisco market report May 2020San Francisco market report May 2020
San Francisco market report May 2020Ronny Budiutama
 
San Francisco Market Focus Report August 2019
San Francisco Market Focus Report August 2019San Francisco Market Focus Report August 2019
San Francisco Market Focus Report August 2019Ronny Budiutama
 
San Francisco market report August 2020
San Francisco market report August 2020San Francisco market report August 2020
San Francisco market report August 2020Ronny Budiutama
 
San Francisco Market Focus April 2018
San Francisco Market Focus April 2018San Francisco Market Focus April 2018
San Francisco Market Focus April 2018Ronny Budiutama
 
San Francisco Market Focus February 2018
San Francisco Market Focus February 2018San Francisco Market Focus February 2018
San Francisco Market Focus February 2018Ronny Budiutama
 
San Francisco Market Report for March 2020
San Francisco Market Report for March 2020San Francisco Market Report for March 2020
San Francisco Market Report for March 2020Ronny Budiutama
 
January 2018 San Francisco Market Update
January 2018 San Francisco Market UpdateJanuary 2018 San Francisco Market Update
January 2018 San Francisco Market UpdateRonny Budiutama
 
San Francisco Market Report December 2020
San Francisco Market Report December 2020San Francisco Market Report December 2020
San Francisco Market Report December 2020Ronny Budiutama
 
San Francisco Market Focus March 2018
San Francisco Market Focus March 2018San Francisco Market Focus March 2018
San Francisco Market Focus March 2018Ronny Budiutama
 
San Francisco Market Focus Report July
San Francisco Market Focus Report JulySan Francisco Market Focus Report July
San Francisco Market Focus Report JulyRonny Budiutama
 
San Francisco Market Focus Report September 2018
San Francisco Market Focus Report September 2018San Francisco Market Focus Report September 2018
San Francisco Market Focus Report September 2018Ronny Budiutama
 
San Francisco Market Focus May 2017
San Francisco Market Focus May 2017San Francisco Market Focus May 2017
San Francisco Market Focus May 2017Ronny Budiutama
 

What's hot (20)

San Francisco market report June 2020
San Francisco market report June 2020San Francisco market report June 2020
San Francisco market report June 2020
 
San Francisco Market Focus Report Jan 2020
San Francisco Market Focus Report Jan 2020San Francisco Market Focus Report Jan 2020
San Francisco Market Focus Report Jan 2020
 
San Francisco Market Focus Report July 2019
San Francisco Market Focus Report July 2019San Francisco Market Focus Report July 2019
San Francisco Market Focus Report July 2019
 
San Francisco market report September 2020
San Francisco market report September 2020San Francisco market report September 2020
San Francisco market report September 2020
 
San Francisco market report April 2020
San Francisco market report April 2020San Francisco market report April 2020
San Francisco market report April 2020
 
San Francisco Market Focus Report Feb 2020
San Francisco Market Focus Report Feb 2020San Francisco Market Focus Report Feb 2020
San Francisco Market Focus Report Feb 2020
 
San Francisco Market Report March 2021
San Francisco Market Report March 2021San Francisco Market Report March 2021
San Francisco Market Report March 2021
 
San Francisco Market Data October 2020
San Francisco Market Data October 2020San Francisco Market Data October 2020
San Francisco Market Data October 2020
 
San Francisco market report May 2020
San Francisco market report May 2020San Francisco market report May 2020
San Francisco market report May 2020
 
San Francisco Market Focus Report August 2019
San Francisco Market Focus Report August 2019San Francisco Market Focus Report August 2019
San Francisco Market Focus Report August 2019
 
San Francisco market report August 2020
San Francisco market report August 2020San Francisco market report August 2020
San Francisco market report August 2020
 
San Francisco Market Focus April 2018
San Francisco Market Focus April 2018San Francisco Market Focus April 2018
San Francisco Market Focus April 2018
 
San Francisco Market Focus February 2018
San Francisco Market Focus February 2018San Francisco Market Focus February 2018
San Francisco Market Focus February 2018
 
San Francisco Market Report for March 2020
San Francisco Market Report for March 2020San Francisco Market Report for March 2020
San Francisco Market Report for March 2020
 
January 2018 San Francisco Market Update
January 2018 San Francisco Market UpdateJanuary 2018 San Francisco Market Update
January 2018 San Francisco Market Update
 
San Francisco Market Report December 2020
San Francisco Market Report December 2020San Francisco Market Report December 2020
San Francisco Market Report December 2020
 
San Francisco Market Focus March 2018
San Francisco Market Focus March 2018San Francisco Market Focus March 2018
San Francisco Market Focus March 2018
 
San Francisco Market Focus Report July
San Francisco Market Focus Report JulySan Francisco Market Focus Report July
San Francisco Market Focus Report July
 
San Francisco Market Focus Report September 2018
San Francisco Market Focus Report September 2018San Francisco Market Focus Report September 2018
San Francisco Market Focus Report September 2018
 
San Francisco Market Focus May 2017
San Francisco Market Focus May 2017San Francisco Market Focus May 2017
San Francisco Market Focus May 2017
 

Similar to San Francisco Market Focus Report May 2019

San Francisco Market Focus Report May
San Francisco Market Focus Report MaySan Francisco Market Focus Report May
San Francisco Market Focus Report MayRonny Budiutama
 
San Francisco market focus report June 2018
San Francisco market focus report June 2018San Francisco market focus report June 2018
San Francisco market focus report June 2018Ronny Budiutama
 
San Francisco Market Focus June 2017
San Francisco Market Focus June 2017San Francisco Market Focus June 2017
San Francisco Market Focus June 2017Ronny Budiutama
 
San Francisco Market Focus Report October 2018
San Francisco Market Focus Report October 2018San Francisco Market Focus Report October 2018
San Francisco Market Focus Report October 2018Ronny Budiutama
 
San Francisco Market Focus April 2017
San Francisco Market Focus April 2017San Francisco Market Focus April 2017
San Francisco Market Focus April 2017Ronny Budiutama
 
San Francisco Market Report January 2021
San Francisco Market Report January 2021San Francisco Market Report January 2021
San Francisco Market Report January 2021Ronny Budiutama
 
San Francisco Market Focus June 2015
San Francisco Market Focus June 2015San Francisco Market Focus June 2015
San Francisco Market Focus June 2015Ronny Budiutama
 
San Francisco Real Estate Housing Market December 2016
San Francisco Real Estate Housing Market December 2016San Francisco Real Estate Housing Market December 2016
San Francisco Real Estate Housing Market December 2016Ronny Budiutama
 
San Francisco Market Focus June 2016
San Francisco Market Focus June 2016San Francisco Market Focus June 2016
San Francisco Market Focus June 2016Ronny Budiutama
 
San Francisco Market Focus March 2016
San Francisco Market Focus March 2016San Francisco Market Focus March 2016
San Francisco Market Focus March 2016Ronny Budiutama
 
San Francisco Market Focus May 2013
San Francisco Market Focus May 2013San Francisco Market Focus May 2013
San Francisco Market Focus May 2013Ronny Budiutama
 

Similar to San Francisco Market Focus Report May 2019 (11)

San Francisco Market Focus Report May
San Francisco Market Focus Report MaySan Francisco Market Focus Report May
San Francisco Market Focus Report May
 
San Francisco market focus report June 2018
San Francisco market focus report June 2018San Francisco market focus report June 2018
San Francisco market focus report June 2018
 
San Francisco Market Focus June 2017
San Francisco Market Focus June 2017San Francisco Market Focus June 2017
San Francisco Market Focus June 2017
 
San Francisco Market Focus Report October 2018
San Francisco Market Focus Report October 2018San Francisco Market Focus Report October 2018
San Francisco Market Focus Report October 2018
 
San Francisco Market Focus April 2017
San Francisco Market Focus April 2017San Francisco Market Focus April 2017
San Francisco Market Focus April 2017
 
San Francisco Market Report January 2021
San Francisco Market Report January 2021San Francisco Market Report January 2021
San Francisco Market Report January 2021
 
San Francisco Market Focus June 2015
San Francisco Market Focus June 2015San Francisco Market Focus June 2015
San Francisco Market Focus June 2015
 
San Francisco Real Estate Housing Market December 2016
San Francisco Real Estate Housing Market December 2016San Francisco Real Estate Housing Market December 2016
San Francisco Real Estate Housing Market December 2016
 
San Francisco Market Focus June 2016
San Francisco Market Focus June 2016San Francisco Market Focus June 2016
San Francisco Market Focus June 2016
 
San Francisco Market Focus March 2016
San Francisco Market Focus March 2016San Francisco Market Focus March 2016
San Francisco Market Focus March 2016
 
San Francisco Market Focus May 2013
San Francisco Market Focus May 2013San Francisco Market Focus May 2013
San Francisco Market Focus May 2013
 

More from Ronny Budiutama

San Francisco January 2024 Market Report
San Francisco January 2024 Market ReportSan Francisco January 2024 Market Report
San Francisco January 2024 Market ReportRonny Budiutama
 
San Francisco December 2023 Market Report
San Francisco December 2023 Market ReportSan Francisco December 2023 Market Report
San Francisco December 2023 Market ReportRonny Budiutama
 
San Francisco November 2023 Market Report
San Francisco November 2023 Market ReportSan Francisco November 2023 Market Report
San Francisco November 2023 Market ReportRonny Budiutama
 
2023 Annual San Francisco Housing Market
2023 Annual San Francisco Housing Market2023 Annual San Francisco Housing Market
2023 Annual San Francisco Housing MarketRonny Budiutama
 
October 2023 Report: San Francisco Real Estate Market Insights
October 2023 Report: San Francisco Real Estate Market InsightsOctober 2023 Report: San Francisco Real Estate Market Insights
October 2023 Report: San Francisco Real Estate Market InsightsRonny Budiutama
 
CA Weekly MLS Market Data Report - August 2023
CA Weekly MLS Market Data Report - August 2023CA Weekly MLS Market Data Report - August 2023
CA Weekly MLS Market Data Report - August 2023Ronny Budiutama
 
San Francisco Market Report July 2023.pdf
San Francisco Market Report July 2023.pdfSan Francisco Market Report July 2023.pdf
San Francisco Market Report July 2023.pdfRonny Budiutama
 
San Francisco May 2023 Market Report.pdf
San Francisco May 2023 Market Report.pdfSan Francisco May 2023 Market Report.pdf
San Francisco May 2023 Market Report.pdfRonny Budiutama
 
San Francisco June 2023 Market Report.pdf
San Francisco June 2023 Market Report.pdfSan Francisco June 2023 Market Report.pdf
San Francisco June 2023 Market Report.pdfRonny Budiutama
 
San Francisco Market Report March 2023.pdf
San Francisco Market Report March 2023.pdfSan Francisco Market Report March 2023.pdf
San Francisco Market Report March 2023.pdfRonny Budiutama
 
San Francisco Market Report February 2023
San Francisco Market Report February 2023San Francisco Market Report February 2023
San Francisco Market Report February 2023Ronny Budiutama
 
San Francisco Market Report January 2023.pdf
San Francisco Market Report January 2023.pdfSan Francisco Market Report January 2023.pdf
San Francisco Market Report January 2023.pdfRonny Budiutama
 
Annual Report on the San Francisco County Housing Market.pdf
Annual Report on the San Francisco County Housing Market.pdfAnnual Report on the San Francisco County Housing Market.pdf
Annual Report on the San Francisco County Housing Market.pdfRonny Budiutama
 
San Francisco Market Report December 2022.pdf
San Francisco Market Report December 2022.pdfSan Francisco Market Report December 2022.pdf
San Francisco Market Report December 2022.pdfRonny Budiutama
 
San Francisco Market Report November 2022.pdf
San Francisco Market Report November 2022.pdfSan Francisco Market Report November 2022.pdf
San Francisco Market Report November 2022.pdfRonny Budiutama
 
San Francisco Market Report October 2022.pdf
San Francisco Market Report October 2022.pdfSan Francisco Market Report October 2022.pdf
San Francisco Market Report October 2022.pdfRonny Budiutama
 
San Francisco Market Report September 2022.pdf
San Francisco Market Report September 2022.pdfSan Francisco Market Report September 2022.pdf
San Francisco Market Report September 2022.pdfRonny Budiutama
 
San Francisco Market Report August 2022.pdf
San Francisco Market Report August 2022.pdfSan Francisco Market Report August 2022.pdf
San Francisco Market Report August 2022.pdfRonny Budiutama
 
San Francisco Market Report July 2022.pdf
San Francisco Market Report July 2022.pdfSan Francisco Market Report July 2022.pdf
San Francisco Market Report July 2022.pdfRonny Budiutama
 
San Francisco Market Report June 2022.pdf
San Francisco Market Report June 2022.pdfSan Francisco Market Report June 2022.pdf
San Francisco Market Report June 2022.pdfRonny Budiutama
 

More from Ronny Budiutama (20)

San Francisco January 2024 Market Report
San Francisco January 2024 Market ReportSan Francisco January 2024 Market Report
San Francisco January 2024 Market Report
 
San Francisco December 2023 Market Report
San Francisco December 2023 Market ReportSan Francisco December 2023 Market Report
San Francisco December 2023 Market Report
 
San Francisco November 2023 Market Report
San Francisco November 2023 Market ReportSan Francisco November 2023 Market Report
San Francisco November 2023 Market Report
 
2023 Annual San Francisco Housing Market
2023 Annual San Francisco Housing Market2023 Annual San Francisco Housing Market
2023 Annual San Francisco Housing Market
 
October 2023 Report: San Francisco Real Estate Market Insights
October 2023 Report: San Francisco Real Estate Market InsightsOctober 2023 Report: San Francisco Real Estate Market Insights
October 2023 Report: San Francisco Real Estate Market Insights
 
CA Weekly MLS Market Data Report - August 2023
CA Weekly MLS Market Data Report - August 2023CA Weekly MLS Market Data Report - August 2023
CA Weekly MLS Market Data Report - August 2023
 
San Francisco Market Report July 2023.pdf
San Francisco Market Report July 2023.pdfSan Francisco Market Report July 2023.pdf
San Francisco Market Report July 2023.pdf
 
San Francisco May 2023 Market Report.pdf
San Francisco May 2023 Market Report.pdfSan Francisco May 2023 Market Report.pdf
San Francisco May 2023 Market Report.pdf
 
San Francisco June 2023 Market Report.pdf
San Francisco June 2023 Market Report.pdfSan Francisco June 2023 Market Report.pdf
San Francisco June 2023 Market Report.pdf
 
San Francisco Market Report March 2023.pdf
San Francisco Market Report March 2023.pdfSan Francisco Market Report March 2023.pdf
San Francisco Market Report March 2023.pdf
 
San Francisco Market Report February 2023
San Francisco Market Report February 2023San Francisco Market Report February 2023
San Francisco Market Report February 2023
 
San Francisco Market Report January 2023.pdf
San Francisco Market Report January 2023.pdfSan Francisco Market Report January 2023.pdf
San Francisco Market Report January 2023.pdf
 
Annual Report on the San Francisco County Housing Market.pdf
Annual Report on the San Francisco County Housing Market.pdfAnnual Report on the San Francisco County Housing Market.pdf
Annual Report on the San Francisco County Housing Market.pdf
 
San Francisco Market Report December 2022.pdf
San Francisco Market Report December 2022.pdfSan Francisco Market Report December 2022.pdf
San Francisco Market Report December 2022.pdf
 
San Francisco Market Report November 2022.pdf
San Francisco Market Report November 2022.pdfSan Francisco Market Report November 2022.pdf
San Francisco Market Report November 2022.pdf
 
San Francisco Market Report October 2022.pdf
San Francisco Market Report October 2022.pdfSan Francisco Market Report October 2022.pdf
San Francisco Market Report October 2022.pdf
 
San Francisco Market Report September 2022.pdf
San Francisco Market Report September 2022.pdfSan Francisco Market Report September 2022.pdf
San Francisco Market Report September 2022.pdf
 
San Francisco Market Report August 2022.pdf
San Francisco Market Report August 2022.pdfSan Francisco Market Report August 2022.pdf
San Francisco Market Report August 2022.pdf
 
San Francisco Market Report July 2022.pdf
San Francisco Market Report July 2022.pdfSan Francisco Market Report July 2022.pdf
San Francisco Market Report July 2022.pdf
 
San Francisco Market Report June 2022.pdf
San Francisco Market Report June 2022.pdfSan Francisco Market Report June 2022.pdf
San Francisco Market Report June 2022.pdf
 

Recently uploaded

Eco-Efficient Living: Redefining Sustainability through Leech's Green Design ...
Eco-Efficient Living: Redefining Sustainability through Leech's Green Design ...Eco-Efficient Living: Redefining Sustainability through Leech's Green Design ...
Eco-Efficient Living: Redefining Sustainability through Leech's Green Design ...Newman George Leech
 
Pride Wonderland Dhanori Pune Brochure.pdf
Pride Wonderland Dhanori Pune Brochure.pdfPride Wonderland Dhanori Pune Brochure.pdf
Pride Wonderland Dhanori Pune Brochure.pdfabbu831446
 
Cashpay_Call Girls In Gaur City Mall Noida ❤️8860477959 Escorts Service In 24...
Cashpay_Call Girls In Gaur City Mall Noida ❤️8860477959 Escorts Service In 24...Cashpay_Call Girls In Gaur City Mall Noida ❤️8860477959 Escorts Service In 24...
Cashpay_Call Girls In Gaur City Mall Noida ❤️8860477959 Escorts Service In 24...lizamodels9
 
Low Rate Call Girls in Triveni Complex Delhi Call 9990771857
Low Rate Call Girls in Triveni Complex Delhi Call 9990771857Low Rate Call Girls in Triveni Complex Delhi Call 9990771857
Low Rate Call Girls in Triveni Complex Delhi Call 9990771857delhimodel235
 
Call Girls In Sahibabad Ghaziabad ❤️8860477959 Low Rate Escorts Service In 24...
Call Girls In Sahibabad Ghaziabad ❤️8860477959 Low Rate Escorts Service In 24...Call Girls In Sahibabad Ghaziabad ❤️8860477959 Low Rate Escorts Service In 24...
Call Girls In Sahibabad Ghaziabad ❤️8860477959 Low Rate Escorts Service In 24...lizamodels9
 
Prestige Sector 94 at Noida E Brochure.pdf
Prestige Sector 94 at Noida E Brochure.pdfPrestige Sector 94 at Noida E Brochure.pdf
Prestige Sector 94 at Noida E Brochure.pdfsarak0han45400
 
Brigade Neopolis Kokapet, Hyderabad E- Brochure
Brigade Neopolis Kokapet, Hyderabad E- BrochureBrigade Neopolis Kokapet, Hyderabad E- Brochure
Brigade Neopolis Kokapet, Hyderabad E- Brochurefaheemali990101
 
Prestige Rainbow Waters Raidurgam, Gachibowli Hyderabad E- Brochure.pdf
Prestige Rainbow Waters Raidurgam, Gachibowli Hyderabad E- Brochure.pdfPrestige Rainbow Waters Raidurgam, Gachibowli Hyderabad E- Brochure.pdf
Prestige Rainbow Waters Raidurgam, Gachibowli Hyderabad E- Brochure.pdffaheemali990101
 
Namrata 7 Plumeria Drive Pimpri Chinchwad Pune Brochure.pdf
Namrata 7 Plumeria Drive Pimpri Chinchwad Pune Brochure.pdfNamrata 7 Plumeria Drive Pimpri Chinchwad Pune Brochure.pdf
Namrata 7 Plumeria Drive Pimpri Chinchwad Pune Brochure.pdfPrachiRudram
 
SVN Live 4.22.24 Weekly Property Broadcast
SVN Live 4.22.24 Weekly Property BroadcastSVN Live 4.22.24 Weekly Property Broadcast
SVN Live 4.22.24 Weekly Property BroadcastSVN International Corp.
 
Call Girls in Inderpuri Delhi 💯Call Us 🔝8264348440🔝
Call Girls in Inderpuri Delhi 💯Call Us 🔝8264348440🔝Call Girls in Inderpuri Delhi 💯Call Us 🔝8264348440🔝
Call Girls in Inderpuri Delhi 💯Call Us 🔝8264348440🔝soniya singh
 
Kohinoor Hinjewadi Phase 2 Pune | E-Brochure
Kohinoor Hinjewadi Phase 2 Pune | E-BrochureKohinoor Hinjewadi Phase 2 Pune | E-Brochure
Kohinoor Hinjewadi Phase 2 Pune | E-BrochureOmanaConsulting
 
MADHUGIRI FARM LAND BROCHURES (11)_compressed (1).pdf
MADHUGIRI FARM LAND BROCHURES (11)_compressed (1).pdfMADHUGIRI FARM LAND BROCHURES (11)_compressed (1).pdf
MADHUGIRI FARM LAND BROCHURES (11)_compressed (1).pdfknoxdigital1
 
Partner With the Golden Life Community for Single Women Over 55
Partner With the Golden Life Community for Single Women Over 55Partner With the Golden Life Community for Single Women Over 55
Partner With the Golden Life Community for Single Women Over 55Ron Surz
 
Call Girls In Peeragarhi, Delhi↫8447779280↬Call Girls in Peeragarhi Delhi NCR
Call Girls In Peeragarhi, Delhi↫8447779280↬Call Girls in Peeragarhi Delhi NCRCall Girls In Peeragarhi, Delhi↫8447779280↬Call Girls in Peeragarhi Delhi NCR
Call Girls In Peeragarhi, Delhi↫8447779280↬Call Girls in Peeragarhi Delhi NCRasmaqueen5
 
Low Rate Call Girls in Lajpat Nagar Delhi Call 9990771857
Low Rate Call Girls in Lajpat Nagar Delhi Call 9990771857Low Rate Call Girls in Lajpat Nagar Delhi Call 9990771857
Low Rate Call Girls in Lajpat Nagar Delhi Call 9990771857delhimodel235
 
Call Girls in Pitampura Delhi 💯Call Us 🔝8264348440🔝
Call Girls in Pitampura Delhi 💯Call Us 🔝8264348440🔝Call Girls in Pitampura Delhi 💯Call Us 🔝8264348440🔝
Call Girls in Pitampura Delhi 💯Call Us 🔝8264348440🔝soniya singh
 

Recently uploaded (20)

Low Rate Call Girls in Triveni Complex Delhi Call 9873940964
Low Rate Call Girls in Triveni Complex Delhi Call 9873940964Low Rate Call Girls in Triveni Complex Delhi Call 9873940964
Low Rate Call Girls in Triveni Complex Delhi Call 9873940964
 
young call girls in Lajpat Nagar,🔝 9953056974 🔝 escort Service
young call girls in Lajpat Nagar,🔝 9953056974 🔝 escort Serviceyoung call girls in Lajpat Nagar,🔝 9953056974 🔝 escort Service
young call girls in Lajpat Nagar,🔝 9953056974 🔝 escort Service
 
Eco-Efficient Living: Redefining Sustainability through Leech's Green Design ...
Eco-Efficient Living: Redefining Sustainability through Leech's Green Design ...Eco-Efficient Living: Redefining Sustainability through Leech's Green Design ...
Eco-Efficient Living: Redefining Sustainability through Leech's Green Design ...
 
Pride Wonderland Dhanori Pune Brochure.pdf
Pride Wonderland Dhanori Pune Brochure.pdfPride Wonderland Dhanori Pune Brochure.pdf
Pride Wonderland Dhanori Pune Brochure.pdf
 
Cashpay_Call Girls In Gaur City Mall Noida ❤️8860477959 Escorts Service In 24...
Cashpay_Call Girls In Gaur City Mall Noida ❤️8860477959 Escorts Service In 24...Cashpay_Call Girls In Gaur City Mall Noida ❤️8860477959 Escorts Service In 24...
Cashpay_Call Girls In Gaur City Mall Noida ❤️8860477959 Escorts Service In 24...
 
Low Rate Call Girls in Triveni Complex Delhi Call 9990771857
Low Rate Call Girls in Triveni Complex Delhi Call 9990771857Low Rate Call Girls in Triveni Complex Delhi Call 9990771857
Low Rate Call Girls in Triveni Complex Delhi Call 9990771857
 
Call Girls In Sahibabad Ghaziabad ❤️8860477959 Low Rate Escorts Service In 24...
Call Girls In Sahibabad Ghaziabad ❤️8860477959 Low Rate Escorts Service In 24...Call Girls In Sahibabad Ghaziabad ❤️8860477959 Low Rate Escorts Service In 24...
Call Girls In Sahibabad Ghaziabad ❤️8860477959 Low Rate Escorts Service In 24...
 
Prestige Sector 94 at Noida E Brochure.pdf
Prestige Sector 94 at Noida E Brochure.pdfPrestige Sector 94 at Noida E Brochure.pdf
Prestige Sector 94 at Noida E Brochure.pdf
 
Brigade Neopolis Kokapet, Hyderabad E- Brochure
Brigade Neopolis Kokapet, Hyderabad E- BrochureBrigade Neopolis Kokapet, Hyderabad E- Brochure
Brigade Neopolis Kokapet, Hyderabad E- Brochure
 
Prestige Rainbow Waters Raidurgam, Gachibowli Hyderabad E- Brochure.pdf
Prestige Rainbow Waters Raidurgam, Gachibowli Hyderabad E- Brochure.pdfPrestige Rainbow Waters Raidurgam, Gachibowli Hyderabad E- Brochure.pdf
Prestige Rainbow Waters Raidurgam, Gachibowli Hyderabad E- Brochure.pdf
 
Namrata 7 Plumeria Drive Pimpri Chinchwad Pune Brochure.pdf
Namrata 7 Plumeria Drive Pimpri Chinchwad Pune Brochure.pdfNamrata 7 Plumeria Drive Pimpri Chinchwad Pune Brochure.pdf
Namrata 7 Plumeria Drive Pimpri Chinchwad Pune Brochure.pdf
 
SVN Live 4.22.24 Weekly Property Broadcast
SVN Live 4.22.24 Weekly Property BroadcastSVN Live 4.22.24 Weekly Property Broadcast
SVN Live 4.22.24 Weekly Property Broadcast
 
Call Girls in Inderpuri Delhi 💯Call Us 🔝8264348440🔝
Call Girls in Inderpuri Delhi 💯Call Us 🔝8264348440🔝Call Girls in Inderpuri Delhi 💯Call Us 🔝8264348440🔝
Call Girls in Inderpuri Delhi 💯Call Us 🔝8264348440🔝
 
Kohinoor Hinjewadi Phase 2 Pune | E-Brochure
Kohinoor Hinjewadi Phase 2 Pune | E-BrochureKohinoor Hinjewadi Phase 2 Pune | E-Brochure
Kohinoor Hinjewadi Phase 2 Pune | E-Brochure
 
MADHUGIRI FARM LAND BROCHURES (11)_compressed (1).pdf
MADHUGIRI FARM LAND BROCHURES (11)_compressed (1).pdfMADHUGIRI FARM LAND BROCHURES (11)_compressed (1).pdf
MADHUGIRI FARM LAND BROCHURES (11)_compressed (1).pdf
 
Call Girls in Mahavir Nagar whatsaap call US +919953056974
Call Girls in Mahavir Nagar  whatsaap call US  +919953056974Call Girls in Mahavir Nagar  whatsaap call US  +919953056974
Call Girls in Mahavir Nagar whatsaap call US +919953056974
 
Partner With the Golden Life Community for Single Women Over 55
Partner With the Golden Life Community for Single Women Over 55Partner With the Golden Life Community for Single Women Over 55
Partner With the Golden Life Community for Single Women Over 55
 
Call Girls In Peeragarhi, Delhi↫8447779280↬Call Girls in Peeragarhi Delhi NCR
Call Girls In Peeragarhi, Delhi↫8447779280↬Call Girls in Peeragarhi Delhi NCRCall Girls In Peeragarhi, Delhi↫8447779280↬Call Girls in Peeragarhi Delhi NCR
Call Girls In Peeragarhi, Delhi↫8447779280↬Call Girls in Peeragarhi Delhi NCR
 
Low Rate Call Girls in Lajpat Nagar Delhi Call 9990771857
Low Rate Call Girls in Lajpat Nagar Delhi Call 9990771857Low Rate Call Girls in Lajpat Nagar Delhi Call 9990771857
Low Rate Call Girls in Lajpat Nagar Delhi Call 9990771857
 
Call Girls in Pitampura Delhi 💯Call Us 🔝8264348440🔝
Call Girls in Pitampura Delhi 💯Call Us 🔝8264348440🔝Call Girls in Pitampura Delhi 💯Call Us 🔝8264348440🔝
Call Girls in Pitampura Delhi 💯Call Us 🔝8264348440🔝
 

San Francisco Market Focus Report May 2019

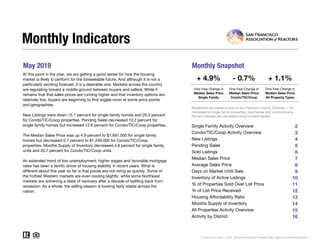
  • 1. May 2019 Monthly Snapshot One-Year Change in One-Year Change in Median Sales Price Single Family Median Sales Price Condo/TIC/Coop 2 3 4 5 6 7 8 9 10 11 12 13 14 15 16 Current as of June 11, 2019. All data from the San Francisco MLS. Report © 2019 ShowingTime. Condo/TIC/Coop Activity Overview Inventory of Active Listings % of Properties Sold Over List Price % of List Price Received Housing Affordability Ratio All Properties Activity Overview New Listings Pending Sales Sold Listings Median Sales Price Average Sales Price Days on Market Until Sale Activity by District Monthly Indicators + 4.9% - 0.7% + 1.1% One-Year Change in At this point in the year, we are getting a good sense for how the housing market is likely to perform for the foreseeable future. And although it is not a particularly exciting forecast, it is a desirable one. Markets across the country are regulating toward a middle ground between buyers and sellers. While it remains true that sales prices are running higher and that inventory options are relatively low, buyers are beginning to find wiggle room at some price points and geographies. New Listings were down 15.1 percent for single family homes and 20.3 percent for Condo/TIC/Coop properties. Pending Sales decreased 10.2 percent for single family homes but increased 12.8 percent for Condo/TIC/Coop properties. The Median Sales Price was up 4.9 percent to $1,697,500 for single family homes but decreased 0.7 percent to $1,249,000 for Condo/TIC/Coop properties. Months Supply of Inventory decreased 4.8 percent for single family units and 20.7 percent for Condo/TIC/Coop units. An extended trend of low unemployment, higher wages and favorable mortgage rates has been a terrific driver of housing stability in recent years. What is different about this year so far is that prices are not rising as quickly. Some of the hottest Western markets are even cooling slightly, while some Northeast markets are achieving a state of recovery after a decade of battling back from recession. As a whole, the selling season is looking fairly stable across the nation. Median Sales Price All Property Types Residential real estate activity in San Francisco County (Districts 1-10) composed of single-family properties, townhomes and condominiums. Percent changes are calculated using rounded figures. Single Family Activity Overview Months Supply of Inventory
  • 2. Single Family Activity Overview Key metrics by report month and for year-to-date (YTD) starting from the first of the year. Key Metrics Historical Sparkbars 5-2018 5-2019 Percent Change YTD 2018 YTD 2019 Percent Change - 10.8%1,085 844 + 0.4% $1,600,000 - 0.9% + 1.9% Pending Sales 275 247 - 10.2% - 3.3%942 911 New Listings 271 230 - 15.1% 1,216 Sold Listings 249 234 - 6.0% 841 Median Sales Price $1,618,888 $1,697,500 + 4.9% $1,615,000 27 + 22.7% $2,064,986 -- -- Days on Market 20 22 + 10.0% 22 Avg. Sales Price $2,020,490 $2,147,560 + 6.3% $2,025,614 Active Listings 405 373 - 7.9% -- % of Properties Sold Over List Price 84.7% 79.9% - 5.7% 79.3% 30 74.4% - 6.2% - 5.2% 31 + 3.3% 111.6%% of List Price Received 119.5% 113.5% - 5.0% 117.7% Current as of June 11, 2019. All data from the San Francisco MLS. Report © 2019 ShowingTime. | 2 Months Supply 2.1 2.0 - 4.8% -- -- -- Affordability Ratio 30 30 0.0% 5-2016 5-2017 5-2018 5-2019 5-2016 5-2017 5-2018 5-2019 5-2016 5-2017 5-2018 5-2019 5-2016 5-2017 5-2018 5-2019 5-2016 5-2017 5-2018 5-2019 5-2016 5-2017 5-2018 5-2019 5-2016 5-2017 5-2018 5-2019 5-2016 5-2017 5-2018 5-2019 5-2016 5-2017 5-2018 5-2019 5-2016 5-2017 5-2018 5-2019 5-2016 5-2017 5-2018 5-2019
  • 3. Condo/TIC/Coop Activity Overview Key metrics by report month and for year-to-date (YTD) starting from the first of the year. Key Metrics Historical Sparkbars 5-2018 5-2019 Percent Change YTD 2018 YTD 2019 Percent Change - 12.7% Pending Sales 297 335 + 12.8% 1,324 1,296 - 2.1% New Listings 370 295 - 20.3% 1,852 1,616 Sold Listings 312 329 + 5.4% 1,248 1,188 - 4.8% Median Sales Price $1,257,500 $1,249,000 - 0.7% $1,215,000 $1,200,000 - 1.2% - 0.9% 37 + 15.6% $1,334,135 -- -- Days on Market 27 29 + 7.4% 32 Avg. Sales Price $1,399,046 $1,340,145 - 4.2% $1,346,516 Active Listings 723 574 - 20.6% -- % of Properties Sold Over List Price 67.6% 65.3% - 3.4% 59.9% 46 56.6% - 5.5% - 1.7% 49 + 6.5% 105.1%% of List Price Received 108.4% 107.4% - 0.9% 106.9% Current as of June 11, 2019. All data from the San Francisco MLS. Report © 2019 ShowingTime. | 3 Months Supply 2.9 2.3 - 20.7% -- -- -- Affordability Ratio 44 47 + 6.8% 5-2016 5-2017 5-2018 5-2019 5-2016 5-2017 5-2018 5-2019 5-2016 5-2017 5-2018 5-2019 5-2016 5-2017 5-2018 5-2019 5-2016 5-2017 5-2018 5-2019 5-2016 5-2017 5-2018 5-2019 5-2016 5-2017 5-2018 5-2019 5-2016 5-2017 5-2018 5-2019 5-2016 5-2017 5-2018 5-2019 5-2016 5-2017 5-2018 5-2019 5-2016 5-2017 5-2018 5-2019
  • 4. New Listings New Listings Single Family Year-Over-Year Change Condo/TIC/ Coop Year-Over-Year Change Jun-2018 266 +11.8% 358 +14.4% Jul-2018 239 +13.3% 259 -5.5% Aug-2018 249 +16.4% 311 +6.1% Sep-2018 337 +12.0% 452 +3.0% Oct-2018 258 +7.9% 341 +3.6% Nov-2018 156 +7.6% 196 -6.2% Dec-2018 81 +3.8% 122 -5.4% Jan-2019 220 +17.0% 350 -5.1% Feb-2019 184 -11.5% 296 -16.9% Mar-2019 222 -20.1% 334 -11.9% Apr-2019 229 -15.5% 341 -9.8% May-2019 230 -15.1% 295 -20.3% 12-Month Avg 223 +1.1% 305 -4.8% Historical New Listings by Month Current as of June 11, 2019. All data from the San Francisco MLS. Report © 2019 ShowingTime. | 4 A count of the properties that have been newly listed on the market in a given month. 287 361 271 370 230 295 Single Family Condo/TIC/Coop May 0 100 200 300 400 500 600 700 1-2005 1-2006 1-2007 1-2008 1-2009 1-2010 1-2011 1-2012 1-2013 1-2014 1-2015 1-2016 1-2017 1-2018 1-2019 Single Family Condo/TIC/Coop 1,175 1,656 1,216 1,852 1,085 1,616 Single Family Condo/TIC/Coop Year to Date 2017 2018 2019 - 20.3%+ 2.5%- 15.1%- 5.6% + 11.8%- 10.8%+ 3.5% - 12.7% 2017 2018 2019 2017 2018 2019 2017 2018 2019 + 11.7% - 3.9% - 5.6%- 3.5%
  • 5. Pending Sales Pending Sales Single Family Year-Over-Year Change Condo/TIC/ Coop Year-Over-Year Change Jun-2018 203 -18.5% 302 +4.1% Jul-2018 165 -4.6% 247 +18.2% Aug-2018 172 -16.5% 232 +9.4% Sep-2018 193 -5.4% 219 -10.2% Oct-2018 251 +1.2% 291 -11.8% Nov-2018 187 -5.6% 222 -5.1% Dec-2018 121 +13.1% 147 -23.4% Jan-2019 89 +2.3% 121 -32.8% Feb-2019 145 -8.2% 228 +1.8% Mar-2019 209 -2.8% 298 -11.3% Apr-2019 221 +6.8% 314 +9.4% May-2019 247 -10.2% 335 +12.8% 12-Month Avg 184 -5.3% 246 -2.6% Historical Pending Sales by Month Current as of June 11, 2019. All data from the San Francisco MLS. Report © 2019 ShowingTime. | 5 A count of the properties on which offers have been accepted in a given month. 240 306 275 297 247 335 Single Family Condo/TIC/Coop May 0 100 200 300 400 1-2005 1-2006 1-2007 1-2008 1-2009 1-2010 1-2011 1-2012 1-2013 1-2014 1-2015 1-2016 1-2017 1-2018 1-2019 Single Family Condo/TIC/Coop 879 1,189 942 1,324 911 1,296 Single Family Condo/TIC/Coop Year to Date 2017 2018 2019 + 12.8%- 2.9%- 10.2%+ 14.6% + 11.4%- 3.3%+ 7.2% - 2.1% 2017 2018 2019 2017 2018 2019 2017 2018 2019 - 4.0% - 0.3% + 5.7%+ 7.4%
  • 6. Sold Listings Sold Listings Single Family Year-Over-Year Change Condo/TIC/ Coop Year-Over-Year Change Jun-2018 231 +0.4% 303 -6.5% Jul-2018 192 -8.6% 273 +14.2% Aug-2018 192 -9.9% 260 +18.7% Sep-2018 146 -17.5% 183 +4.6% Oct-2018 246 +5.1% 293 -5.8% Nov-2018 220 -10.2% 264 -5.0% Dec-2018 160 +7.4% 194 -22.4% Jan-2019 100 +5.3% 114 -23.5% Feb-2019 113 +5.6% 164 -18.8% Mar-2019 171 -14.5% 263 -9.0% Apr-2019 226 +18.9% 318 +7.4% May-2019 234 -6.0% 329 +5.4% 12-Month Avg 186 -3.0% 247 -2.8% Historical Sold Listings by Month Current as of June 11, 2019. All data from the San Francisco MLS. Report © 2019 ShowingTime. | 6 A count of the actual sales that closed in a given month. 218 272 249 312 234 329 Single Family Condo/TIC/Coop May 0 100 200 300 400 1-2005 1-2006 1-2007 1-2008 1-2009 1-2010 1-2011 1-2012 1-2013 1-2014 1-2015 1-2016 1-2017 1-2018 1-2019 Single Family Condo/TIC/Coop 811 1,098 841 1,248 844 1,188 Single Family Condo/TIC/Coop Year to Date 2017 2018 2019 + 5.4%+ 14.7%- 6.0%+ 14.2% + 13.7%+ 0.4%+ 3.7% - 4.8% 2017 2018 2019 2017 2018 2019 2017 2018 2019 + 9.0% + 4.9% + 4.8%+ 5.4%
  • 7. Median Sales Price Median Sales Price Single Family Year-Over-Year Change Condo/TIC/ Coop Year-Over-Year Change Jun-2018 $1,625,000 +11.2% $1,170,000 +4.0% Jul-2018 $1,626,250 +16.2% $1,150,000 0.0% Aug-2018 $1,544,000 +12.3% $1,234,400 +5.1% Sep-2018 $1,500,000 +13.6% $1,150,000 +5.0% Oct-2018 $1,600,000 +1.6% $1,215,000 +6.6% Nov-2018 $1,427,500 -4.5% $1,193,625 -3.5% Dec-2018 $1,492,500 +2.9% $1,170,000 +4.5% Jan-2019 $1,389,000 +4.4% $1,040,000 -5.5% Feb-2019 $1,500,000 -11.8% $1,130,000 +4.1% Mar-2019 $1,650,000 -2.2% $1,250,000 0.0% Apr-2019 $1,612,500 -2.2% $1,222,500 -2.2% May-2019 $1,697,500 +4.9% $1,249,000 -0.7% 12-Month Avg* $1,575,000 +5.0% $1,200,000 +2.1% Historical Median Sales Price by Month * Median Sales Price for all properties from June 2018 through May 2019. This is not the average of the individual figures above. Current as of June 11, 2019. All data from the San Francisco MLS. Report © 2019 ShowingTime. | 7 Point at which half of the sales sold for more and half sold for less, not accounting for seller concessions, in a given month. $1,475,000 $1,169,044 $1,618,888 $1,257,500 $1,697,500 $1,249,000 Single Family Condo/TIC/Coop May $400,000 $600,000 $800,000 $1,000,000 $1,200,000 $1,400,000 $1,600,000 $1,800,000 1-2005 1-2006 1-2007 1-2008 1-2009 1-2010 1-2011 1-2012 1-2013 1-2014 1-2015 1-2016 1-2017 1-2018 1-2019 Single Family Condo/TIC/Coop $1,360,666 $1,129,125 $1,615,000 $1,215,000 $1,600,000 $1,200,000 Single Family Condo/TIC/Coop Year to Date 2017 2018 2019 - 0.7%+ 7.6%+ 4.9%+ 9.8% + 7.6%- 0.9%+ 18.7% - 1.2% 2017 2018 2019 2017 2018 2019 2017 2018 2019 + 9.3% + 0.8% + 2.6%+ 8.0%
  • 8. Average Sales Price Avg. Sales Price Single Family Year-Over-Year Change Condo/TIC/ Coop Year-Over-Year Change Jun-2018 $1,943,346 +12.5% $1,337,494 -1.0% Jul-2018 $1,969,483 +13.3% $1,242,275 -0.1% Aug-2018 $1,834,962 +17.6% $1,347,161 +6.1% Sep-2018 $1,826,997 +13.4% $1,255,936 +3.2% Oct-2018 $2,160,394 +7.9% $1,343,310 +5.3% Nov-2018 $1,864,335 +6.2% $1,263,347 -8.9% Dec-2018 $1,786,072 -6.4% $1,329,973 +5.2% Jan-2019 $1,751,963 -2.0% $1,177,310 -10.9% Feb-2019 $1,871,058 -11.2% $1,363,140 +7.8% Mar-2019 $2,037,898 +4.5% $1,341,515 -2.2% Apr-2019 $2,235,456 +2.3% $1,363,076 +2.1% May-2019 $2,147,560 +6.3% $1,340,145 -4.2% 12-Month Avg* $1,979,533 +6.7% $1,316,626 +0.1% Historical Average Sales Price by Month * Avg. Sales Price for all properties from June 2018 through May 2019. This is not the average of the individual figures above. Current as of June 11, 2019. All data from the San Francisco MLS. Report © 2019 ShowingTime. | 8 Average sales price for all closed sales, not accounting for seller concessions, in a given month. $1,835,738 $1,346,544 $2,020,490 $1,399,046 $2,147,560 $1,340,145 Single Family Condo/TIC/Coop May $500,000 $1,000,000 $1,500,000 $2,000,000 $2,500,000 1-2005 1-2006 1-2007 1-2008 1-2009 1-2010 1-2011 1-2012 1-2013 1-2014 1-2015 1-2016 1-2017 1-2018 1-2019 Single Family Condo/TIC/Coop $1,811,450 $1,295,754 $2,025,614 $1,346,516 $2,064,986 $1,334,135 Single Family Condo/TIC/Coop Year to Date 2017 2018 2019 - 4.2%+ 3.9%+ 6.3%+ 10.1% + 3.9%+ 1.9%+ 11.8% - 0.9% 2017 2018 2019 2017 2018 2019 2017 2018 2019 + 12.4% + 7.3% + 2.6%+ 6.1%
  • 9. Days on Market Until Sale Days on Market Single Family Year-Over-Year Change Condo/TIC/ Coop Year-Over-Year Change Jun-2018 18 -33.3% 27 -27.0% Jul-2018 21 -12.5% 31 -6.1% Aug-2018 22 -18.5% 36 -12.2% Sep-2018 23 -17.9% 30 -28.6% Oct-2018 24 +9.1% 27 -12.9% Nov-2018 26 0.0% 38 +8.6% Dec-2018 33 +17.9% 44 -2.2% Jan-2019 39 +18.2% 55 0.0% Feb-2019 29 +31.8% 40 +8.1% Mar-2019 26 +18.2% 35 +34.6% Apr-2019 26 +44.4% 38 +46.2% May-2019 22 +10.0% 29 +7.4% 12-Month Avg* 25 +2.0% 34 -1.6% Historical Days on Market Until Sale by Month * Days on Market for all properties from June 2018 through May 2019. This is not the average of the individual figures above. Current as of June 11, 2019. All data from the San Francisco MLS. Report © 2019 ShowingTime. | 9 Average number of days between when a property is listed and when an offer is accepted in a given month. 24 33 20 27 22 29 Single Family Condo/TIC/Coop May 0 20 40 60 80 100 120 1-2005 1-2006 1-2007 1-2008 1-2009 1-2010 1-2011 1-2012 1-2013 1-2014 1-2015 1-2016 1-2017 1-2018 1-2019 Single Family Condo/TIC/Coop 30 37 22 32 27 37 Single Family Condo/TIC/Coop Year to Date 2017 2018 2019 + 7.4%- 18.2%+ 10.0%- 16.7% - 13.5%+ 22.7%- 26.7% + 15.6% 2017 2018 2019 2017 2018 2019 2017 2018 2019 - 7.7% 0.0% + 5.7%0.0%
  • 10. Inventory of Active Listings Active Listings Single Family Year-Over-Year Change Condo/TIC/ Coop Year-Over-Year Change Jun-2018 431 +12.2% 715 +16.4% Jul-2018 463 +18.1% 654 +8.5% Aug-2018 490 +32.8% 667 +9.0% Sep-2018 590 +35.9% 845 +11.8% Oct-2018 539 +33.7% 830 +20.6% Nov-2018 458 +41.4% 709 +18.8% Dec-2018 322 +43.8% 502 +21.0% Jan-2019 437 +37.4% 675 +16.4% Feb-2019 444 +26.5% 695 +5.9% Mar-2019 434 +9.9% 674 +3.1% Apr-2019 425 -1.6% 656 -6.7% May-2019 373 -7.9% 574 -20.6% 12-Month Avg* 451 +22.0% 683 +7.8% Historical Inventory of Active Listings by Month * Active Listings for all properties from June 2018 through May 2019. This is not the average of the individual figures above. Current as of June 11, 2019. All data from the San Francisco MLS. Report © 2019 ShowingTime. | 10 The number of properties available for sale in active status at the end of a given month. 429 661 405 723 373 574 Single Family Condo/TIC/Coop May 0 250 500 750 1,000 1,250 1,500 1-2005 1-2006 1-2007 1-2008 1-2009 1-2010 1-2011 1-2012 1-2013 1-2014 1-2015 1-2016 1-2017 1-2018 1-2019 Single Family Condo/TIC/Coop 2017 2018 2019 - 20.6%+ 9.4%- 7.9%- 5.6% 2017 2018 2019 - 5.7% - 7.9%
  • 11. % of Properties Sold Over List Price % of Properties Sold Over List Price Single Family Year-Over-Year Change Condo/TIC/ Coop Year-Over-Year Change Jun-2018 88.3% +10.4% 68.3% +16.6% Jul-2018 85.4% +4.9% 63.4% +1.0% Aug-2018 80.2% +2.3% 57.7% -4.9% Sep-2018 81.5% -5.1% 63.4% +19.4% Oct-2018 82.5% -1.6% 68.3% +2.6% Nov-2018 73.6% -8.9% 54.5% -6.5% Dec-2018 68.1% -7.0% 45.9% -15.6% Jan-2019 60.0% -14.9% 41.2% +22.6% Feb-2019 77.9% -3.1% 53.0% -10.0% Mar-2019 73.7% -4.9% 56.3% -4.9% Apr-2019 73.9% -5.1% 55.3% -17.0% May-2019 79.9% -5.7% 65.3% -3.4% 12-Month Avg 78.1% -2.6% 59.2% -0.9% Historical % of Properties Sold Over List Price by Month * % of Properties Sold Over List Price for all properties from June 2018 through May 2019. This is not the average of the individual figures above. Current as of June 11, 2019. All data from the San Francisco MLS. Report © 2019 ShowingTime. | 11 Percentage found when dividing the number of properties sold by properties sold over its original list price, not accounting for seller concessions. 78.9% 61.0% 84.7% 67.6% 79.9% 65.3% Single Family Condo/TIC/Coop May 0.0% 20.0% 40.0% 60.0% 80.0% 100.0% 1-2005 1-2006 1-2007 1-2008 1-2009 1-2010 1-2011 1-2012 1-2013 1-2014 1-2015 1-2016 1-2017 1-2018 1-2019 Single Family Condo/TIC/Coop 75.3% 57.9% 79.3% 59.9% 74.4% 56.6% Single Family Condo/TIC/Coop Year to Date 2017 2018 2019 - 3.4%+ 10.8%- 5.7%+ 7.4% + 3.5%- 6.2%+ 5.3% - 5.5% 2017 2018 2019 2017 2018 2019 2017 2018 2019 - 0.8% - 3.8% - 7.4%- 9.5%
  • 12. % of List Price Received % of List Price Received Single Family Year-Over-Year Change Condo/TIC/ Coop Year-Over-Year Change Jun-2018 120.1% +2.8% 107.3% +1.4% Jul-2018 117.2% +0.1% 107.1% +1.0% Aug-2018 114.7% -0.6% 105.6% -0.1% Sep-2018 115.4% -0.8% 106.5% +1.6% Oct-2018 114.0% -1.4% 107.7% +1.0% Nov-2018 111.2% -3.7% 104.1% -0.4% Dec-2018 110.5% -3.3% 102.1% -1.6% Jan-2019 106.0% -5.6% 101.0% -0.7% Feb-2019 112.6% -2.8% 104.2% -0.9% Mar-2019 110.6% -5.9% 104.7% -2.2% Apr-2019 112.4% -5.8% 104.9% -3.7% May-2019 113.5% -5.0% 107.4% -0.9% 12-Month Avg* 113.6% -2.5% 105.6% -0.3% Historical % of List Price Received by Month * % of List Price Received for all properties from June 2018 through May 2019. This is not the average of the individual figures above. Current as of June 11, 2019. All data from the San Francisco MLS. Report © 2019 ShowingTime. | 12 Percentage found when dividing a property’s sales price by its most recent list price, then taking the average for all properties sold in a given month, not accounting for seller concessions. 115.3% 105.4% 119.5% 108.4% 113.5% 107.4% Single Family Condo/TIC/Coop May 113.5% 104.4% 117.7% 106.9% 111.6% 105.1% Single Family Condo/TIC/Coop Year to Date 90.0% 100.0% 110.0% 120.0% 130.0% 1-2005 1-2006 1-2007 1-2008 1-2009 1-2010 1-2011 1-2012 1-2013 1-2014 1-2015 1-2016 1-2017 1-2018 1-2019 Single Family Condo/TIC/Coop 2017 2018 2019 - 0.9%+ 2.8%- 5.0%+ 3.6% 2017 2018 2019 + 0.1% - 0.7% 2017 2018 2019 - 1.7%+ 2.4%- 5.2%+ 3.7% 2017 2018 2019 - 0.2% - 1.1%
  • 13. Housing Affordability Ratio Affordability Ratio Single Family Year-Over-Year Change Condo/TIC/ Coop Year-Over-Year Change Jun-2018 30 -14.3% 48 -9.4% Jul-2018 30 -18.9% 49 -5.8% Aug-2018 31 -18.4% 45 -13.5% Sep-2018 31 -20.5% 47 -14.5% Oct-2018 28 -12.5% 41 -21.2% Nov-2018 32 -8.6% 43 -12.2% Dec-2018 33 -5.7% 48 -9.4% Jan-2019 35 -5.4% 54 +3.8% Feb-2019 33 +13.8% 51 -3.8% Mar-2019 30 +3.4% 46 0.0% Apr-2019 31 +6.9% 48 +6.7% May-2019 30 0.0% 47 +6.8% 12-Month Avg* 31 -11.4% 34 -6.9% Historical Housing Affordability Ratio by Month * Affordability Ratio for all properties from June 2018 through May 2019. This is not the average of the individual figures above. Current as of June 11, 2019. All data from the San Francisco MLS. Report © 2019 ShowingTime. | 13 This index measures housing affordability for the region. For example, an index of 120 means the median household income is 120% of what is necessary to qualify for the median-priced home under prevailing interest rates. A higher number means greater affordability. 35 51 30 44 30 47 Single Family Condo/TIC/Coop May 20 40 60 80 100 1-2005 1-2006 1-2007 1-2008 1-2009 1-2010 1-2011 1-2012 1-2013 1-2014 1-2015 1-2016 1-2017 1-2018 1-2019 Single Family Condo/TIC/Coop 2017 2018 2019 + 6.8%- 13.7%0.0%- 14.3% 2017 2018 2019 - 10.3% - 8.9% 38 53 30 46 31 49 Single Family Condo/TIC/Coop Year to Date 2017 2018 2019 + 6.5%- 13.2%+ 3.3%- 21.1% 2017 2018 2019 - 2.6% - 5.4%
  • 14. Months Supply of Inventory Months Supply Single Family Year-Over-Year Change Condo/TIC/ Coop Year-Over-Year Change Jun-2018 2.3 +9.5% 2.8 +7.7% Jul-2018 2.4 +14.3% 2.5 -3.8% Aug-2018 2.6 +30.0% 2.6 0.0% Sep-2018 3.2 +39.1% 3.3 +3.1% Oct-2018 2.9 +38.1% 3.3 +17.9% Nov-2018 2.5 +47.1% 2.8 +12.0% Dec-2018 1.7 +41.7% 2.0 +17.6% Jan-2019 2.3 +35.3% 2.8 +16.7% Feb-2019 2.4 +33.3% 2.8 +3.7% Mar-2019 2.3 +9.5% 2.8 +7.7% Apr-2019 2.3 0.0% 2.7 -3.6% May-2019 2.0 -4.8% 2.3 -20.7% 12-Month Avg* 2.4 +24.0% 2.7 +4.8% Historical Months Supply of Inventory by Month * Months Supply for all properties from June 2018 through May 2019. This is not the average of the individual figures above. Current as of June 11, 2019. All data from the San Francisco MLS. Report © 2019 ShowingTime. | 14 The inventory of homes for sale at the end of a given month, divided by the average monthly pending sales from the last 12 months. 2.3 2.8 2.1 2.9 2.0 2.3 Single Family Condo/TIC/Coop May 0.0 2.0 4.0 6.0 8.0 10.0 1-2005 1-2006 1-2007 1-2008 1-2009 1-2010 1-2011 1-2012 1-2013 1-2014 1-2015 1-2016 1-2017 1-2018 1-2019 Single Family Condo/TIC/Coop 2017 2018 2019 - 20.7%+ 3.6%- 4.8%- 8.7% 2017 2018 2019 - 4.2% - 9.7%
  • 15. All Properties Activity Overview Key metrics by report month and for year-to-date (YTD) starting from the first of the year. Key Metrics Historical Sparkbars 5-2018 5-2019 Percent Change YTD 2018 YTD 2019 Percent Change - 12.0% Pending Sales 572 582 + 1.7% 2,266 2,207 - 2.6% New Listings 641 525 - 18.1% 3,068 2,701 Sold Listings 561 563 + 0.4% 2,089 2,032 - 2.7% Median Sales Price $1,385,000 $1,400,000 + 1.1% $1,360,000 $1,355,500 - 0.3% + 1.1% 33 + 17.9% $1,637,697 -- -- Days on Market 24 26 + 8.3% 28 Avg. Sales Price $1,674,874 $1,675,731 + 0.1% $1,619,911 Active Listings 1,128 947 - 16.0% -- % of Properties Sold Over List Price 75.2% 71.4% - 5.1% 67.7% 35 64.0% - 5.5% - 3.1% 36 + 2.9% 107.8%% of List Price Received 113.3% 109.9% - 3.0% 111.2% Current as of June 11, 2019. All data from the San Francisco MLS. Report © 2019 ShowingTime. | 15 Months Supply 2.5 2.2 - 12.0% -- -- -- Affordability Ratio 34 35 + 2.9% 5-2016 5-2017 5-2018 5-2019 5-2016 5-2017 5-2018 5-2019 5-2016 5-2017 5-2018 5-2019 5-2016 5-2017 5-2018 5-2019 5-2016 5-2017 5-2018 5-2019 5-2016 5-2017 5-2018 5-2019 5-2016 5-2017 5-2018 5-2019 5-2016 5-2017 5-2018 5-2019 5-2016 5-2017 5-2018 5-2019 5-2016 5-2017 5-2018 5-2019 5-2016 5-2017 5-2018 5-2019
  • 16. Activity by District SF District 1: Northwest (Sea Cliff, Lake, Jordan Park / Laurel Heights, Outer Richmond, Central Richmond, Inner Richmond, Lone Mountain) SF District 2: Central West (Outer Sunset, Central Sunset, Inner Sunset, Outer Parkside, Parkside, Inner Parkside, Golden Gate Heights) SF District 3: Southwest (Pine Lake Park, Lake Shore, Merced Manor, Stonestown, Lakeside, Merced Heights, Ingleside, Ingleside Heights, Oceanview) SF District 4: Twin Peaks W (Forest Hill (& Ext), W Portal, St Francis Wd, Balboa Terr, Mt Dav Manor, Ingleside Terr, Monterey Hts, Wstwd Pk & H'lnds, Shrwd Fst, Miraloma Pk, Dmnd Hts, Mdtwn Terr) SF District 5: Central (Haight Ashbury, Cole Vly / Prnssus Hts, Clarndn Hts, Corona Hts, Twin Pks, Glen Pk, Noe Vly, Eureka Vly / Dolores Hts, Mission Dolores, Duboce Trngl, Buena Vista / Ashbury Hts) SF District 6: Central North (Lower Pacific Heights, Anza Vista, Western Addition, North Panhandle, Alamo Square, Hayes Valley) SF District 7: North (Marina, Cow Hollow, Presidio Heights, Pacific Heights) SF District 8: Northeast (North Waterfront, North Beach, Russian Hill, Telegraph Hill, Nob Hill, Financial District / Barbary Coast, Downtown, Van Ness / Civic Center, Tenderloin) SF District 9: Central East (Yerba Buena, South Beach, South of Market, Mission Bay, Inner Mission, Potrero Hill, Central Waterfront / Dogpatch, Bernal Heights) SF District 10: Southeast (Outer Mission, Mission Terr, Excelsior, Portola, Bayview, Silver Terr, Hunters Pt, Candlestick Pt, Bayview Hts, Little Hollywood, Visitation Vly, Crocker Amazon) 5-2018 5-2019 + / – 5-2018 5-2019 + / – 5-2018 5-2019 + / – 5-2018 5-2019 + / – 5-2018 5-2019 + / – Single Family 1 SF District 1 31 28 -9.7% 27 22 -18.5% $2,100,000 $2,520,000 +20.0% 25 23 -8.0% 2.1 1.8 -14.3% 2 SF District 2 46 47 +2.2% 41 43 +4.9% $1,600,000 $1,695,000 +5.9% 15 19 +26.7% 1.3 1.5 +15.4% 3 SF District 3 28 26 -7.1% 23 11 -52.2% $1,228,200 $1,305,000 +6.3% 23 16 -30.4% 2.0 2.2 +10.0% 4 SF District 4 50 29 -42.0% 43 35 -18.6% $1,850,000 $1,685,000 -8.9% 17 21 +23.5% 1.8 1.1 -38.9% 5 SF District 5 73 56 -23.3% 26 28 +7.7% $2,325,000 $2,875,000 +23.7% 19 28 +47.4% 2.8 2.1 -25.0% 6 SF District 6 11 14 +27.3% 3 4 +33.3% $4,300,000 $3,177,500 -26.1% 31 22 -29.0% 3.4 3.4 0.0% 7 SF District 7 34 30 -11.8% 9 15 +66.7% $6,050,000 $4,150,000 -31.4% 23 43 +87.0% 3.8 3.5 -7.9% 8 SF District 8 12 18 +50.0% 3 5 +66.7% $3,564,875 $4,600,000 +29.0% 82 27 -67.1% 4.5 7.9 +75.6% 9 SF District 9 57 53 -7.0% 27 28 +3.7% $1,630,000 $1,505,000 -7.7% 18 15 -16.7% 2.6 2.7 +3.8% 10 SF District 10 63 72 +14.3% 47 43 -8.5% $1,100,000 $1,150,000 +4.5% 22 23 +4.5% 1.5 2.0 +33.3% Condo/TIC/Coop 1 SF District 1 25 22 -12.0% 16 14 -12.5% $1,117,500 $1,447,500 +29.5% 16 27 +68.8% 2.0 1.6 -20.0% 2 SF District 2 5 5 0.0% 4 4 0.0% $1,242,500 $1,315,000 +5.8% 8 18 +125.0% 1.4 1.3 -7.1% 3 SF District 3 5 6 +20.0% 3 5 +66.7% $1,380,000 $1,220,000 -11.6% 31 50 +61.3% 1.9 1.9 0.0% 4 SF District 4 17 7 -58.8% 5 13 +160.0% $760,000 $879,000 +15.7% 13 40 +207.7% 4.1 1.3 -68.3% 5 SF District 5 95 49 -48.4% 47 51 +8.5% $1,500,000 $1,455,000 -3.0% 18 16 -11.1% 2.7 1.3 -51.9% 6 SF District 6 65 52 -20.0% 31 34 +9.7% $1,329,000 $1,187,500 -10.6% 36 19 -47.2% 2.5 2.4 -4.0% 7 SF District 7 65 39 -40.0% 31 26 -16.1% $1,555,555 $2,125,000 +36.6% 16 33 +106.3% 2.6 1.6 -38.5% 8 SF District 8 168 145 -13.7% 41 46 +12.2% $1,130,000 $1,090,000 -3.5% 32 40 +25.0% 4.1 3.4 -17.1% 9 SF District 9 254 212 -16.5% 126 129 +2.4% $1,250,000 $1,185,000 -5.2% 31 31 0.0% 2.7 2.4 -11.1% 10 SF District 10 24 37 +54.2% 8 7 -12.5% $690,250 $800,000 +15.9% 46 27 -41.3% 2.9 6.3 +117.2% Key metrics by report month for the districts of San Fransisco. Current as of June 11, 2019. All data from the San Francisco MLS. Report © 2019 ShowingTime. | 16 Active Listings Sold Listings Median Sales Price Days on Market Months Supply