SlideShare a Scribd company logo
1 of 16
Download to read offline
April 2019 Monthly Snapshot
One-Year Change in One-Year Change in
Median Sales Price
Single Family
Median Sales Price
Condo/TIC/Coop
2
3
4
5
6
7
8
9
10
11
12
13
14
15
16
Monthly Indicators
- 0.9% - 2.4% + 1.3%
One-Year Change in
For much of the country, the first quarter of 2019 provided several disruptive
weather patterns that contributed to less foot traffic toward potential home
sales. Coupled with low affordability, higher prices and an inventory situation in
its infancy of recovering from record lows – not to mention several more days of
wintry weather in April – slower sales persisted across most residential real
estate markets. However, buyers are beginning to return in force this spring. For
well-priced homes in desirable locations, competition is fierce.
New Listings were down 26.7 percent for single family homes and 22.8 percent
for Condo/TIC/Coop properties. Pending Sales increased 4.3 percent for single
family homes and 8.0 percent for Condo/TIC/Coop properties.
The Median Sales Price was down 0.9 percent to $1,632,500 for single family
homes and 2.4 percent to $1,220,000 for Condo/TIC/Coop properties. Months
Supply of Inventory decreased 13.0 percent for single family units and 14.3
percent for Condo/TIC/Coop units.
The national unemployment rate dropped to 3.6 percent during April 2019, the
lowest level since 1969. A historically low unemployment rate can provide
reassurance to wary consumers. But in order for sales to increase on a grand
scale, buyers will need more spending power, or sellers will need to reduce
prices to land where buyers are most active. Neither situation is likely to occur
in 2019, yet inventory is straining to keep pace in the most competitive price
ranges.
Median Sales Price
All Property Types
Residential real estate activity in San Francisco County (Districts 1-10)
composed of single-family properties, townhomes and condominiums.
Percent changes are calculated using rounded figures.
Single Family Activity Overview
Months Supply of Inventory
Current as of May 11, 2019. All data from the San Francisco MLS. Report © 2019 ShowingTime.
Condo/TIC/Coop Activity Overview
Inventory of Active Listings
% of Properties Sold Over List Price
% of List Price Received
Housing Affordability Ratio
All Properties Activity Overview
New Listings
Pending Sales
Sold Listings
Median Sales Price
Average Sales Price
Days on Market Until Sale
Activity by District
Single Family Activity Overview
Key metrics by report month and for year-to-date (YTD) starting from the first of the year.
Key Metrics Historical Sparkbars 4-2018 4-2019 Percent Change YTD 2018 YTD 2019 Percent Change
Current as of May 11, 2019. All data from the San Francisco MLS. Report © 2019 ShowingTime. | 2
Months Supply 2.3 2.0 - 13.0% -- -- --
Affordability Ratio 29 31 + 6.9%
% of List Price Received 119.3% 112.6% - 5.6% 116.9%
30
72.3% - 6.1%
- 5.0%
32 + 6.7%
111.0%
% of Properties Sold Over List Price 77.9% 73.9% - 5.1% 77.0%
Active Listings 430 372 - 13.5% --
Avg. Sales Price $2,185,545 $2,258,069 + 3.3% $2,027,769
Days on Market 18 27 + 50.0% 23 29 + 26.1%
$2,038,813
-- --
Median Sales Price $1,648,000 $1,632,500 - 0.9% $1,611,000
Sold Listings 190 218 + 14.7% 592
New Listings 270 198 - 26.7% 943
Pending Sales 207 216 + 4.3% - 1.2%667 659
- 14.5%806
602 + 1.7%
$1,585,000 - 1.6%
+ 0.5%
4-2016 4-2017 4-2018 4-2019
4-2016 4-2017 4-2018 4-2019
4-2016 4-2017 4-2018 4-2019
4-2016 4-2017 4-2018 4-2019
4-2016 4-2017 4-2018 4-2019
4-2016 4-2017 4-2018 4-2019
4-2016 4-2017 4-2018 4-2019
4-2016 4-2017 4-2018 4-2019
4-2016 4-2017 4-2018 4-2019
4-2016 4-2017 4-2018 4-2019
4-2016 4-2017 4-2018 4-2019
Condo/TIC/Coop Activity Overview
Key metrics by report month and for year-to-date (YTD) starting from the first of the year.
Key Metrics Historical Sparkbars 4-2018 4-2019 Percent Change YTD 2018 YTD 2019 Percent Change
Current as of May 11, 2019. All data from the San Francisco MLS. Report © 2019 ShowingTime. | 3
Months Supply 2.8 2.4 - 14.3% -- -- --
Affordability Ratio 45 48 + 6.7%
% of List Price Received 108.9% 104.9% - 3.7% 106.4%
47
53.4% - 7.0%
- 2.1%
49 + 4.3%
104.2%
% of Properties Sold Over List Price 66.6% 55.3% - 17.0% 57.4%
Active Listings 703 586 - 16.6% --
Avg. Sales Price $1,335,639 $1,355,657 + 1.5% $1,329,007
Days on Market 26 39 + 50.0% 33
$1,190,000 - 0.8%
+ 0.1%
40 + 21.2%
$1,330,238
-- --
Sold Listings 296 313 + 5.7% 936 852 - 9.0%
Median Sales Price $1,250,000 $1,220,000 - 2.4% $1,200,000
- 15.6%
Pending Sales 287 310 + 8.0% 1,027 958 - 6.7%
New Listings 378 292 - 22.8% 1,482 1,251
4-2016 4-2017 4-2018 4-2019
4-2016 4-2017 4-2018 4-2019
4-2016 4-2017 4-2018 4-2019
4-2016 4-2017 4-2018 4-2019
4-2016 4-2017 4-2018 4-2019
4-2016 4-2017 4-2018 4-2019
4-2016 4-2017 4-2018 4-2019
4-2016 4-2017 4-2018 4-2019
4-2016 4-2017 4-2018 4-2019
4-2016 4-2017 4-2018 4-2019
4-2016 4-2017 4-2018 4-2019
New Listings
New Listings
Single
Family
Year-Over-Year
Change
Condo/TIC/
Coop
Year-Over-Year
Change
May-2018 271 -5.6% 370 +2.5%
Jun-2018 266 +11.8% 357 +14.1%
Jul-2018 239 +13.3% 259 -5.5%
Aug-2018 248 +15.9% 311 +6.1%
Sep-2018 337 +12.0% 451 +2.7%
Oct-2018 258 +7.9% 342 +4.0%
Nov-2018 156 +7.6% 193 -7.7%
Dec-2018 80 +2.6% 122 -5.4%
Jan-2019 219 +16.5% 348 -5.7%
Feb-2019 179 -13.9% 289 -18.8%
Mar-2019 210 -24.2% 322 -15.0%
Apr-2019 198 -26.7% 292 -22.8%
12-Month Avg 222 +0.2% 305 -4.5%
Historical New Listings by Month
Current as of May 11, 2019. All data from the San Francisco MLS. Report © 2019 ShowingTime. | 4
A count of the properties that have been newly listed on the market in a given month.
247
286
270
378
198
292
Single Family Condo/TIC/Coop
April
0
100
200
300
400
500
600
700
1-2005 1-2006 1-2007 1-2008 1-2009 1-2010 1-2011 1-2012 1-2013 1-2014 1-2015 1-2016 1-2017 1-2018 1-2019
Single Family Condo/TIC/Coop
888
1,295
943
1,482
806
1,251
Single Family Condo/TIC/Coop
Year to Date
2017 2018 2019
- 22.8%+ 32.2%- 26.7%+ 9.3% + 14.4%- 14.5%+ 6.2% - 15.6%
2017 2018 2019 2017 2018 2019 2017 2018 2019
- 12.7% - 8.1% - 6.2%- 23.1%
Pending Sales
Pending Sales
Single
Family
Year-Over-Year
Change
Condo/TIC/
Coop
Year-Over-Year
Change
May-2018 275 +14.6% 297 -2.9%
Jun-2018 203 -18.5% 302 +4.1%
Jul-2018 165 -4.6% 247 +18.2%
Aug-2018 173 -16.0% 232 +9.4%
Sep-2018 193 -5.4% 219 -10.2%
Oct-2018 251 +1.2% 291 -11.8%
Nov-2018 187 -5.6% 222 -5.1%
Dec-2018 121 +13.1% 147 -23.4%
Jan-2019 89 +2.3% 123 -31.7%
Feb-2019 145 -8.2% 228 +1.8%
Mar-2019 209 -2.8% 297 -11.6%
Apr-2019 216 +4.3% 310 +8.0%
12-Month Avg 186 -2.8% 243 -4.2%
Historical Pending Sales by Month
A count of the properties on which offers have been accepted in a given month.
Current as of May 11, 2019. All data from the San Francisco MLS. Report © 2019 ShowingTime. | 5
198
225
207
287
216
310
Single Family Condo/TIC/Coop
April
0
100
200
300
400
1-2005 1-2006 1-2007 1-2008 1-2009 1-2010 1-2011 1-2012 1-2013 1-2014 1-2015 1-2016 1-2017 1-2018 1-2019
Single Family Condo/TIC/Coop
639
883
667
1,027
659
958
Single Family Condo/TIC/Coop
Year to Date
2017 2018 2019
+ 8.0%+ 27.6%+ 4.3%+ 4.5% + 16.3%- 1.2%+ 4.4% - 6.7%
2017 2018 2019 2017 2018 2019 2017 2018 2019
- 7.5% + 1.1% + 5.1%- 7.8%
Sold Listings
Sold Listings
Single
Family
Year-Over-Year
Change
Condo/TIC/
Coop
Year-Over-Year
Change
May-2018 249 +14.2% 312 +14.7%
Jun-2018 231 +0.4% 303 -6.5%
Jul-2018 192 -8.6% 273 +14.2%
Aug-2018 192 -9.9% 260 +18.7%
Sep-2018 146 -17.5% 183 +4.6%
Oct-2018 246 +5.1% 293 -5.8%
Nov-2018 220 -10.2% 262 -5.8%
Dec-2018 160 +7.4% 193 -22.8%
Jan-2019 100 +5.3% 114 -23.5%
Feb-2019 113 +5.6% 164 -18.8%
Mar-2019 171 -14.5% 261 -9.7%
Apr-2019 218 +14.7% 313 +5.7%
12-Month Avg 187 -1.3% 244 -2.4%
Historical Sold Listings by Month
A count of the actual sales that closed in a given month.
Current as of May 11, 2019. All data from the San Francisco MLS. Report © 2019 ShowingTime. | 6
203
232
190
296
218
313
Single Family Condo/TIC/Coop
April
0
100
200
300
400
1-2005 1-2006 1-2007 1-2008 1-2009 1-2010 1-2011 1-2012 1-2013 1-2014 1-2015 1-2016 1-2017 1-2018 1-2019
Single Family Condo/TIC/Coop
593
826
592
936
602
852
Single Family Condo/TIC/Coop
Year to Date
2017 2018 2019
+ 5.7%+ 27.6%+ 14.7%- 6.4% + 13.3%+ 1.7%- 0.2% - 9.0%
2017 2018 2019 2017 2018 2019 2017 2018 2019
- 2.9% + 3.5% + 4.6%+ 4.5%
Median Sales Price
Median Sales Price
Single
Family
Year-Over-Year
Change
Condo/TIC/
Coop
Year-Over-Year
Change
May-2018 $1,618,888 +9.8% $1,257,500 +7.6%
Jun-2018 $1,625,000 +11.2% $1,170,000 +4.0%
Jul-2018 $1,626,250 +16.2% $1,150,000 0.0%
Aug-2018 $1,544,000 +12.3% $1,234,400 +5.1%
Sep-2018 $1,500,000 +13.6% $1,150,000 +5.0%
Oct-2018 $1,600,000 +1.6% $1,215,000 +6.6%
Nov-2018 $1,427,500 -4.5% $1,198,625 -3.1%
Dec-2018 $1,492,500 +2.9% $1,165,000 +4.0%
Jan-2019 $1,389,000 +4.4% $1,040,000 -5.5%
Feb-2019 $1,500,000 -11.8% $1,130,000 +4.1%
Mar-2019 $1,650,000 -2.2% $1,250,000 0.0%
Apr-2019 $1,632,500 -0.9% $1,220,000 -2.4%
12-Month Avg* $1,574,901 +6.4% $1,200,000 +2.1%
Historical Median Sales Price by Month
Point at which half of the sales sold for more and half sold for less, not accounting for seller concessions, in a given month.
* Median Sales Price for all properties from May 2018 through April 2019. This is not the average
of the individual figures above.
Current as of May 11, 2019. All data from the San Francisco MLS. Report © 2019 ShowingTime. | 7
$1,380,000
$1,100,000
$1,648,000
$1,250,000
$1,632,500
$1,220,000
Single Family Condo/TIC/Coop
April
$400,000
$600,000
$800,000
$1,000,000
$1,200,000
$1,400,000
$1,600,000
$1,800,000
1-2005 1-2006 1-2007 1-2008 1-2009 1-2010 1-2011 1-2012 1-2013 1-2014 1-2015 1-2016 1-2017 1-2018 1-2019
Single Family Condo/TIC/Coop
$1,338,000
$1,108,000
$1,611,000
$1,200,000
$1,585,000
$1,190,000
Single Family Condo/TIC/Coop
Year to Date
2017 2018 2019
- 2.4%+ 13.6%- 0.9%+ 19.4% + 8.3%- 1.6%+ 20.4% - 0.8%
2017 2018 2019 2017 2018 2019 2017 2018 2019
0.0% + 0.6% + 0.7%- 4.3%
Average Sales Price
Avg. Sales Price
Single
Family
Year-Over-Year
Change
Condo/TIC/
Coop
Year-Over-Year
Change
May-2018 $2,020,490 +10.1% $1,399,046 +3.9%
Jun-2018 $1,943,346 +12.5% $1,337,494 -1.0%
Jul-2018 $1,969,483 +13.3% $1,242,275 -0.1%
Aug-2018 $1,834,962 +17.6% $1,347,161 +6.1%
Sep-2018 $1,826,997 +13.4% $1,255,936 +3.2%
Oct-2018 $2,160,394 +7.9% $1,343,310 +5.3%
Nov-2018 $1,864,335 +6.2% $1,266,048 -8.7%
Dec-2018 $1,786,072 -6.4% $1,329,356 +5.2%
Jan-2019 $1,751,963 -2.0% $1,177,310 -10.9%
Feb-2019 $1,871,058 -11.2% $1,363,140 +7.8%
Mar-2019 $2,037,898 +4.5% $1,345,875 -1.8%
Apr-2019 $2,258,069 +3.3% $1,355,657 +1.5%
12-Month Avg* $1,967,809 +7.2% $1,322,492 +1.0%
Historical Average Sales Price by Month
Average sales price for all closed sales, not accounting for seller concessions, in a given month.
* Avg. Sales Price for all properties from May 2018 through April 2019. This is not the average of
the individual figures above.
Current as of May 11, 2019. All data from the San Francisco MLS. Report © 2019 ShowingTime. | 8
$1,880,160
$1,296,502
$2,185,545
$1,335,639
$2,258,069
$1,355,657
Single Family Condo/TIC/Coop
April
$500,000
$1,000,000
$1,500,000
$2,000,000
$2,500,000
1-2005 1-2006 1-2007 1-2008 1-2009 1-2010 1-2011 1-2012 1-2013 1-2014 1-2015 1-2016 1-2017 1-2018 1-2019
Single Family Condo/TIC/Coop
$1,802,522
$1,279,028
$2,027,769
$1,329,007
$2,038,813
$1,330,238
Single Family Condo/TIC/Coop
Year to Date
2017 2018 2019
+ 1.5%+ 3.0%+ 3.3%+ 16.2% + 3.9%+ 0.5%+ 12.5% + 0.1%
2017 2018 2019 2017 2018 2019 2017 2018 2019
+ 6.3% + 5.5% + 1.4%- 5.2%
Days on Market Until Sale
Days on Market
Single
Family
Year-Over-Year
Change
Condo/TIC/
Coop
Year-Over-Year
Change
May-2018 20 -16.7% 27 -18.2%
Jun-2018 18 -33.3% 27 -27.0%
Jul-2018 21 -12.5% 31 -6.1%
Aug-2018 22 -18.5% 36 -12.2%
Sep-2018 23 -17.9% 30 -28.6%
Oct-2018 24 +9.1% 27 -12.9%
Nov-2018 26 0.0% 38 +8.6%
Dec-2018 33 +17.9% 44 -2.2%
Jan-2019 39 +18.2% 55 0.0%
Feb-2019 29 +31.8% 40 +8.1%
Mar-2019 26 +18.2% 34 +30.8%
Apr-2019 27 +50.0% 39 +50.0%
12-Month Avg* 25 -0.1% 34 -4.0%
Historical Days on Market Until Sale by Month
Average number of days between when a property is listed and when an offer is accepted in a given month.
* Days on Market for all properties from May 2018 through April 2019. This is not the average of
the individual figures above.
Current as of May 11, 2019. All data from the San Francisco MLS. Report © 2019 ShowingTime. | 9
26
32
18
2627
39
Single Family Condo/TIC/Coop
April
0
20
40
60
80
100
120
1-2005 1-2006 1-2007 1-2008 1-2009 1-2010 1-2011 1-2012 1-2013 1-2014 1-2015 1-2016 1-2017 1-2018 1-2019
Single Family Condo/TIC/Coop
32
38
23
33
29
40
Single Family Condo/TIC/Coop
Year to Date
2017 2018 2019
+ 50.0%- 18.8%+ 50.0%- 30.8% - 13.2%+ 26.1%- 28.1% + 21.2%
2017 2018 2019 2017 2018 2019 2017 2018 2019
- 18.8% + 3.2% + 5.6%- 15.8%
Inventory of Active Listings
Active Listings
Single
Family
Year-Over-Year
Change
Condo/TIC/
Coop
Year-Over-Year
Change
May-2018 403 -6.1% 723 +9.4%
Jun-2018 428 +11.5% 714 +16.3%
Jul-2018 460 +17.3% 653 +8.3%
Aug-2018 485 +31.4% 666 +8.8%
Sep-2018 585 +34.8% 843 +11.5%
Oct-2018 534 +32.5% 829 +20.5%
Nov-2018 452 +39.5% 705 +18.1%
Dec-2018 316 +41.1% 497 +19.8%
Jan-2019 430 +35.2% 666 +14.8%
Feb-2019 431 +22.8% 679 +3.5%
Mar-2019 409 +3.8% 647 -1.1%
Apr-2019 372 -13.5% 586 -16.6%
12-Month Avg* 442 +19.2% 684 +8.9%
Historical Inventory of Active Listings by Month
The number of properties available for sale in active status at the end of a given month.
* Active Listings for all properties from May 2018 through April 2019. This is not the average of
the individual figures above.
Current as of May 11, 2019. All data from the San Francisco MLS. Report © 2019 ShowingTime. | 10
415
652
430
703
372
586
Single Family Condo/TIC/Coop
April
0
250
500
750
1,000
1,250
1,500
1-2005 1-2006 1-2007 1-2008 1-2009 1-2010 1-2011 1-2012 1-2013 1-2014 1-2015 1-2016 1-2017 1-2018 1-2019
Single Family Condo/TIC/Coop
2017 2018 2019
- 16.6%+ 7.8%- 13.5%+ 3.6%
2017 2018 2019
- 12.8% - 7.3%
% of Properties Sold Over List Price
% of Properties
Sold Over List Price
Single
Family
Year-Over-Year
Change
Condo/TIC/
Coop
Year-Over-Year
Change
May-2018 84.7% +7.4% 67.6% +10.8%
Jun-2018 88.3% +10.4% 68.3% +16.6%
Jul-2018 85.4% +4.9% 63.4% +1.0%
Aug-2018 80.2% +2.3% 57.7% -4.9%
Sep-2018 81.5% -5.1% 63.4% +19.4%
Oct-2018 82.5% -1.6% 68.3% +2.6%
Nov-2018 73.6% -8.9% 54.2% -7.0%
Dec-2018 68.1% -7.0% 46.1% -15.3%
Jan-2019 60.0% -14.9% 41.2% +22.6%
Feb-2019 77.9% -3.1% 53.0% -10.0%
Mar-2019 73.7% -4.9% 56.7% -4.2%
Apr-2019 73.9% -5.1% 55.3% -17.0%
12-Month Avg 78.7% -1.1% 59.5% +0.7%
Historical % of Properties Sold Over List Price by Month
Percentage found when dividing the number of properties sold by properties sold over its original list price, not accounting for seller
concessions.
* % of Properties Sold Over List Price for all properties from May 2018 through April 2019. This is
not the average of the individual figures above.
Current as of May 11, 2019. All data from the San Francisco MLS. Report © 2019 ShowingTime. | 11
77.3%
62.1%
77.9%
66.6%
73.9%
55.3%
Single Family Condo/TIC/Coop
April
0.0%
20.0%
40.0%
60.0%
80.0%
100.0%
1-2005 1-2006 1-2007 1-2008 1-2009 1-2010 1-2011 1-2012 1-2013 1-2014 1-2015 1-2016 1-2017 1-2018 1-2019
Single Family Condo/TIC/Coop
74.0%
56.9%
77.0%
57.4%
72.3%
53.4%
Single Family Condo/TIC/Coop
Year to Date
2017 2018 2019
- 17.0%+ 7.2%- 5.1%+ 0.8% + 0.9%- 6.1%+ 4.1% - 7.0%
2017 2018 2019 2017 2018 2019 2017 2018 2019
+ 2.2% - 4.9% - 6.6%+ 2.8%
% of List Price Received
% of List Price
Received
Single
Family
Year-Over-Year
Change
Condo/TIC/
Coop
Year-Over-Year
Change
May-2018 119.5% +3.6% 108.4% +2.8%
Jun-2018 120.1% +2.8% 107.3% +1.4%
Jul-2018 117.2% +0.1% 107.1% +1.0%
Aug-2018 114.7% -0.6% 105.6% -0.1%
Sep-2018 115.4% -0.8% 106.5% +1.6%
Oct-2018 114.0% -1.4% 107.7% +1.0%
Nov-2018 111.2% -3.7% 104.1% -0.4%
Dec-2018 110.5% -3.3% 102.1% -1.6%
Jan-2019 106.0% -5.6% 101.0% -0.7%
Feb-2019 112.6% -2.8% 104.2% -0.9%
Mar-2019 110.6% -5.9% 104.8% -2.1%
Apr-2019 112.6% -5.6% 104.9% -3.7%
12-Month Avg* 114.3% -1.6% 105.7% +0.0%
Historical % of List Price Received by Month
Percentage found when dividing a property’s sales price by its most recent list price, then taking the average for all properties sold in a given
month, not accounting for seller concessions.
* % of List Price Received for all properties from May 2018 through April 2019. This is not the
average of the individual figures above.
Current as of May 11, 2019. All data from the San Francisco MLS. Report © 2019 ShowingTime. | 12
115.4%
105.1%
119.3%
108.9%112.6%
104.9%
Single Family Condo/TIC/Coop
April
112.8%
104.1%
116.9%
106.4%
111.0%
104.2%
Single Family Condo/TIC/Coop
Year to Date
90.0%
100.0%
110.0%
120.0%
130.0%
1-2005 1-2006 1-2007 1-2008 1-2009 1-2010 1-2011 1-2012 1-2013 1-2014 1-2015 1-2016 1-2017 1-2018 1-2019
Single Family Condo/TIC/Coop
2017 2018 2019
- 3.7%+ 3.6%- 5.6%+ 3.4%
2017 2018 2019
+ 1.9% - 0.1%
2017 2018 2019
- 2.1%+ 2.2%- 5.0%+ 3.6%
2017 2018 2019
- 0.4% - 1.2%
Housing Affordability Ratio
Affordability Ratio
Single
Family
Year-Over-Year
Change
Condo/TIC/
Coop
Year-Over-Year
Change
May-2018 30 -14.3% 44 -13.7%
Jun-2018 30 -14.3% 48 -9.4%
Jul-2018 30 -18.9% 49 -5.8%
Aug-2018 31 -18.4% 45 -13.5%
Sep-2018 31 -20.5% 47 -14.5%
Oct-2018 28 -12.5% 41 -21.2%
Nov-2018 32 -8.6% 43 -12.2%
Dec-2018 33 -5.7% 48 -9.4%
Jan-2019 35 -5.4% 54 +3.8%
Feb-2019 33 +13.8% 51 -3.8%
Mar-2019 30 +3.4% 46 0.0%
Apr-2019 31 +6.9% 48 +6.7%
12-Month Avg* 31 -9.6% 34 -6.0%
Historical Housing Affordability Ratio by Month
This index measures housing affordability for the region. For example, an index of 120 means the median household income is 120% of what is
necessary to qualify for the median-priced home under prevailing interest rates. A higher number means greater affordability.
* Affordability Ratio for all properties from May 2018 through April 2019. This is not the average of
the individual figures above.
Current as of May 11, 2019. All data from the San Francisco MLS. Report © 2019 ShowingTime. | 13
37
54
29
45
31
48
Single Family Condo/TIC/Coop
April
20
40
60
80
100
1-2005 1-2006 1-2007 1-2008 1-2009 1-2010 1-2011 1-2012 1-2013 1-2014 1-2015 1-2016 1-2017 1-2018 1-2019
Single Family Condo/TIC/Coop
2017 2018 2019
+ 6.7%- 16.7%+ 6.9%- 21.6%
2017 2018 2019
- 2.6% + 1.9%
38
54
30
47
32
49
Single Family Condo/TIC/Coop
Year to Date
2017 2018 2019
+ 4.3%- 13.0%+ 6.7%- 21.1%
2017 2018 2019
- 2.6% - 3.6%
Months Supply of Inventory
Months Supply
Single
Family
Year-Over-Year
Change
Condo/TIC/
Coop
Year-Over-Year
Change
May-2018 2.1 -8.7% 2.9 +3.6%
Jun-2018 2.3 +9.5% 2.8 +7.7%
Jul-2018 2.4 +14.3% 2.5 -3.8%
Aug-2018 2.6 +30.0% 2.6 0.0%
Sep-2018 3.1 +34.8% 3.3 +3.1%
Oct-2018 2.9 +38.1% 3.3 +17.9%
Nov-2018 2.4 +41.2% 2.8 +12.0%
Dec-2018 1.7 +41.7% 2.0 +17.6%
Jan-2019 2.3 +35.3% 2.7 +12.5%
Feb-2019 2.3 +27.8% 2.8 +3.7%
Mar-2019 2.2 +4.8% 2.7 +3.8%
Apr-2019 2.0 -13.0% 2.4 -14.3%
12-Month Avg* 2.4 +20.1% 2.7 +4.9%
Historical Months Supply of Inventory by Month
The inventory of homes for sale at the end of a given month, divided by the average monthly pending sales from the last 12 months.
* Months Supply for all properties from May 2018 through April 2019. This is not the average of
the individual figures above.
Current as of May 11, 2019. All data from the San Francisco MLS. Report © 2019 ShowingTime. | 14
2.2
2.8
2.3
2.8
2.0
2.4
Single Family Condo/TIC/Coop
April
0.0
2.0
4.0
6.0
8.0
10.0
1-2005 1-2006 1-2007 1-2008 1-2009 1-2010 1-2011 1-2012 1-2013 1-2014 1-2015 1-2016 1-2017 1-2018 1-2019
Single Family Condo/TIC/Coop
2017 2018 2019
- 14.3%0.0%- 13.0%+ 4.5%
2017 2018 2019
- 12.0% - 6.7%
All Properties Activity Overview
Key metrics by report month and for year-to-date (YTD) starting from the first of the year.
Key Metrics Historical Sparkbars 4-2018 4-2019 Percent Change YTD 2018 YTD 2019 Percent Change
Current as of May 11, 2019. All data from the San Francisco MLS. Report © 2019 ShowingTime. | 15
Months Supply 2.5 2.2 - 12.0% -- -- --
Affordability Ratio 34 34 0.0%
% of List Price Received 113.0% 108.1% - 4.3% 110.5%
35
61.2% - 5.8%
- 3.2%
36 + 2.9%
107.0%
% of Properties Sold Over List Price 71.0% 62.9% - 11.4% 65.0%
Active Listings 1,133 958 - 15.4% --
Avg. Sales Price $1,667,907 $1,726,139 + 3.5% $1,599,731
Days on Market 23 34 + 47.8% 29
$1,350,000 0.0%
+ 1.5%
35 + 20.7%
$1,623,609
-- --
Sold Listings 486 531 + 9.3% 1,528 1,454 - 4.8%
Median Sales Price $1,382,500 $1,400,000 + 1.3% $1,350,000
- 15.2%
Pending Sales 494 526 + 6.5% 1,694 1,617 - 4.5%
New Listings 648 490 - 24.4% 2,425 2,057
4-2016 4-2017 4-2018 4-2019
4-2016 4-2017 4-2018 4-2019
4-2016 4-2017 4-2018 4-2019
4-2016 4-2017 4-2018 4-2019
4-2016 4-2017 4-2018 4-2019
4-2016 4-2017 4-2018 4-2019
4-2016 4-2017 4-2018 4-2019
4-2016 4-2017 4-2018 4-2019
4-2016 4-2017 4-2018 4-2019
4-2016 4-2017 4-2018 4-2019
4-2016 4-2017 4-2018 4-2019
Activity by District
SF District 1: Northwest (Sea Cliff, Lake, Jordan Park / Laurel Heights, Outer Richmond, Central Richmond, Inner Richmond, Lone Mountain)
SF District 2: Central West (Outer Sunset, Central Sunset, Inner Sunset, Outer Parkside, Parkside, Inner Parkside, Golden Gate Heights)
SF District 3: Southwest (Pine Lake Park, Lake Shore, Merced Manor, Stonestown, Lakeside, Merced Heights, Ingleside, Ingleside Heights, Oceanview)
SF District 4: Twin Peaks W (Forest Hill (& Ext), W Portal, St Francis Wd, Balboa Terr, Mt Dav Manor, Ingleside Terr, Monterey Hts, Wstwd Pk & H'lnds, Shrwd Fst, Miraloma Pk, Dmnd Hts, Mdtwn Terr)
SF District 5: Central (Haight Ashbury, Cole Vly / Prnssus Hts, Clarndn Hts, Corona Hts, Twin Pks, Glen Pk, Noe Vly, Eureka Vly / Dolores Hts, Mission Dolores, Duboce Trngl, Buena Vista / Ashbury Hts)
SF District 6: Central North (Lower Pacific Heights, Anza Vista, Western Addition, North Panhandle, Alamo Square, Hayes Valley)
SF District 7: North (Marina, Cow Hollow, Presidio Heights, Pacific Heights)
SF District 8: Northeast (North Waterfront, North Beach, Russian Hill, Telegraph Hill, Nob Hill, Financial District / Barbary Coast, Downtown, Van Ness / Civic Center, Tenderloin)
SF District 9: Central East (Yerba Buena, South Beach, South of Market, Mission Bay, Inner Mission, Potrero Hill, Central Waterfront / Dogpatch, Bernal Heights)
SF District 10: Southeast (Outer Mission, Mission Terr, Excelsior, Portola, Bayview, Silver Terr, Hunters Pt, Candlestick Pt, Bayview Hts, Little Hollywood, Visitation Vly, Crocker Amazon)
4-2018 4-2019 + / – 4-2018 4-2019 + / – 4-2018 4-2019 + / – 4-2018 4-2019 + / – 4-2018 4-2019 + / –
Single Family
1 SF District 1 36 30 -16.7% 18 15 -16.7% $2,037,500 $2,205,000 +8.2% 14 25 +78.6% 2.6 1.8 -30.8%
2 SF District 2 52 42 -19.2% 38 39 +2.6% $1,600,000 $1,600,000 0.0% 14 24 +71.4% 1.6 1.3 -18.8%
3 SF District 3 32 23 -28.1% 11 16 +45.5% $1,325,000 $1,155,500 -12.8% 23 27 +17.4% 2.3 1.8 -21.7%
4 SF District 4 51 36 -29.4% 27 34 +25.9% $1,700,000 $1,760,000 +3.5% 13 33 +153.8% 1.9 1.3 -31.6%
5 SF District 5 68 58 -14.7% 24 34 +41.7% $2,152,500 $2,050,000 -4.8% 21 19 -9.5% 2.6 2.1 -19.2%
6 SF District 6 8 17 +112.5% 2 2 0.0% $3,300,000 $2,622,500 -20.5% 0 14 -- 2.5 4.9 +96.0%
7 SF District 7 42 28 -33.3% 9 15 +66.7% $8,800,000 $6,200,000 -29.5% 16 45 +181.3% 4.8 3.1 -35.4%
8 SF District 8 7 18 +157.1% 2 1 -50.0% $9,305,000 $4,400,000 -52.7% 33 7 -78.8% 2.5 9.5 +280.0%
9 SF District 9 55 45 -18.2% 22 23 +4.5% $1,693,000 $1,600,000 -5.5% 13 29 +123.1% 2.5 2.3 -8.0%
10 SF District 10 79 75 -5.1% 37 39 +5.4% $977,000 $1,025,000 +4.9% 29 24 -17.2% 1.9 2.0 +5.3%
Condo/TIC/Coop
1 SF District 1 23 22 -4.3% 19 27 +42.1% $1,525,000 $1,400,000 -8.2% 18 38 +111.1% 1.9 1.5 -21.1%
2 SF District 2 4 5 +25.0% 9 2 -77.8% $1,250,000 $1,387,500 +11.0% 15 15 0.0% 1.1 1.3 +18.2%
3 SF District 3 6 8 +33.3% 5 5 0.0% $1,250,000 $950,000 -24.0% 40 47 +17.5% 2.3 2.7 +17.4%
4 SF District 4 8 9 +12.5% 5 5 0.0% $965,000 $1,100,000 +14.0% 16 41 +156.3% 1.9 1.7 -10.5%
5 SF District 5 91 49 -46.2% 47 45 -4.3% $1,500,000 $1,480,000 -1.3% 18 20 +11.1% 2.4 1.4 -41.7%
6 SF District 6 56 57 +1.8% 31 22 -29.0% $1,150,000 $1,190,000 +3.5% 21 16 -23.8% 2.1 2.8 +33.3%
7 SF District 7 70 52 -25.7% 28 26 -7.1% $1,305,000 $1,537,500 +17.8% 18 38 +111.1% 2.7 2.1 -22.2%
8 SF District 8 152 135 -11.2% 41 64 +56.1% $1,165,000 $999,500 -14.2% 32 54 +68.8% 3.7 3.2 -13.5%
9 SF District 9 273 217 -20.5% 107 112 +4.7% $1,090,000 $1,241,250 +13.9% 34 40 +17.6% 3.0 2.5 -16.7%
10 SF District 10 20 32 +60.0% 4 5 +25.0% $816,500 $815,000 -0.2% 27 80 +196.3% 2.4 5.6 +133.3%
Key metrics by report month for the districts of San Fransisco.
Current as of May 11, 2019. All data from the San Francisco MLS. Report © 2019 ShowingTime. | 16
Active Listings Sold Listings Median Sales Price Days on Market Months Supply

More Related Content

What's hot

San Francisco Market Focus Report December 2018
San Francisco Market Focus Report December 2018San Francisco Market Focus Report December 2018
San Francisco Market Focus Report December 2018Ronny Budiutama
 
San Francisco Market Focus Report Jan 2020
San Francisco Market Focus Report Jan 2020San Francisco Market Focus Report Jan 2020
San Francisco Market Focus Report Jan 2020Ronny Budiutama
 
San Francisco market report July 2020
San Francisco market report July 2020San Francisco market report July 2020
San Francisco market report July 2020Ronny Budiutama
 
San Francisco Market Focus Report Jan 2019
San Francisco Market Focus Report Jan 2019San Francisco Market Focus Report Jan 2019
San Francisco Market Focus Report Jan 2019Ronny Budiutama
 
San Francisco market report May 2020
San Francisco market report May 2020San Francisco market report May 2020
San Francisco market report May 2020Ronny Budiutama
 
San Francisco market report September 2020
San Francisco market report September 2020San Francisco market report September 2020
San Francisco market report September 2020Ronny Budiutama
 
San Francisco Market Report for March 2020
San Francisco Market Report for March 2020San Francisco Market Report for March 2020
San Francisco Market Report for March 2020Ronny Budiutama
 
San Francisco Market Focus Report Feb 2020
San Francisco Market Focus Report Feb 2020San Francisco Market Focus Report Feb 2020
San Francisco Market Focus Report Feb 2020Ronny Budiutama
 
San Francisco market report April 2020
San Francisco market report April 2020San Francisco market report April 2020
San Francisco market report April 2020Ronny Budiutama
 
San Francisco market report August 2020
San Francisco market report August 2020San Francisco market report August 2020
San Francisco market report August 2020Ronny Budiutama
 
San Francisco Market Report December 2020
San Francisco Market Report December 2020San Francisco Market Report December 2020
San Francisco Market Report December 2020Ronny Budiutama
 
San Francisco Market Report March 2021
San Francisco Market Report March 2021San Francisco Market Report March 2021
San Francisco Market Report March 2021Ronny Budiutama
 
San Francisco Market Report January 2021
San Francisco Market Report January 2021San Francisco Market Report January 2021
San Francisco Market Report January 2021Ronny Budiutama
 
San Francisco Market Data October 2020
San Francisco Market Data October 2020San Francisco Market Data October 2020
San Francisco Market Data October 2020Ronny Budiutama
 
San Francisco Market Report May 2021
San Francisco Market Report May 2021San Francisco Market Report May 2021
San Francisco Market Report May 2021Ronny Budiutama
 
San Francisco Market Report June 2021
San Francisco Market Report June 2021San Francisco Market Report June 2021
San Francisco Market Report June 2021Ronny Budiutama
 
San Francisco Market Report April 2021
San Francisco Market Report April 2021San Francisco Market Report April 2021
San Francisco Market Report April 2021Ronny Budiutama
 
Gbar monthly-market-insight-report-jan20
Gbar monthly-market-insight-report-jan20Gbar monthly-market-insight-report-jan20
Gbar monthly-market-insight-report-jan20Joe Schutt
 
San Francisco Market Report August 2021
San Francisco Market Report August 2021San Francisco Market Report August 2021
San Francisco Market Report August 2021Ronny Budiutama
 
San Francisco Market Report September 2021
San Francisco Market Report September 2021San Francisco Market Report September 2021
San Francisco Market Report September 2021Ronny Budiutama
 

What's hot (20)

San Francisco Market Focus Report December 2018
San Francisco Market Focus Report December 2018San Francisco Market Focus Report December 2018
San Francisco Market Focus Report December 2018
 
San Francisco Market Focus Report Jan 2020
San Francisco Market Focus Report Jan 2020San Francisco Market Focus Report Jan 2020
San Francisco Market Focus Report Jan 2020
 
San Francisco market report July 2020
San Francisco market report July 2020San Francisco market report July 2020
San Francisco market report July 2020
 
San Francisco Market Focus Report Jan 2019
San Francisco Market Focus Report Jan 2019San Francisco Market Focus Report Jan 2019
San Francisco Market Focus Report Jan 2019
 
San Francisco market report May 2020
San Francisco market report May 2020San Francisco market report May 2020
San Francisco market report May 2020
 
San Francisco market report September 2020
San Francisco market report September 2020San Francisco market report September 2020
San Francisco market report September 2020
 
San Francisco Market Report for March 2020
San Francisco Market Report for March 2020San Francisco Market Report for March 2020
San Francisco Market Report for March 2020
 
San Francisco Market Focus Report Feb 2020
San Francisco Market Focus Report Feb 2020San Francisco Market Focus Report Feb 2020
San Francisco Market Focus Report Feb 2020
 
San Francisco market report April 2020
San Francisco market report April 2020San Francisco market report April 2020
San Francisco market report April 2020
 
San Francisco market report August 2020
San Francisco market report August 2020San Francisco market report August 2020
San Francisco market report August 2020
 
San Francisco Market Report December 2020
San Francisco Market Report December 2020San Francisco Market Report December 2020
San Francisco Market Report December 2020
 
San Francisco Market Report March 2021
San Francisco Market Report March 2021San Francisco Market Report March 2021
San Francisco Market Report March 2021
 
San Francisco Market Report January 2021
San Francisco Market Report January 2021San Francisco Market Report January 2021
San Francisco Market Report January 2021
 
San Francisco Market Data October 2020
San Francisco Market Data October 2020San Francisco Market Data October 2020
San Francisco Market Data October 2020
 
San Francisco Market Report May 2021
San Francisco Market Report May 2021San Francisco Market Report May 2021
San Francisco Market Report May 2021
 
San Francisco Market Report June 2021
San Francisco Market Report June 2021San Francisco Market Report June 2021
San Francisco Market Report June 2021
 
San Francisco Market Report April 2021
San Francisco Market Report April 2021San Francisco Market Report April 2021
San Francisco Market Report April 2021
 
Gbar monthly-market-insight-report-jan20
Gbar monthly-market-insight-report-jan20Gbar monthly-market-insight-report-jan20
Gbar monthly-market-insight-report-jan20
 
San Francisco Market Report August 2021
San Francisco Market Report August 2021San Francisco Market Report August 2021
San Francisco Market Report August 2021
 
San Francisco Market Report September 2021
San Francisco Market Report September 2021San Francisco Market Report September 2021
San Francisco Market Report September 2021
 

Similar to San Francisco Market Focus Report April 2019

San Francisco market focus report June 2018
San Francisco market focus report June 2018San Francisco market focus report June 2018
San Francisco market focus report June 2018Ronny Budiutama
 
San Francisco Market Focus February 2018
San Francisco Market Focus February 2018San Francisco Market Focus February 2018
San Francisco Market Focus February 2018Ronny Budiutama
 
San Francisco Market Focus April 2018
San Francisco Market Focus April 2018San Francisco Market Focus April 2018
San Francisco Market Focus April 2018Ronny Budiutama
 
San Francisco Market Focus Report May
San Francisco Market Focus Report MaySan Francisco Market Focus Report May
San Francisco Market Focus Report MayRonny Budiutama
 
San Francisco Market Focus Report September 2018
San Francisco Market Focus Report September 2018San Francisco Market Focus Report September 2018
San Francisco Market Focus Report September 2018Ronny Budiutama
 
San Francisco Market Focus Report July
San Francisco Market Focus Report JulySan Francisco Market Focus Report July
San Francisco Market Focus Report JulyRonny Budiutama
 
San Francisco Market Focus March 2018
San Francisco Market Focus March 2018San Francisco Market Focus March 2018
San Francisco Market Focus March 2018Ronny Budiutama
 
Georgia Housing Market Snapshot For March 2019
Georgia Housing Market Snapshot For March 2019Georgia Housing Market Snapshot For March 2019
Georgia Housing Market Snapshot For March 2019Arthur Prescott
 
San Francisco Market Focus April 2017
San Francisco Market Focus April 2017San Francisco Market Focus April 2017
San Francisco Market Focus April 2017Ronny Budiutama
 
San Francisco Real Estate Housing Market December 2016
San Francisco Real Estate Housing Market December 2016San Francisco Real Estate Housing Market December 2016
San Francisco Real Estate Housing Market December 2016Ronny Budiutama
 
San Francisco Market Focus Report October 2018
San Francisco Market Focus Report October 2018San Francisco Market Focus Report October 2018
San Francisco Market Focus Report October 2018Ronny Budiutama
 
San Francisco Market Focus July 2017
San Francisco Market Focus July 2017San Francisco Market Focus July 2017
San Francisco Market Focus July 2017Ronny Budiutama
 
San Francisco Market Focus Report Aug 2018
San Francisco Market Focus Report Aug 2018San Francisco Market Focus Report Aug 2018
San Francisco Market Focus Report Aug 2018Ronny Budiutama
 
San Francisco Market Focus Report Nov 2020
San Francisco Market Focus Report Nov 2020San Francisco Market Focus Report Nov 2020
San Francisco Market Focus Report Nov 2020Ronny Budiutama
 
San Francisco Market Focus June 2017
San Francisco Market Focus June 2017San Francisco Market Focus June 2017
San Francisco Market Focus June 2017Ronny Budiutama
 

Similar to San Francisco Market Focus Report April 2019 (15)

San Francisco market focus report June 2018
San Francisco market focus report June 2018San Francisco market focus report June 2018
San Francisco market focus report June 2018
 
San Francisco Market Focus February 2018
San Francisco Market Focus February 2018San Francisco Market Focus February 2018
San Francisco Market Focus February 2018
 
San Francisco Market Focus April 2018
San Francisco Market Focus April 2018San Francisco Market Focus April 2018
San Francisco Market Focus April 2018
 
San Francisco Market Focus Report May
San Francisco Market Focus Report MaySan Francisco Market Focus Report May
San Francisco Market Focus Report May
 
San Francisco Market Focus Report September 2018
San Francisco Market Focus Report September 2018San Francisco Market Focus Report September 2018
San Francisco Market Focus Report September 2018
 
San Francisco Market Focus Report July
San Francisco Market Focus Report JulySan Francisco Market Focus Report July
San Francisco Market Focus Report July
 
San Francisco Market Focus March 2018
San Francisco Market Focus March 2018San Francisco Market Focus March 2018
San Francisco Market Focus March 2018
 
Georgia Housing Market Snapshot For March 2019
Georgia Housing Market Snapshot For March 2019Georgia Housing Market Snapshot For March 2019
Georgia Housing Market Snapshot For March 2019
 
San Francisco Market Focus April 2017
San Francisco Market Focus April 2017San Francisco Market Focus April 2017
San Francisco Market Focus April 2017
 
San Francisco Real Estate Housing Market December 2016
San Francisco Real Estate Housing Market December 2016San Francisco Real Estate Housing Market December 2016
San Francisco Real Estate Housing Market December 2016
 
San Francisco Market Focus Report October 2018
San Francisco Market Focus Report October 2018San Francisco Market Focus Report October 2018
San Francisco Market Focus Report October 2018
 
San Francisco Market Focus July 2017
San Francisco Market Focus July 2017San Francisco Market Focus July 2017
San Francisco Market Focus July 2017
 
San Francisco Market Focus Report Aug 2018
San Francisco Market Focus Report Aug 2018San Francisco Market Focus Report Aug 2018
San Francisco Market Focus Report Aug 2018
 
San Francisco Market Focus Report Nov 2020
San Francisco Market Focus Report Nov 2020San Francisco Market Focus Report Nov 2020
San Francisco Market Focus Report Nov 2020
 
San Francisco Market Focus June 2017
San Francisco Market Focus June 2017San Francisco Market Focus June 2017
San Francisco Market Focus June 2017
 

More from Ronny Budiutama

San Francisco January 2024 Market Report
San Francisco January 2024 Market ReportSan Francisco January 2024 Market Report
San Francisco January 2024 Market ReportRonny Budiutama
 
San Francisco December 2023 Market Report
San Francisco December 2023 Market ReportSan Francisco December 2023 Market Report
San Francisco December 2023 Market ReportRonny Budiutama
 
San Francisco November 2023 Market Report
San Francisco November 2023 Market ReportSan Francisco November 2023 Market Report
San Francisco November 2023 Market ReportRonny Budiutama
 
2023 Annual San Francisco Housing Market
2023 Annual San Francisco Housing Market2023 Annual San Francisco Housing Market
2023 Annual San Francisco Housing MarketRonny Budiutama
 
October 2023 Report: San Francisco Real Estate Market Insights
October 2023 Report: San Francisco Real Estate Market InsightsOctober 2023 Report: San Francisco Real Estate Market Insights
October 2023 Report: San Francisco Real Estate Market InsightsRonny Budiutama
 
CA Weekly MLS Market Data Report - August 2023
CA Weekly MLS Market Data Report - August 2023CA Weekly MLS Market Data Report - August 2023
CA Weekly MLS Market Data Report - August 2023Ronny Budiutama
 
San Francisco Market Report July 2023.pdf
San Francisco Market Report July 2023.pdfSan Francisco Market Report July 2023.pdf
San Francisco Market Report July 2023.pdfRonny Budiutama
 
San Francisco May 2023 Market Report.pdf
San Francisco May 2023 Market Report.pdfSan Francisco May 2023 Market Report.pdf
San Francisco May 2023 Market Report.pdfRonny Budiutama
 
San Francisco June 2023 Market Report.pdf
San Francisco June 2023 Market Report.pdfSan Francisco June 2023 Market Report.pdf
San Francisco June 2023 Market Report.pdfRonny Budiutama
 
San Francisco Market Report March 2023.pdf
San Francisco Market Report March 2023.pdfSan Francisco Market Report March 2023.pdf
San Francisco Market Report March 2023.pdfRonny Budiutama
 
San Francisco Market Report February 2023
San Francisco Market Report February 2023San Francisco Market Report February 2023
San Francisco Market Report February 2023Ronny Budiutama
 
San Francisco Market Report January 2023.pdf
San Francisco Market Report January 2023.pdfSan Francisco Market Report January 2023.pdf
San Francisco Market Report January 2023.pdfRonny Budiutama
 
Annual Report on the San Francisco County Housing Market.pdf
Annual Report on the San Francisco County Housing Market.pdfAnnual Report on the San Francisco County Housing Market.pdf
Annual Report on the San Francisco County Housing Market.pdfRonny Budiutama
 
San Francisco Market Report December 2022.pdf
San Francisco Market Report December 2022.pdfSan Francisco Market Report December 2022.pdf
San Francisco Market Report December 2022.pdfRonny Budiutama
 
San Francisco Market Report November 2022.pdf
San Francisco Market Report November 2022.pdfSan Francisco Market Report November 2022.pdf
San Francisco Market Report November 2022.pdfRonny Budiutama
 
San Francisco Market Report October 2022.pdf
San Francisco Market Report October 2022.pdfSan Francisco Market Report October 2022.pdf
San Francisco Market Report October 2022.pdfRonny Budiutama
 
San Francisco Market Report September 2022.pdf
San Francisco Market Report September 2022.pdfSan Francisco Market Report September 2022.pdf
San Francisco Market Report September 2022.pdfRonny Budiutama
 
San Francisco Market Report August 2022.pdf
San Francisco Market Report August 2022.pdfSan Francisco Market Report August 2022.pdf
San Francisco Market Report August 2022.pdfRonny Budiutama
 
San Francisco Market Report July 2022.pdf
San Francisco Market Report July 2022.pdfSan Francisco Market Report July 2022.pdf
San Francisco Market Report July 2022.pdfRonny Budiutama
 
San Francisco Market Report June 2022.pdf
San Francisco Market Report June 2022.pdfSan Francisco Market Report June 2022.pdf
San Francisco Market Report June 2022.pdfRonny Budiutama
 

More from Ronny Budiutama (20)

San Francisco January 2024 Market Report
San Francisco January 2024 Market ReportSan Francisco January 2024 Market Report
San Francisco January 2024 Market Report
 
San Francisco December 2023 Market Report
San Francisco December 2023 Market ReportSan Francisco December 2023 Market Report
San Francisco December 2023 Market Report
 
San Francisco November 2023 Market Report
San Francisco November 2023 Market ReportSan Francisco November 2023 Market Report
San Francisco November 2023 Market Report
 
2023 Annual San Francisco Housing Market
2023 Annual San Francisco Housing Market2023 Annual San Francisco Housing Market
2023 Annual San Francisco Housing Market
 
October 2023 Report: San Francisco Real Estate Market Insights
October 2023 Report: San Francisco Real Estate Market InsightsOctober 2023 Report: San Francisco Real Estate Market Insights
October 2023 Report: San Francisco Real Estate Market Insights
 
CA Weekly MLS Market Data Report - August 2023
CA Weekly MLS Market Data Report - August 2023CA Weekly MLS Market Data Report - August 2023
CA Weekly MLS Market Data Report - August 2023
 
San Francisco Market Report July 2023.pdf
San Francisco Market Report July 2023.pdfSan Francisco Market Report July 2023.pdf
San Francisco Market Report July 2023.pdf
 
San Francisco May 2023 Market Report.pdf
San Francisco May 2023 Market Report.pdfSan Francisco May 2023 Market Report.pdf
San Francisco May 2023 Market Report.pdf
 
San Francisco June 2023 Market Report.pdf
San Francisco June 2023 Market Report.pdfSan Francisco June 2023 Market Report.pdf
San Francisco June 2023 Market Report.pdf
 
San Francisco Market Report March 2023.pdf
San Francisco Market Report March 2023.pdfSan Francisco Market Report March 2023.pdf
San Francisco Market Report March 2023.pdf
 
San Francisco Market Report February 2023
San Francisco Market Report February 2023San Francisco Market Report February 2023
San Francisco Market Report February 2023
 
San Francisco Market Report January 2023.pdf
San Francisco Market Report January 2023.pdfSan Francisco Market Report January 2023.pdf
San Francisco Market Report January 2023.pdf
 
Annual Report on the San Francisco County Housing Market.pdf
Annual Report on the San Francisco County Housing Market.pdfAnnual Report on the San Francisco County Housing Market.pdf
Annual Report on the San Francisco County Housing Market.pdf
 
San Francisco Market Report December 2022.pdf
San Francisco Market Report December 2022.pdfSan Francisco Market Report December 2022.pdf
San Francisco Market Report December 2022.pdf
 
San Francisco Market Report November 2022.pdf
San Francisco Market Report November 2022.pdfSan Francisco Market Report November 2022.pdf
San Francisco Market Report November 2022.pdf
 
San Francisco Market Report October 2022.pdf
San Francisco Market Report October 2022.pdfSan Francisco Market Report October 2022.pdf
San Francisco Market Report October 2022.pdf
 
San Francisco Market Report September 2022.pdf
San Francisco Market Report September 2022.pdfSan Francisco Market Report September 2022.pdf
San Francisco Market Report September 2022.pdf
 
San Francisco Market Report August 2022.pdf
San Francisco Market Report August 2022.pdfSan Francisco Market Report August 2022.pdf
San Francisco Market Report August 2022.pdf
 
San Francisco Market Report July 2022.pdf
San Francisco Market Report July 2022.pdfSan Francisco Market Report July 2022.pdf
San Francisco Market Report July 2022.pdf
 
San Francisco Market Report June 2022.pdf
San Francisco Market Report June 2022.pdfSan Francisco Market Report June 2022.pdf
San Francisco Market Report June 2022.pdf
 

Recently uploaded

Call Girls In Krishna Nagar Delhi (Escort)↫8447779280↬@SHOT 1500- NIGHT 5500→...
Call Girls In Krishna Nagar Delhi (Escort)↫8447779280↬@SHOT 1500- NIGHT 5500→...Call Girls In Krishna Nagar Delhi (Escort)↫8447779280↬@SHOT 1500- NIGHT 5500→...
Call Girls In Krishna Nagar Delhi (Escort)↫8447779280↬@SHOT 1500- NIGHT 5500→...asmaqueen5
 
Call Girls In Seelampur Delhi ↬8447779280}Seelampur Escorts Service In Delhi...
Call Girls In Seelampur  Delhi ↬8447779280}Seelampur Escorts Service In Delhi...Call Girls In Seelampur  Delhi ↬8447779280}Seelampur Escorts Service In Delhi...
Call Girls In Seelampur Delhi ↬8447779280}Seelampur Escorts Service In Delhi...asmaqueen5
 
Enjoy Night ≽ 8448380779 ≼ Call Girls In Huda City Centre (Gurgaon)
Enjoy Night ≽ 8448380779 ≼ Call Girls In Huda City Centre (Gurgaon)Enjoy Night ≽ 8448380779 ≼ Call Girls In Huda City Centre (Gurgaon)
Enjoy Night ≽ 8448380779 ≼ Call Girls In Huda City Centre (Gurgaon)Delhi Call girls
 
Kohinoor Flats In Hinjewadi Phase 2 | Homes Built To Suit Your Needs
Kohinoor Flats In Hinjewadi Phase 2 | Homes Built To Suit Your NeedsKohinoor Flats In Hinjewadi Phase 2 | Homes Built To Suit Your Needs
Kohinoor Flats In Hinjewadi Phase 2 | Homes Built To Suit Your Needsaidasheikh47
 
BDSM⚡Call Girls in Sector 57 Noida Escorts >༒8448380779 Escort Service
BDSM⚡Call Girls in Sector 57 Noida Escorts >༒8448380779 Escort ServiceBDSM⚡Call Girls in Sector 57 Noida Escorts >༒8448380779 Escort Service
BDSM⚡Call Girls in Sector 57 Noida Escorts >༒8448380779 Escort ServiceDelhi Call girls
 
Parksville 96 Surrey Floor Plans May 2024
Parksville 96 Surrey Floor Plans May 2024Parksville 96 Surrey Floor Plans May 2024
Parksville 96 Surrey Floor Plans May 2024VickyAulakh1
 
9990771857 Call Girls in Dwarka Sector 3 Delhi (Call Girls) Delhi
9990771857 Call Girls in Dwarka Sector 3 Delhi (Call Girls) Delhi9990771857 Call Girls in Dwarka Sector 3 Delhi (Call Girls) Delhi
9990771857 Call Girls in Dwarka Sector 3 Delhi (Call Girls) Delhidelhimodel235
 
2k Shots ≽ 9205541914 ≼ Call Girls In Sainik Farm (Delhi)
2k Shots ≽ 9205541914 ≼ Call Girls In Sainik Farm (Delhi)2k Shots ≽ 9205541914 ≼ Call Girls In Sainik Farm (Delhi)
2k Shots ≽ 9205541914 ≼ Call Girls In Sainik Farm (Delhi)Delhi Call girls
 
Enjoy Night ≽ 8448380779 ≼ Call Girls In Iffco Chowk (Gurgaon)
Enjoy Night ≽ 8448380779 ≼ Call Girls In Iffco Chowk (Gurgaon)Enjoy Night ≽ 8448380779 ≼ Call Girls In Iffco Chowk (Gurgaon)
Enjoy Night ≽ 8448380779 ≼ Call Girls In Iffco Chowk (Gurgaon)Delhi Call girls
 
Mahindra Happinest Tathawade Pune Brochure.pdf
Mahindra Happinest Tathawade Pune Brochure.pdfMahindra Happinest Tathawade Pune Brochure.pdf
Mahindra Happinest Tathawade Pune Brochure.pdfBabyrudram
 
Call Girls In Laxmi Nagar Delhi +91-8447779280! !Best Woman Seeking Man Escor...
Call Girls In Laxmi Nagar Delhi +91-8447779280! !Best Woman Seeking Man Escor...Call Girls In Laxmi Nagar Delhi +91-8447779280! !Best Woman Seeking Man Escor...
Call Girls In Laxmi Nagar Delhi +91-8447779280! !Best Woman Seeking Man Escor...asmaqueen5
 
Majestique Viman Nagar Pune Brochure.pdf
Majestique Viman Nagar Pune Brochure.pdfMajestique Viman Nagar Pune Brochure.pdf
Majestique Viman Nagar Pune Brochure.pdfBabyrudram
 
M3M The Line Brochure - Premium Investment Opportunity for Commercial Ventures
M3M The Line Brochure - Premium Investment Opportunity for Commercial VenturesM3M The Line Brochure - Premium Investment Opportunity for Commercial Ventures
M3M The Line Brochure - Premium Investment Opportunity for Commercial Venturessheltercareglobal
 
Best Deal Virtual Space in Satya The Hive Tata Zudio 750 Sqft 1.89 Cr All inc...
Best Deal Virtual Space in Satya The Hive Tata Zudio 750 Sqft 1.89 Cr All inc...Best Deal Virtual Space in Satya The Hive Tata Zudio 750 Sqft 1.89 Cr All inc...
Best Deal Virtual Space in Satya The Hive Tata Zudio 750 Sqft 1.89 Cr All inc...ApartmentWala1
 
9990771857 Call Girls in Dwarka Sector 2 Delhi (Call Girls) Delhi
9990771857 Call Girls in Dwarka Sector 2 Delhi (Call Girls) Delhi9990771857 Call Girls in Dwarka Sector 2 Delhi (Call Girls) Delhi
9990771857 Call Girls in Dwarka Sector 2 Delhi (Call Girls) Delhidelhimodel235
 
Purva Soukhyam in Guduvancheri Chennai.pdf
Purva Soukhyam in Guduvancheri Chennai.pdfPurva Soukhyam in Guduvancheri Chennai.pdf
Purva Soukhyam in Guduvancheri Chennai.pdfpritika141199
 
9990771857 Call Girls in Dwarka Sector 137 Noida (Call Girls) Delhi
9990771857 Call Girls in Dwarka Sector 137 Noida (Call Girls) Delhi9990771857 Call Girls in Dwarka Sector 137 Noida (Call Girls) Delhi
9990771857 Call Girls in Dwarka Sector 137 Noida (Call Girls) Delhidelhimodel235
 
TENANT SCREENING REPORT SERVICES​ How Tenant Screening Reports Work
TENANT SCREENING REPORT SERVICES​ How Tenant Screening Reports WorkTENANT SCREENING REPORT SERVICES​ How Tenant Screening Reports Work
TENANT SCREENING REPORT SERVICES​ How Tenant Screening Reports WorkTurbo Tenant
 
Properties for Sale in Istanbul with Schools and Parks | Antalya Development
Properties for Sale in Istanbul with Schools and Parks | Antalya DevelopmentProperties for Sale in Istanbul with Schools and Parks | Antalya Development
Properties for Sale in Istanbul with Schools and Parks | Antalya DevelopmentAntalya Development
 
The Gale at Godrej Park World Hinjewadi Pune Brochure.pdf
The Gale at Godrej Park World Hinjewadi Pune Brochure.pdfThe Gale at Godrej Park World Hinjewadi Pune Brochure.pdf
The Gale at Godrej Park World Hinjewadi Pune Brochure.pdfPrachiRudram
 

Recently uploaded (20)

Call Girls In Krishna Nagar Delhi (Escort)↫8447779280↬@SHOT 1500- NIGHT 5500→...
Call Girls In Krishna Nagar Delhi (Escort)↫8447779280↬@SHOT 1500- NIGHT 5500→...Call Girls In Krishna Nagar Delhi (Escort)↫8447779280↬@SHOT 1500- NIGHT 5500→...
Call Girls In Krishna Nagar Delhi (Escort)↫8447779280↬@SHOT 1500- NIGHT 5500→...
 
Call Girls In Seelampur Delhi ↬8447779280}Seelampur Escorts Service In Delhi...
Call Girls In Seelampur  Delhi ↬8447779280}Seelampur Escorts Service In Delhi...Call Girls In Seelampur  Delhi ↬8447779280}Seelampur Escorts Service In Delhi...
Call Girls In Seelampur Delhi ↬8447779280}Seelampur Escorts Service In Delhi...
 
Enjoy Night ≽ 8448380779 ≼ Call Girls In Huda City Centre (Gurgaon)
Enjoy Night ≽ 8448380779 ≼ Call Girls In Huda City Centre (Gurgaon)Enjoy Night ≽ 8448380779 ≼ Call Girls In Huda City Centre (Gurgaon)
Enjoy Night ≽ 8448380779 ≼ Call Girls In Huda City Centre (Gurgaon)
 
Kohinoor Flats In Hinjewadi Phase 2 | Homes Built To Suit Your Needs
Kohinoor Flats In Hinjewadi Phase 2 | Homes Built To Suit Your NeedsKohinoor Flats In Hinjewadi Phase 2 | Homes Built To Suit Your Needs
Kohinoor Flats In Hinjewadi Phase 2 | Homes Built To Suit Your Needs
 
BDSM⚡Call Girls in Sector 57 Noida Escorts >༒8448380779 Escort Service
BDSM⚡Call Girls in Sector 57 Noida Escorts >༒8448380779 Escort ServiceBDSM⚡Call Girls in Sector 57 Noida Escorts >༒8448380779 Escort Service
BDSM⚡Call Girls in Sector 57 Noida Escorts >༒8448380779 Escort Service
 
Parksville 96 Surrey Floor Plans May 2024
Parksville 96 Surrey Floor Plans May 2024Parksville 96 Surrey Floor Plans May 2024
Parksville 96 Surrey Floor Plans May 2024
 
9990771857 Call Girls in Dwarka Sector 3 Delhi (Call Girls) Delhi
9990771857 Call Girls in Dwarka Sector 3 Delhi (Call Girls) Delhi9990771857 Call Girls in Dwarka Sector 3 Delhi (Call Girls) Delhi
9990771857 Call Girls in Dwarka Sector 3 Delhi (Call Girls) Delhi
 
2k Shots ≽ 9205541914 ≼ Call Girls In Sainik Farm (Delhi)
2k Shots ≽ 9205541914 ≼ Call Girls In Sainik Farm (Delhi)2k Shots ≽ 9205541914 ≼ Call Girls In Sainik Farm (Delhi)
2k Shots ≽ 9205541914 ≼ Call Girls In Sainik Farm (Delhi)
 
Enjoy Night ≽ 8448380779 ≼ Call Girls In Iffco Chowk (Gurgaon)
Enjoy Night ≽ 8448380779 ≼ Call Girls In Iffco Chowk (Gurgaon)Enjoy Night ≽ 8448380779 ≼ Call Girls In Iffco Chowk (Gurgaon)
Enjoy Night ≽ 8448380779 ≼ Call Girls In Iffco Chowk (Gurgaon)
 
Mahindra Happinest Tathawade Pune Brochure.pdf
Mahindra Happinest Tathawade Pune Brochure.pdfMahindra Happinest Tathawade Pune Brochure.pdf
Mahindra Happinest Tathawade Pune Brochure.pdf
 
Call Girls In Laxmi Nagar Delhi +91-8447779280! !Best Woman Seeking Man Escor...
Call Girls In Laxmi Nagar Delhi +91-8447779280! !Best Woman Seeking Man Escor...Call Girls In Laxmi Nagar Delhi +91-8447779280! !Best Woman Seeking Man Escor...
Call Girls In Laxmi Nagar Delhi +91-8447779280! !Best Woman Seeking Man Escor...
 
Majestique Viman Nagar Pune Brochure.pdf
Majestique Viman Nagar Pune Brochure.pdfMajestique Viman Nagar Pune Brochure.pdf
Majestique Viman Nagar Pune Brochure.pdf
 
M3M The Line Brochure - Premium Investment Opportunity for Commercial Ventures
M3M The Line Brochure - Premium Investment Opportunity for Commercial VenturesM3M The Line Brochure - Premium Investment Opportunity for Commercial Ventures
M3M The Line Brochure - Premium Investment Opportunity for Commercial Ventures
 
Best Deal Virtual Space in Satya The Hive Tata Zudio 750 Sqft 1.89 Cr All inc...
Best Deal Virtual Space in Satya The Hive Tata Zudio 750 Sqft 1.89 Cr All inc...Best Deal Virtual Space in Satya The Hive Tata Zudio 750 Sqft 1.89 Cr All inc...
Best Deal Virtual Space in Satya The Hive Tata Zudio 750 Sqft 1.89 Cr All inc...
 
9990771857 Call Girls in Dwarka Sector 2 Delhi (Call Girls) Delhi
9990771857 Call Girls in Dwarka Sector 2 Delhi (Call Girls) Delhi9990771857 Call Girls in Dwarka Sector 2 Delhi (Call Girls) Delhi
9990771857 Call Girls in Dwarka Sector 2 Delhi (Call Girls) Delhi
 
Purva Soukhyam in Guduvancheri Chennai.pdf
Purva Soukhyam in Guduvancheri Chennai.pdfPurva Soukhyam in Guduvancheri Chennai.pdf
Purva Soukhyam in Guduvancheri Chennai.pdf
 
9990771857 Call Girls in Dwarka Sector 137 Noida (Call Girls) Delhi
9990771857 Call Girls in Dwarka Sector 137 Noida (Call Girls) Delhi9990771857 Call Girls in Dwarka Sector 137 Noida (Call Girls) Delhi
9990771857 Call Girls in Dwarka Sector 137 Noida (Call Girls) Delhi
 
TENANT SCREENING REPORT SERVICES​ How Tenant Screening Reports Work
TENANT SCREENING REPORT SERVICES​ How Tenant Screening Reports WorkTENANT SCREENING REPORT SERVICES​ How Tenant Screening Reports Work
TENANT SCREENING REPORT SERVICES​ How Tenant Screening Reports Work
 
Properties for Sale in Istanbul with Schools and Parks | Antalya Development
Properties for Sale in Istanbul with Schools and Parks | Antalya DevelopmentProperties for Sale in Istanbul with Schools and Parks | Antalya Development
Properties for Sale in Istanbul with Schools and Parks | Antalya Development
 
The Gale at Godrej Park World Hinjewadi Pune Brochure.pdf
The Gale at Godrej Park World Hinjewadi Pune Brochure.pdfThe Gale at Godrej Park World Hinjewadi Pune Brochure.pdf
The Gale at Godrej Park World Hinjewadi Pune Brochure.pdf
 

San Francisco Market Focus Report April 2019

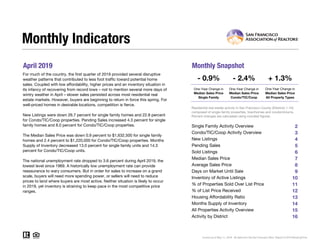
  • 1. April 2019 Monthly Snapshot One-Year Change in One-Year Change in Median Sales Price Single Family Median Sales Price Condo/TIC/Coop 2 3 4 5 6 7 8 9 10 11 12 13 14 15 16 Monthly Indicators - 0.9% - 2.4% + 1.3% One-Year Change in For much of the country, the first quarter of 2019 provided several disruptive weather patterns that contributed to less foot traffic toward potential home sales. Coupled with low affordability, higher prices and an inventory situation in its infancy of recovering from record lows – not to mention several more days of wintry weather in April – slower sales persisted across most residential real estate markets. However, buyers are beginning to return in force this spring. For well-priced homes in desirable locations, competition is fierce. New Listings were down 26.7 percent for single family homes and 22.8 percent for Condo/TIC/Coop properties. Pending Sales increased 4.3 percent for single family homes and 8.0 percent for Condo/TIC/Coop properties. The Median Sales Price was down 0.9 percent to $1,632,500 for single family homes and 2.4 percent to $1,220,000 for Condo/TIC/Coop properties. Months Supply of Inventory decreased 13.0 percent for single family units and 14.3 percent for Condo/TIC/Coop units. The national unemployment rate dropped to 3.6 percent during April 2019, the lowest level since 1969. A historically low unemployment rate can provide reassurance to wary consumers. But in order for sales to increase on a grand scale, buyers will need more spending power, or sellers will need to reduce prices to land where buyers are most active. Neither situation is likely to occur in 2019, yet inventory is straining to keep pace in the most competitive price ranges. Median Sales Price All Property Types Residential real estate activity in San Francisco County (Districts 1-10) composed of single-family properties, townhomes and condominiums. Percent changes are calculated using rounded figures. Single Family Activity Overview Months Supply of Inventory Current as of May 11, 2019. All data from the San Francisco MLS. Report © 2019 ShowingTime. Condo/TIC/Coop Activity Overview Inventory of Active Listings % of Properties Sold Over List Price % of List Price Received Housing Affordability Ratio All Properties Activity Overview New Listings Pending Sales Sold Listings Median Sales Price Average Sales Price Days on Market Until Sale Activity by District
  • 2. Single Family Activity Overview Key metrics by report month and for year-to-date (YTD) starting from the first of the year. Key Metrics Historical Sparkbars 4-2018 4-2019 Percent Change YTD 2018 YTD 2019 Percent Change Current as of May 11, 2019. All data from the San Francisco MLS. Report © 2019 ShowingTime. | 2 Months Supply 2.3 2.0 - 13.0% -- -- -- Affordability Ratio 29 31 + 6.9% % of List Price Received 119.3% 112.6% - 5.6% 116.9% 30 72.3% - 6.1% - 5.0% 32 + 6.7% 111.0% % of Properties Sold Over List Price 77.9% 73.9% - 5.1% 77.0% Active Listings 430 372 - 13.5% -- Avg. Sales Price $2,185,545 $2,258,069 + 3.3% $2,027,769 Days on Market 18 27 + 50.0% 23 29 + 26.1% $2,038,813 -- -- Median Sales Price $1,648,000 $1,632,500 - 0.9% $1,611,000 Sold Listings 190 218 + 14.7% 592 New Listings 270 198 - 26.7% 943 Pending Sales 207 216 + 4.3% - 1.2%667 659 - 14.5%806 602 + 1.7% $1,585,000 - 1.6% + 0.5% 4-2016 4-2017 4-2018 4-2019 4-2016 4-2017 4-2018 4-2019 4-2016 4-2017 4-2018 4-2019 4-2016 4-2017 4-2018 4-2019 4-2016 4-2017 4-2018 4-2019 4-2016 4-2017 4-2018 4-2019 4-2016 4-2017 4-2018 4-2019 4-2016 4-2017 4-2018 4-2019 4-2016 4-2017 4-2018 4-2019 4-2016 4-2017 4-2018 4-2019 4-2016 4-2017 4-2018 4-2019
  • 3. Condo/TIC/Coop Activity Overview Key metrics by report month and for year-to-date (YTD) starting from the first of the year. Key Metrics Historical Sparkbars 4-2018 4-2019 Percent Change YTD 2018 YTD 2019 Percent Change Current as of May 11, 2019. All data from the San Francisco MLS. Report © 2019 ShowingTime. | 3 Months Supply 2.8 2.4 - 14.3% -- -- -- Affordability Ratio 45 48 + 6.7% % of List Price Received 108.9% 104.9% - 3.7% 106.4% 47 53.4% - 7.0% - 2.1% 49 + 4.3% 104.2% % of Properties Sold Over List Price 66.6% 55.3% - 17.0% 57.4% Active Listings 703 586 - 16.6% -- Avg. Sales Price $1,335,639 $1,355,657 + 1.5% $1,329,007 Days on Market 26 39 + 50.0% 33 $1,190,000 - 0.8% + 0.1% 40 + 21.2% $1,330,238 -- -- Sold Listings 296 313 + 5.7% 936 852 - 9.0% Median Sales Price $1,250,000 $1,220,000 - 2.4% $1,200,000 - 15.6% Pending Sales 287 310 + 8.0% 1,027 958 - 6.7% New Listings 378 292 - 22.8% 1,482 1,251 4-2016 4-2017 4-2018 4-2019 4-2016 4-2017 4-2018 4-2019 4-2016 4-2017 4-2018 4-2019 4-2016 4-2017 4-2018 4-2019 4-2016 4-2017 4-2018 4-2019 4-2016 4-2017 4-2018 4-2019 4-2016 4-2017 4-2018 4-2019 4-2016 4-2017 4-2018 4-2019 4-2016 4-2017 4-2018 4-2019 4-2016 4-2017 4-2018 4-2019 4-2016 4-2017 4-2018 4-2019
  • 4. New Listings New Listings Single Family Year-Over-Year Change Condo/TIC/ Coop Year-Over-Year Change May-2018 271 -5.6% 370 +2.5% Jun-2018 266 +11.8% 357 +14.1% Jul-2018 239 +13.3% 259 -5.5% Aug-2018 248 +15.9% 311 +6.1% Sep-2018 337 +12.0% 451 +2.7% Oct-2018 258 +7.9% 342 +4.0% Nov-2018 156 +7.6% 193 -7.7% Dec-2018 80 +2.6% 122 -5.4% Jan-2019 219 +16.5% 348 -5.7% Feb-2019 179 -13.9% 289 -18.8% Mar-2019 210 -24.2% 322 -15.0% Apr-2019 198 -26.7% 292 -22.8% 12-Month Avg 222 +0.2% 305 -4.5% Historical New Listings by Month Current as of May 11, 2019. All data from the San Francisco MLS. Report © 2019 ShowingTime. | 4 A count of the properties that have been newly listed on the market in a given month. 247 286 270 378 198 292 Single Family Condo/TIC/Coop April 0 100 200 300 400 500 600 700 1-2005 1-2006 1-2007 1-2008 1-2009 1-2010 1-2011 1-2012 1-2013 1-2014 1-2015 1-2016 1-2017 1-2018 1-2019 Single Family Condo/TIC/Coop 888 1,295 943 1,482 806 1,251 Single Family Condo/TIC/Coop Year to Date 2017 2018 2019 - 22.8%+ 32.2%- 26.7%+ 9.3% + 14.4%- 14.5%+ 6.2% - 15.6% 2017 2018 2019 2017 2018 2019 2017 2018 2019 - 12.7% - 8.1% - 6.2%- 23.1%
  • 5. Pending Sales Pending Sales Single Family Year-Over-Year Change Condo/TIC/ Coop Year-Over-Year Change May-2018 275 +14.6% 297 -2.9% Jun-2018 203 -18.5% 302 +4.1% Jul-2018 165 -4.6% 247 +18.2% Aug-2018 173 -16.0% 232 +9.4% Sep-2018 193 -5.4% 219 -10.2% Oct-2018 251 +1.2% 291 -11.8% Nov-2018 187 -5.6% 222 -5.1% Dec-2018 121 +13.1% 147 -23.4% Jan-2019 89 +2.3% 123 -31.7% Feb-2019 145 -8.2% 228 +1.8% Mar-2019 209 -2.8% 297 -11.6% Apr-2019 216 +4.3% 310 +8.0% 12-Month Avg 186 -2.8% 243 -4.2% Historical Pending Sales by Month A count of the properties on which offers have been accepted in a given month. Current as of May 11, 2019. All data from the San Francisco MLS. Report © 2019 ShowingTime. | 5 198 225 207 287 216 310 Single Family Condo/TIC/Coop April 0 100 200 300 400 1-2005 1-2006 1-2007 1-2008 1-2009 1-2010 1-2011 1-2012 1-2013 1-2014 1-2015 1-2016 1-2017 1-2018 1-2019 Single Family Condo/TIC/Coop 639 883 667 1,027 659 958 Single Family Condo/TIC/Coop Year to Date 2017 2018 2019 + 8.0%+ 27.6%+ 4.3%+ 4.5% + 16.3%- 1.2%+ 4.4% - 6.7% 2017 2018 2019 2017 2018 2019 2017 2018 2019 - 7.5% + 1.1% + 5.1%- 7.8%
  • 6. Sold Listings Sold Listings Single Family Year-Over-Year Change Condo/TIC/ Coop Year-Over-Year Change May-2018 249 +14.2% 312 +14.7% Jun-2018 231 +0.4% 303 -6.5% Jul-2018 192 -8.6% 273 +14.2% Aug-2018 192 -9.9% 260 +18.7% Sep-2018 146 -17.5% 183 +4.6% Oct-2018 246 +5.1% 293 -5.8% Nov-2018 220 -10.2% 262 -5.8% Dec-2018 160 +7.4% 193 -22.8% Jan-2019 100 +5.3% 114 -23.5% Feb-2019 113 +5.6% 164 -18.8% Mar-2019 171 -14.5% 261 -9.7% Apr-2019 218 +14.7% 313 +5.7% 12-Month Avg 187 -1.3% 244 -2.4% Historical Sold Listings by Month A count of the actual sales that closed in a given month. Current as of May 11, 2019. All data from the San Francisco MLS. Report © 2019 ShowingTime. | 6 203 232 190 296 218 313 Single Family Condo/TIC/Coop April 0 100 200 300 400 1-2005 1-2006 1-2007 1-2008 1-2009 1-2010 1-2011 1-2012 1-2013 1-2014 1-2015 1-2016 1-2017 1-2018 1-2019 Single Family Condo/TIC/Coop 593 826 592 936 602 852 Single Family Condo/TIC/Coop Year to Date 2017 2018 2019 + 5.7%+ 27.6%+ 14.7%- 6.4% + 13.3%+ 1.7%- 0.2% - 9.0% 2017 2018 2019 2017 2018 2019 2017 2018 2019 - 2.9% + 3.5% + 4.6%+ 4.5%
  • 7. Median Sales Price Median Sales Price Single Family Year-Over-Year Change Condo/TIC/ Coop Year-Over-Year Change May-2018 $1,618,888 +9.8% $1,257,500 +7.6% Jun-2018 $1,625,000 +11.2% $1,170,000 +4.0% Jul-2018 $1,626,250 +16.2% $1,150,000 0.0% Aug-2018 $1,544,000 +12.3% $1,234,400 +5.1% Sep-2018 $1,500,000 +13.6% $1,150,000 +5.0% Oct-2018 $1,600,000 +1.6% $1,215,000 +6.6% Nov-2018 $1,427,500 -4.5% $1,198,625 -3.1% Dec-2018 $1,492,500 +2.9% $1,165,000 +4.0% Jan-2019 $1,389,000 +4.4% $1,040,000 -5.5% Feb-2019 $1,500,000 -11.8% $1,130,000 +4.1% Mar-2019 $1,650,000 -2.2% $1,250,000 0.0% Apr-2019 $1,632,500 -0.9% $1,220,000 -2.4% 12-Month Avg* $1,574,901 +6.4% $1,200,000 +2.1% Historical Median Sales Price by Month Point at which half of the sales sold for more and half sold for less, not accounting for seller concessions, in a given month. * Median Sales Price for all properties from May 2018 through April 2019. This is not the average of the individual figures above. Current as of May 11, 2019. All data from the San Francisco MLS. Report © 2019 ShowingTime. | 7 $1,380,000 $1,100,000 $1,648,000 $1,250,000 $1,632,500 $1,220,000 Single Family Condo/TIC/Coop April $400,000 $600,000 $800,000 $1,000,000 $1,200,000 $1,400,000 $1,600,000 $1,800,000 1-2005 1-2006 1-2007 1-2008 1-2009 1-2010 1-2011 1-2012 1-2013 1-2014 1-2015 1-2016 1-2017 1-2018 1-2019 Single Family Condo/TIC/Coop $1,338,000 $1,108,000 $1,611,000 $1,200,000 $1,585,000 $1,190,000 Single Family Condo/TIC/Coop Year to Date 2017 2018 2019 - 2.4%+ 13.6%- 0.9%+ 19.4% + 8.3%- 1.6%+ 20.4% - 0.8% 2017 2018 2019 2017 2018 2019 2017 2018 2019 0.0% + 0.6% + 0.7%- 4.3%
  • 8. Average Sales Price Avg. Sales Price Single Family Year-Over-Year Change Condo/TIC/ Coop Year-Over-Year Change May-2018 $2,020,490 +10.1% $1,399,046 +3.9% Jun-2018 $1,943,346 +12.5% $1,337,494 -1.0% Jul-2018 $1,969,483 +13.3% $1,242,275 -0.1% Aug-2018 $1,834,962 +17.6% $1,347,161 +6.1% Sep-2018 $1,826,997 +13.4% $1,255,936 +3.2% Oct-2018 $2,160,394 +7.9% $1,343,310 +5.3% Nov-2018 $1,864,335 +6.2% $1,266,048 -8.7% Dec-2018 $1,786,072 -6.4% $1,329,356 +5.2% Jan-2019 $1,751,963 -2.0% $1,177,310 -10.9% Feb-2019 $1,871,058 -11.2% $1,363,140 +7.8% Mar-2019 $2,037,898 +4.5% $1,345,875 -1.8% Apr-2019 $2,258,069 +3.3% $1,355,657 +1.5% 12-Month Avg* $1,967,809 +7.2% $1,322,492 +1.0% Historical Average Sales Price by Month Average sales price for all closed sales, not accounting for seller concessions, in a given month. * Avg. Sales Price for all properties from May 2018 through April 2019. This is not the average of the individual figures above. Current as of May 11, 2019. All data from the San Francisco MLS. Report © 2019 ShowingTime. | 8 $1,880,160 $1,296,502 $2,185,545 $1,335,639 $2,258,069 $1,355,657 Single Family Condo/TIC/Coop April $500,000 $1,000,000 $1,500,000 $2,000,000 $2,500,000 1-2005 1-2006 1-2007 1-2008 1-2009 1-2010 1-2011 1-2012 1-2013 1-2014 1-2015 1-2016 1-2017 1-2018 1-2019 Single Family Condo/TIC/Coop $1,802,522 $1,279,028 $2,027,769 $1,329,007 $2,038,813 $1,330,238 Single Family Condo/TIC/Coop Year to Date 2017 2018 2019 + 1.5%+ 3.0%+ 3.3%+ 16.2% + 3.9%+ 0.5%+ 12.5% + 0.1% 2017 2018 2019 2017 2018 2019 2017 2018 2019 + 6.3% + 5.5% + 1.4%- 5.2%
  • 9. Days on Market Until Sale Days on Market Single Family Year-Over-Year Change Condo/TIC/ Coop Year-Over-Year Change May-2018 20 -16.7% 27 -18.2% Jun-2018 18 -33.3% 27 -27.0% Jul-2018 21 -12.5% 31 -6.1% Aug-2018 22 -18.5% 36 -12.2% Sep-2018 23 -17.9% 30 -28.6% Oct-2018 24 +9.1% 27 -12.9% Nov-2018 26 0.0% 38 +8.6% Dec-2018 33 +17.9% 44 -2.2% Jan-2019 39 +18.2% 55 0.0% Feb-2019 29 +31.8% 40 +8.1% Mar-2019 26 +18.2% 34 +30.8% Apr-2019 27 +50.0% 39 +50.0% 12-Month Avg* 25 -0.1% 34 -4.0% Historical Days on Market Until Sale by Month Average number of days between when a property is listed and when an offer is accepted in a given month. * Days on Market for all properties from May 2018 through April 2019. This is not the average of the individual figures above. Current as of May 11, 2019. All data from the San Francisco MLS. Report © 2019 ShowingTime. | 9 26 32 18 2627 39 Single Family Condo/TIC/Coop April 0 20 40 60 80 100 120 1-2005 1-2006 1-2007 1-2008 1-2009 1-2010 1-2011 1-2012 1-2013 1-2014 1-2015 1-2016 1-2017 1-2018 1-2019 Single Family Condo/TIC/Coop 32 38 23 33 29 40 Single Family Condo/TIC/Coop Year to Date 2017 2018 2019 + 50.0%- 18.8%+ 50.0%- 30.8% - 13.2%+ 26.1%- 28.1% + 21.2% 2017 2018 2019 2017 2018 2019 2017 2018 2019 - 18.8% + 3.2% + 5.6%- 15.8%
  • 10. Inventory of Active Listings Active Listings Single Family Year-Over-Year Change Condo/TIC/ Coop Year-Over-Year Change May-2018 403 -6.1% 723 +9.4% Jun-2018 428 +11.5% 714 +16.3% Jul-2018 460 +17.3% 653 +8.3% Aug-2018 485 +31.4% 666 +8.8% Sep-2018 585 +34.8% 843 +11.5% Oct-2018 534 +32.5% 829 +20.5% Nov-2018 452 +39.5% 705 +18.1% Dec-2018 316 +41.1% 497 +19.8% Jan-2019 430 +35.2% 666 +14.8% Feb-2019 431 +22.8% 679 +3.5% Mar-2019 409 +3.8% 647 -1.1% Apr-2019 372 -13.5% 586 -16.6% 12-Month Avg* 442 +19.2% 684 +8.9% Historical Inventory of Active Listings by Month The number of properties available for sale in active status at the end of a given month. * Active Listings for all properties from May 2018 through April 2019. This is not the average of the individual figures above. Current as of May 11, 2019. All data from the San Francisco MLS. Report © 2019 ShowingTime. | 10 415 652 430 703 372 586 Single Family Condo/TIC/Coop April 0 250 500 750 1,000 1,250 1,500 1-2005 1-2006 1-2007 1-2008 1-2009 1-2010 1-2011 1-2012 1-2013 1-2014 1-2015 1-2016 1-2017 1-2018 1-2019 Single Family Condo/TIC/Coop 2017 2018 2019 - 16.6%+ 7.8%- 13.5%+ 3.6% 2017 2018 2019 - 12.8% - 7.3%
  • 11. % of Properties Sold Over List Price % of Properties Sold Over List Price Single Family Year-Over-Year Change Condo/TIC/ Coop Year-Over-Year Change May-2018 84.7% +7.4% 67.6% +10.8% Jun-2018 88.3% +10.4% 68.3% +16.6% Jul-2018 85.4% +4.9% 63.4% +1.0% Aug-2018 80.2% +2.3% 57.7% -4.9% Sep-2018 81.5% -5.1% 63.4% +19.4% Oct-2018 82.5% -1.6% 68.3% +2.6% Nov-2018 73.6% -8.9% 54.2% -7.0% Dec-2018 68.1% -7.0% 46.1% -15.3% Jan-2019 60.0% -14.9% 41.2% +22.6% Feb-2019 77.9% -3.1% 53.0% -10.0% Mar-2019 73.7% -4.9% 56.7% -4.2% Apr-2019 73.9% -5.1% 55.3% -17.0% 12-Month Avg 78.7% -1.1% 59.5% +0.7% Historical % of Properties Sold Over List Price by Month Percentage found when dividing the number of properties sold by properties sold over its original list price, not accounting for seller concessions. * % of Properties Sold Over List Price for all properties from May 2018 through April 2019. This is not the average of the individual figures above. Current as of May 11, 2019. All data from the San Francisco MLS. Report © 2019 ShowingTime. | 11 77.3% 62.1% 77.9% 66.6% 73.9% 55.3% Single Family Condo/TIC/Coop April 0.0% 20.0% 40.0% 60.0% 80.0% 100.0% 1-2005 1-2006 1-2007 1-2008 1-2009 1-2010 1-2011 1-2012 1-2013 1-2014 1-2015 1-2016 1-2017 1-2018 1-2019 Single Family Condo/TIC/Coop 74.0% 56.9% 77.0% 57.4% 72.3% 53.4% Single Family Condo/TIC/Coop Year to Date 2017 2018 2019 - 17.0%+ 7.2%- 5.1%+ 0.8% + 0.9%- 6.1%+ 4.1% - 7.0% 2017 2018 2019 2017 2018 2019 2017 2018 2019 + 2.2% - 4.9% - 6.6%+ 2.8%
  • 12. % of List Price Received % of List Price Received Single Family Year-Over-Year Change Condo/TIC/ Coop Year-Over-Year Change May-2018 119.5% +3.6% 108.4% +2.8% Jun-2018 120.1% +2.8% 107.3% +1.4% Jul-2018 117.2% +0.1% 107.1% +1.0% Aug-2018 114.7% -0.6% 105.6% -0.1% Sep-2018 115.4% -0.8% 106.5% +1.6% Oct-2018 114.0% -1.4% 107.7% +1.0% Nov-2018 111.2% -3.7% 104.1% -0.4% Dec-2018 110.5% -3.3% 102.1% -1.6% Jan-2019 106.0% -5.6% 101.0% -0.7% Feb-2019 112.6% -2.8% 104.2% -0.9% Mar-2019 110.6% -5.9% 104.8% -2.1% Apr-2019 112.6% -5.6% 104.9% -3.7% 12-Month Avg* 114.3% -1.6% 105.7% +0.0% Historical % of List Price Received by Month Percentage found when dividing a property’s sales price by its most recent list price, then taking the average for all properties sold in a given month, not accounting for seller concessions. * % of List Price Received for all properties from May 2018 through April 2019. This is not the average of the individual figures above. Current as of May 11, 2019. All data from the San Francisco MLS. Report © 2019 ShowingTime. | 12 115.4% 105.1% 119.3% 108.9%112.6% 104.9% Single Family Condo/TIC/Coop April 112.8% 104.1% 116.9% 106.4% 111.0% 104.2% Single Family Condo/TIC/Coop Year to Date 90.0% 100.0% 110.0% 120.0% 130.0% 1-2005 1-2006 1-2007 1-2008 1-2009 1-2010 1-2011 1-2012 1-2013 1-2014 1-2015 1-2016 1-2017 1-2018 1-2019 Single Family Condo/TIC/Coop 2017 2018 2019 - 3.7%+ 3.6%- 5.6%+ 3.4% 2017 2018 2019 + 1.9% - 0.1% 2017 2018 2019 - 2.1%+ 2.2%- 5.0%+ 3.6% 2017 2018 2019 - 0.4% - 1.2%
  • 13. Housing Affordability Ratio Affordability Ratio Single Family Year-Over-Year Change Condo/TIC/ Coop Year-Over-Year Change May-2018 30 -14.3% 44 -13.7% Jun-2018 30 -14.3% 48 -9.4% Jul-2018 30 -18.9% 49 -5.8% Aug-2018 31 -18.4% 45 -13.5% Sep-2018 31 -20.5% 47 -14.5% Oct-2018 28 -12.5% 41 -21.2% Nov-2018 32 -8.6% 43 -12.2% Dec-2018 33 -5.7% 48 -9.4% Jan-2019 35 -5.4% 54 +3.8% Feb-2019 33 +13.8% 51 -3.8% Mar-2019 30 +3.4% 46 0.0% Apr-2019 31 +6.9% 48 +6.7% 12-Month Avg* 31 -9.6% 34 -6.0% Historical Housing Affordability Ratio by Month This index measures housing affordability for the region. For example, an index of 120 means the median household income is 120% of what is necessary to qualify for the median-priced home under prevailing interest rates. A higher number means greater affordability. * Affordability Ratio for all properties from May 2018 through April 2019. This is not the average of the individual figures above. Current as of May 11, 2019. All data from the San Francisco MLS. Report © 2019 ShowingTime. | 13 37 54 29 45 31 48 Single Family Condo/TIC/Coop April 20 40 60 80 100 1-2005 1-2006 1-2007 1-2008 1-2009 1-2010 1-2011 1-2012 1-2013 1-2014 1-2015 1-2016 1-2017 1-2018 1-2019 Single Family Condo/TIC/Coop 2017 2018 2019 + 6.7%- 16.7%+ 6.9%- 21.6% 2017 2018 2019 - 2.6% + 1.9% 38 54 30 47 32 49 Single Family Condo/TIC/Coop Year to Date 2017 2018 2019 + 4.3%- 13.0%+ 6.7%- 21.1% 2017 2018 2019 - 2.6% - 3.6%
  • 14. Months Supply of Inventory Months Supply Single Family Year-Over-Year Change Condo/TIC/ Coop Year-Over-Year Change May-2018 2.1 -8.7% 2.9 +3.6% Jun-2018 2.3 +9.5% 2.8 +7.7% Jul-2018 2.4 +14.3% 2.5 -3.8% Aug-2018 2.6 +30.0% 2.6 0.0% Sep-2018 3.1 +34.8% 3.3 +3.1% Oct-2018 2.9 +38.1% 3.3 +17.9% Nov-2018 2.4 +41.2% 2.8 +12.0% Dec-2018 1.7 +41.7% 2.0 +17.6% Jan-2019 2.3 +35.3% 2.7 +12.5% Feb-2019 2.3 +27.8% 2.8 +3.7% Mar-2019 2.2 +4.8% 2.7 +3.8% Apr-2019 2.0 -13.0% 2.4 -14.3% 12-Month Avg* 2.4 +20.1% 2.7 +4.9% Historical Months Supply of Inventory by Month The inventory of homes for sale at the end of a given month, divided by the average monthly pending sales from the last 12 months. * Months Supply for all properties from May 2018 through April 2019. This is not the average of the individual figures above. Current as of May 11, 2019. All data from the San Francisco MLS. Report © 2019 ShowingTime. | 14 2.2 2.8 2.3 2.8 2.0 2.4 Single Family Condo/TIC/Coop April 0.0 2.0 4.0 6.0 8.0 10.0 1-2005 1-2006 1-2007 1-2008 1-2009 1-2010 1-2011 1-2012 1-2013 1-2014 1-2015 1-2016 1-2017 1-2018 1-2019 Single Family Condo/TIC/Coop 2017 2018 2019 - 14.3%0.0%- 13.0%+ 4.5% 2017 2018 2019 - 12.0% - 6.7%
  • 15. All Properties Activity Overview Key metrics by report month and for year-to-date (YTD) starting from the first of the year. Key Metrics Historical Sparkbars 4-2018 4-2019 Percent Change YTD 2018 YTD 2019 Percent Change Current as of May 11, 2019. All data from the San Francisco MLS. Report © 2019 ShowingTime. | 15 Months Supply 2.5 2.2 - 12.0% -- -- -- Affordability Ratio 34 34 0.0% % of List Price Received 113.0% 108.1% - 4.3% 110.5% 35 61.2% - 5.8% - 3.2% 36 + 2.9% 107.0% % of Properties Sold Over List Price 71.0% 62.9% - 11.4% 65.0% Active Listings 1,133 958 - 15.4% -- Avg. Sales Price $1,667,907 $1,726,139 + 3.5% $1,599,731 Days on Market 23 34 + 47.8% 29 $1,350,000 0.0% + 1.5% 35 + 20.7% $1,623,609 -- -- Sold Listings 486 531 + 9.3% 1,528 1,454 - 4.8% Median Sales Price $1,382,500 $1,400,000 + 1.3% $1,350,000 - 15.2% Pending Sales 494 526 + 6.5% 1,694 1,617 - 4.5% New Listings 648 490 - 24.4% 2,425 2,057 4-2016 4-2017 4-2018 4-2019 4-2016 4-2017 4-2018 4-2019 4-2016 4-2017 4-2018 4-2019 4-2016 4-2017 4-2018 4-2019 4-2016 4-2017 4-2018 4-2019 4-2016 4-2017 4-2018 4-2019 4-2016 4-2017 4-2018 4-2019 4-2016 4-2017 4-2018 4-2019 4-2016 4-2017 4-2018 4-2019 4-2016 4-2017 4-2018 4-2019 4-2016 4-2017 4-2018 4-2019
  • 16. Activity by District SF District 1: Northwest (Sea Cliff, Lake, Jordan Park / Laurel Heights, Outer Richmond, Central Richmond, Inner Richmond, Lone Mountain) SF District 2: Central West (Outer Sunset, Central Sunset, Inner Sunset, Outer Parkside, Parkside, Inner Parkside, Golden Gate Heights) SF District 3: Southwest (Pine Lake Park, Lake Shore, Merced Manor, Stonestown, Lakeside, Merced Heights, Ingleside, Ingleside Heights, Oceanview) SF District 4: Twin Peaks W (Forest Hill (& Ext), W Portal, St Francis Wd, Balboa Terr, Mt Dav Manor, Ingleside Terr, Monterey Hts, Wstwd Pk & H'lnds, Shrwd Fst, Miraloma Pk, Dmnd Hts, Mdtwn Terr) SF District 5: Central (Haight Ashbury, Cole Vly / Prnssus Hts, Clarndn Hts, Corona Hts, Twin Pks, Glen Pk, Noe Vly, Eureka Vly / Dolores Hts, Mission Dolores, Duboce Trngl, Buena Vista / Ashbury Hts) SF District 6: Central North (Lower Pacific Heights, Anza Vista, Western Addition, North Panhandle, Alamo Square, Hayes Valley) SF District 7: North (Marina, Cow Hollow, Presidio Heights, Pacific Heights) SF District 8: Northeast (North Waterfront, North Beach, Russian Hill, Telegraph Hill, Nob Hill, Financial District / Barbary Coast, Downtown, Van Ness / Civic Center, Tenderloin) SF District 9: Central East (Yerba Buena, South Beach, South of Market, Mission Bay, Inner Mission, Potrero Hill, Central Waterfront / Dogpatch, Bernal Heights) SF District 10: Southeast (Outer Mission, Mission Terr, Excelsior, Portola, Bayview, Silver Terr, Hunters Pt, Candlestick Pt, Bayview Hts, Little Hollywood, Visitation Vly, Crocker Amazon) 4-2018 4-2019 + / – 4-2018 4-2019 + / – 4-2018 4-2019 + / – 4-2018 4-2019 + / – 4-2018 4-2019 + / – Single Family 1 SF District 1 36 30 -16.7% 18 15 -16.7% $2,037,500 $2,205,000 +8.2% 14 25 +78.6% 2.6 1.8 -30.8% 2 SF District 2 52 42 -19.2% 38 39 +2.6% $1,600,000 $1,600,000 0.0% 14 24 +71.4% 1.6 1.3 -18.8% 3 SF District 3 32 23 -28.1% 11 16 +45.5% $1,325,000 $1,155,500 -12.8% 23 27 +17.4% 2.3 1.8 -21.7% 4 SF District 4 51 36 -29.4% 27 34 +25.9% $1,700,000 $1,760,000 +3.5% 13 33 +153.8% 1.9 1.3 -31.6% 5 SF District 5 68 58 -14.7% 24 34 +41.7% $2,152,500 $2,050,000 -4.8% 21 19 -9.5% 2.6 2.1 -19.2% 6 SF District 6 8 17 +112.5% 2 2 0.0% $3,300,000 $2,622,500 -20.5% 0 14 -- 2.5 4.9 +96.0% 7 SF District 7 42 28 -33.3% 9 15 +66.7% $8,800,000 $6,200,000 -29.5% 16 45 +181.3% 4.8 3.1 -35.4% 8 SF District 8 7 18 +157.1% 2 1 -50.0% $9,305,000 $4,400,000 -52.7% 33 7 -78.8% 2.5 9.5 +280.0% 9 SF District 9 55 45 -18.2% 22 23 +4.5% $1,693,000 $1,600,000 -5.5% 13 29 +123.1% 2.5 2.3 -8.0% 10 SF District 10 79 75 -5.1% 37 39 +5.4% $977,000 $1,025,000 +4.9% 29 24 -17.2% 1.9 2.0 +5.3% Condo/TIC/Coop 1 SF District 1 23 22 -4.3% 19 27 +42.1% $1,525,000 $1,400,000 -8.2% 18 38 +111.1% 1.9 1.5 -21.1% 2 SF District 2 4 5 +25.0% 9 2 -77.8% $1,250,000 $1,387,500 +11.0% 15 15 0.0% 1.1 1.3 +18.2% 3 SF District 3 6 8 +33.3% 5 5 0.0% $1,250,000 $950,000 -24.0% 40 47 +17.5% 2.3 2.7 +17.4% 4 SF District 4 8 9 +12.5% 5 5 0.0% $965,000 $1,100,000 +14.0% 16 41 +156.3% 1.9 1.7 -10.5% 5 SF District 5 91 49 -46.2% 47 45 -4.3% $1,500,000 $1,480,000 -1.3% 18 20 +11.1% 2.4 1.4 -41.7% 6 SF District 6 56 57 +1.8% 31 22 -29.0% $1,150,000 $1,190,000 +3.5% 21 16 -23.8% 2.1 2.8 +33.3% 7 SF District 7 70 52 -25.7% 28 26 -7.1% $1,305,000 $1,537,500 +17.8% 18 38 +111.1% 2.7 2.1 -22.2% 8 SF District 8 152 135 -11.2% 41 64 +56.1% $1,165,000 $999,500 -14.2% 32 54 +68.8% 3.7 3.2 -13.5% 9 SF District 9 273 217 -20.5% 107 112 +4.7% $1,090,000 $1,241,250 +13.9% 34 40 +17.6% 3.0 2.5 -16.7% 10 SF District 10 20 32 +60.0% 4 5 +25.0% $816,500 $815,000 -0.2% 27 80 +196.3% 2.4 5.6 +133.3% Key metrics by report month for the districts of San Fransisco. Current as of May 11, 2019. All data from the San Francisco MLS. Report © 2019 ShowingTime. | 16 Active Listings Sold Listings Median Sales Price Days on Market Months Supply