Putnam Capital Markets Outlook Q2 2013
•
1 like•1,750 views

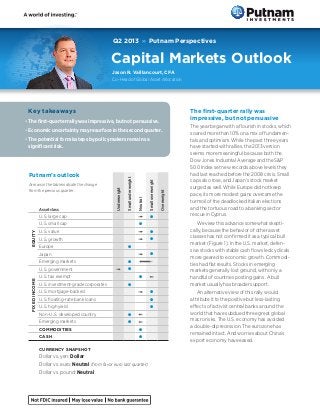
The first-quarter rally was impressive, but not persuasive. Economic uncertainty may resurface in the second quarter. The potential for missteps by policymakers remains a significant risk.

Recommended
Recommended
More Related Content
More from Putnam Investments
More from Putnam Investments (20)
Recently uploaded
Recently uploaded (20)
Putnam Capital Markets Outlook Q2 2013
- 1. Q2 2013 » Putnam Perspectives Capital Markets Outlook Putnam’s outlook Arrows in the table indicate the change from the previous quarter. Underweight Smallunderweight Neutral Smalloverweight Overweight Asset class EQUITY U.S. large cap l U.S. small cap l U.S. value l U.S. growth l Europe l Japan l Emerging markets l FIXEDINCOME U.S. government l U.S. tax exempt l U.S. investment-grade corporates l U.S. mortgage-backed l U.S. floating-rate bank loans l U.S. high yield l Non-U.S. developed country l Emerging markets l COMMODITIES l CASH l CURRENCY SNAPSHOT Dollar vs. yen: Dollar Dollar vs. euro: Neutral (from favor euro last quarter) Dollar vs. pound: Neutral The first-quarter rally was impressive, but not persuasive The year began with a flourish in stocks, which soared more than 10% on a mix of fundamen- tals and optimism. While the past three years have started with rallies, the 2013 version seems more meaningful because both the Dow Jones Industrial Average and the S&P 500 Index set new records above levels they had last reached before the 2008 crisis. Small caps also rose, and Japan’s stock market surged as well. While Europe did not keep pace, its more modest gains overcame the turmoil of the deadlocked Italian elections and the tortuous road to a banking sector rescue in Cyprus. We view this advance somewhat skepti- cally, because the behavior of other asset classes has not confirmed it as a typical bull market (Figure 1). In the U.S. market, defen- sive stocks with stable cash flows led cyclicals more geared to economic growth. Commodi- ties had flat results. Stocks in emerging markets generally lost ground, with only a handful of countries posting gains. A bull market usually has broader support. An alternative view of this rally would attribute it to the positive but less-lasting effects of activist central banks around the world that have subdued three great global macro risks. The U.S. economy has avoided a double-dip recession. The eurozone has remained intact. And worries about China’s export economy have eased. Key takeaways • The first-quarter rally was impressive, but not persuasive. • Economic uncertainty may resurface in the second quarter. • The potential for missteps by policymakers remains a significant risk. Jason R. Vaillancourt, CFA Co-Head of Global Asset Allocation
- 2. 2 Q2 2013 | Capital Markets Outlook From this perspective, the first-quarter rally can be seen as the later innings of global macro risk-normal- ization rather than the beginning of a new upswing in earnings. This view is more consistent with the expansion of stock price multiples in the first quarter. While valua- tions remain reasonable, further price appreciation would be more convincing if it came with the support of greater earnings and revenues. Earnings reports due out in April will be very important. The markets will need to see that the improvement in the global growth environment reflects more than optimism, and that better economic performance is translating into rising earnings. Economic uncertainty may resurface in the second quarter While the U.S. economy merits a degree of optimism, as the recovering housing sector has supported improvement in the labor market and consumer spending, we question the outlook for the balance of 2013. A key indicator in our research reveals that expectations are getting ahead of themselves. The Economic Surprise Index measures the difference between forecasts of several types of economic data and the eventual reports of that data (Figure 2). We do not expect smooth sailing on the horizon. Although first-quarter GDP may have expanded at a 3% annual rate, up from the previous quarter’s 0.4% pace, the economy may hit an air pocket in the second quarter. Figure 1. Q1 U.S. stock rally lacks participation from other risk assets. 90 95 100 105 110 SP GSCI Industrial Metals TR Index SP 500 Index European Periphery Equities/Core Equities U.S. Cyclicals/U.S. Defensives 2/131/13 3/13 Relative weakness in cyclical stocks, European peripheral markets, and commodities cast doubt on the stock market rally. Source: Bloomberg. Past performance is not indicative of future results. Each index is numerically rebased to equal 100 as of 12/31/12. SP GSCI Industrial Metals Total Return Index reflects the industrial metals components of the SP GSCI Index. European Periphery Equities/Core Equities reflects the ratio of the performance of stocks in Italy and Spain to the performance of stocks in Germany and France, with each country represented by Equal Weighted Primary Indices: FTSEMIB (Italy), IBEX (Spain), DAX (Germany), and CAC (France). U.S. Cyclicals/U.S. Defensives reflects the ratio of the performance of stocks in equal-weighted SP GICS sectors, with Cyclicals comprising the consumer discretionary, financials, technology, industrials, mate- rials, and energy sectors, and Defensives comprising the consumer staples, health-care, telecom, and utilities sectors. The full effect of the federal fiscal consolidation now underway — the higher payroll taxes that went into effect at the beginning of the year, and the spending cuts that began in March — will not be clear in economic reports until well into the second quarter. We forecast that federal fiscal consolidation will likely reduce 2013 GDP by about half of one percent. That would not cause a recession, but could undermine growth in corporate earnings. Also, as the calendar moves into the spring months, the seasonal adjustment factors applied to the data become more challenging. Uneven economic data could easily prompt greater market volatility than we saw in the first quarter. Also, we remain concerned about Washington’s failure to reach budget agreements, even if the stock market shrugged off this problem in the first quarter. Both parties expected to negotiate a smarter approach to spending cuts than through the sequester, but it did not happen, and there appears to be no progress on a long-term plan to bring spending and revenues in line. Late in March, Congress quietly extended the continuing resolution that keeps the federal government operating, but this set the stage for a battle over the debt ceiling this summer. A similar showdown in 2011 led to a downgrade of U.S. debt.
- 3. PUTNAM INVESTMENTS | putnam.com 3 The potential for missteps by policymakers remains a significant risk The market context continues to be framed by accommo- dative central bank policy in many regions, which means that, while macro risks have abated, markets remain vulnerable to simple human error. The Fed is likely to soon find itself suffering from winner’s curse. In its December minutes, the Federal Open Market Committee (FOMC) moved the condition- ality of the zero-interest-rate policy from a fixed time horizon — to keep rates low until 2015 — to one that depends on incoming economic data. The key target set by the Fed — an unemployment rate of 6.5%, with contained inflation — has triggered a debate about when and how policy will normalize. Aside from interest rates, the end of the Fed’s Large-Scale Asset Purchase program constitutes a bigger challenge, as a number of variables surround the end of asset purchases, such as timing, pace, and contingencies. Members of the FOMC are already floating ideas in public speeches. The sensitivity of this communication strategy will almost surely elevate both interest-rate and stock market volatility from recent low levels. Outside the United States, European authorities also play an important role in keeping market volatility at bay. The recent handling of the Cyprus bailout prompted yet another set of “unique circumstances,” renewing concerns about the consistency and predictability of eurozone poli- cies. The credibility of the ECB’s guarantee to protect the euro and sovereign credit markets needs to be maintained. Meanwhile, Italy’s political paralysis demonstrates the risks involved with austerity policies. When imposed upon a nation by external authorities, and with a harsh adjustment period, austerity can provoke a backlash. In Europe, it could damage popular support for the common currency. Also, in Asia, the bold moves by the Bank of Japan to reflate the nation’s economy and reinvigorate exports have done wonders for Japanese stocks, but the depreciation of the yen can provoke conflicts in global trading relationships. In addition, geopolitical saber- rattling on the Korean peninsula is another source of global instability, along with the conflicts simmering in the Middle East. Figure 2. Economic Surprise Index suggests optimism is ahead of fundamentals. 97 98 99 100 101 102 103 Output Outlook Surprise Index 1/11 6/1212/116/11 12/12 4/13 The U.S. Economic Surprise Index has been lifted by outlook data, not by actual output. Source: Bloomberg is the source of actual and consensus values, and the calculation of the Surprise Index is a Putnam methodology. Past performance is not indicative of future results. The Outlook component comprises Chicago Purchasing Managers Index, Philadelphia Business Outlook Survey, The Conference Board Consumer Confidence, University of Michigan Consumer Confidence Index, ISM Manufacturing Index, ISM Services Index, and The Conference Board U.S. Leading Indicators. The Output component comprises Advance GDP, industrial production, and U.S. census housing starts.
- 4. 4 Q2 2013 | Capital Markets Outlook Asset class views Equity U.S. equity Domestic equities continued their advance in the first quarter, as investors, relieved that a worst- case fiscal cliff scenario was averted, welcomed 2013 with renewed enthusiasm. Stocks advanced with few meaningful pullbacks and limited volatility. The SP 500 Index and Dow Jones Industrial Average both closed the quarter at record highs, with the Dow marking its best first-quarter return in 15 years. Despite the overall strength of the rally, the leading sectors were defensive ones, including consumer staples and health care. This may be an indication that investors, while willing to return to equi- ties, remain cautious and skeptical about the prospects for U.S. economic growth. With respect to corporate earnings growth, we are seeing some stabilization in estimates, which had been trending downward in each of the past seven quarters. The 2012 fourth quarter also brought some positive revenue surprises for the first time in three quarters. While investors have lower expectations for revenue trends, we believe there is potential for mid- to high-single-digit earnings growth in 2013. In light of the U.S. market’s extended advance, opportunities have narrowed for equity investors today. In contrast to a year ago, when stocks in many sectors were offering considerable valuation dislocations, these anomalies have largely healed themselves. At the same time, we are past the early stages of an economic recovery, in which cyclical sectors rebound from their lows with considerable earnings growth rates. Investment opportunities become less obvious as growth rates converge, correlations decline, and valuations are more similar across the market. Despite — or perhaps because of — the greater stock selection challenges, we remain constructive in our outlook for U.S. equity investment opportunities. Non-U.S. equity One of the most pronounced areas of strength among non-U.S. equities has been Japanese stocks, which have climbed approximately 50% in the past six months. With the yen depreciating versus the U.S. dollar by approximately 20% in the same time frame, Japanese equities have been among the world’s best performers in U.S.-dollar terms. Importantly, a variety of Japanese companies may have become far more competitive in light of the yen’s pronounced decline versus a range of currencies, from the U.S. dollar to the South Korean won. Market share gains, expanding profit margins, and significant earnings growth potential may all now be within reach of Japanese compa- nies, which implies a potentially long runway for growth for selected stocks in this market. China-related stocks performed well for a portion of the fourth quarter, but they have pulled back somewhat in the first quarter of 2013 as business conditions have moderated. There is a debate over whether the source of the slowdown is largely seasonal or secular, but in either case, we may well see continued volatility in China’s growth pattern, which could amplify fluctuations in China- related investments. On balance, Chinese equities are less attractive now than elsewhere in the emerging markets, including Brazil and Southeast Asia, we believe. Figure 3. The sequester is having an impact on the economy. U.S. GDP as of Q4 2012 (updated 1/31/13) Sources: Congressional Budget Office and Bureau of Economic Analysis. The federal sequester will take a small bite from GDP during 2013, but is unlikely to cause a recession. $15.8 trillion Sequester represents less than 1% of U.S. GDP Defense: $42.7 billion Non-defense — discretionary: $28.7B Non-defense — Medicare: $9.9B Non-defense — other: $4.0B
- 5. PUTNAM INVESTMENTS | putnam.com 5 MARKET TRENDS Index name (returns in USD) Q1 13 12 months ended 3/31/13 EQUITY INDEXES Dow Jones Industrial Average 11.93% 13.37% SP 500 10.61 13.96 Nasdaq Composite 6.25 3.72 MSCI World (ND) 7.74 11.86 MSCI EAFE (ND) 5.15 11.27 MSCI Europe (ND) 2.71 10.56 MSCI Emerging Markets (ND) -1.84 1.73 Tokyo Topix 8.72 8.68 Russell 1000 10.96 14.43 Russell 2000 12.39 16.30 Russell 3000 Growth 9.82 10.42 Russell 3000 Value 12.26 18.71 FIXED INCOME INDEXES Barclays U.S. Aggregate Bond -0.12 3.77 Barclays 10-Year Bellwether -0.31 6.20 Barclays Government Bond -0.16 3.01 Barclays MBS -0.05 1.97 Barclays Municipal Bond 0.29 5.25 BofA ML 3-Month T-bill 0.02 0.12 CG World Government Bond ex-U.S. -3.83 -2.16 JPMorgan Developed High Yield 3.13 13.12 JPMorgan Global High Yield 3.01 13.06 JPMorgan Emerging Markets Global Diversified -2.26 10.11 SP LSTA Loan 2.11 7.91 COMMODITIES SP GSCI 0.55 -4.96 It is not possible to invest directly in an index. Past performance is not indicative of future results. European stocks have lagged so far this year, particularly European financials. In the second half of 2012, European stocks led many other markets, partly as a result of expectations that Europe was turning a corner on its debt-related issues. But while the region has generally stabilized due to the creation of a framework that allows policymakers to manage Europe’s debt, politics have shown their potential to upset nearly any fiscal balancing act. In the second quarter, areas of concern for non-U.S. equities include debt problems bringing down European markets; suspicions that the Chinese property market is too frothy; and fears that Japan could slide backward into its longtime deflationary slump. But despite these issues, we see a variety of scenarios in which markets could rise materially from current levels. Particularly against the backdrop of continued low — and not necessarily abso- lutely flat — long-term interest rates, we see the potential for substantially higher price-to-earnings multiples in broad areas of non-U.S. equity markets. Fixed income The first quarter marked a continuation of the rally in so-called spread sectors of the bond markets. By way of background, on January 1, Congress passed last-minute legislation to avoid the across-the-board tax hikes asso- ciated with the fiscal cliff, although no compromise was reached to modify the approximately 2% sequestration spending cuts that began in March. Our own estimates anticipate a negative impact on GDP, but overall we’re forecasting growth in line or slightly above that of 2012. Outside the United States, Europe reclaimed headlines after Italy’s elections failed to produce a majority govern- ment and Cyprus’s banking system, teetering on the brink of collapse, agreed to a substantial restructuring and EU bailout. These events were generally understood to be negative developments on the world stage, but we believe the muted market reaction is telling. As recently as a year ago, such developments would have been much more likely to spark a widespread selloff, with a concurrent flight to U.S. Treasuries — a pattern markets experienced many times during the past few years. The fact that investors have remained more focused on longer-term opportunities rather than the short-term news cycle suggests to us that they are much more attuned to the potential opportunity costs of remaining on the sidelines.
- 6. 6 Q2 2013 | Capital Markets Outlook To that end, we’ve seen significant outflows from cash investments in recent months as investors have moved back into equities and continued to allocate to fixed-income spread sectors, many of which have been experiencing substantial inflows for some time. We believe this type of environment — one in which declining interest rates are not the primary driver of returns and the risk-on/risk-off trade does not overshadow fundamentals in the market — provides an abundance of opportunities for active managers. We believe our holistic, bottom-up approach to securities, sectors, rates, and currencies positions Putnam well for the market environment that we now see unfolding. Tax exempt Within the tax-exempt market, we continue to favor essential service revenue bonds over local general obligation bonds. The BBB-rated segment of the curve continues to offer attractive relative value opportunities, in our analysis, and in terms of maturities, we find 10 to 15 years to be the optimal part of the yield curve in today’s environment. For several months now, we have maintained a slightly higher than normal cash weighting in our portfolios, which has helped to offset some of the recent interest-rate volatility. We anticipate maintaining that stance through the spring, which tends to be a seasonally slower period for new issuance, and which will allow us a greater degree of flexibility as issuance picks back up in the summer months, as historically has been the case. Overall, we maintain our constructive outlook for municipal bonds, though we believe that returns in 2013 will be less about price appreciation and more about coupon income in the tax-exempt market. While spreads are much narrower than they were at their peak, they remain attractive, in our opinion. Technical factors in the market also have been positive — specifically, higher refunding activity and strong investor demand — and we believe that technicals should remain supportive in 2013. Commodities One of the biggest issues in commodity investing over the past several years has been the strong correlation between stocks and the overall commodity asset class. At times, it has seemed like having a separate opinion on commodities was not even worthwhile because the two asset classes moved in tandem. We started to see a degradation of this relationship in 2012, and the first quarter of 2013 confirms it more convincingly. With momentum a signal in our commodity fore- casting process, the more constructive view we had going into 2013 has now diminished considerably. We have an overall neutral view of the asset class, with a slight posi- tive expectation only for the energy sector. An overall positive global economy indicator is now cancelled out by weak emerging-market stock performance and implied demand for resources. Even in gold, which we had favored for some time, we advocate a neutral position. Over the past several years, gold has been seen as a great downside market hedge and a safe-haven asset. But that negative market correla- tion has become the exception. Just as there was a long period of popularity in gold investing driving prices up prior to 2012, we continue to see the reverse trend. We no longer advocate for a position in precious metals relative to any other commodity sectors. Currency With several central banks in developed markets now pursuing highly accommodative monetary policies, it is likely that several currencies could weaken. The Fed’s easy monetary policy would normally lead to a weaker U.S. dollar against most currencies. However, continued improvement in the U.S. labor market is likely to keep currency markets concerned about the timing for ending or tapering off asset purchase programs and providing support to the dollar against the euro, the pound sterling, and the yen.
- 7. PUTNAM INVESTMENTS | putnam.com 7 The euro also appears poised for weakness, we believe. Since 2012, the ECB has helped to mitigate the risk of a eurozone breakup and lowered the euro risk premium. However, the deadlocked Italian elections, the Cyprus bailout, and weaker economic data have reminded the markets that European problems have not been solved. The British pound sterling is among the stronger major currencies, but we still favor a slightly short position. The currency is likely to underperform higher-yielding and higher-credit-quality currencies like the Australian dollar and the Scandinavian currencies. Although the Japanese yen has declined significantly in a relatively short time, we expect continued weakness. At the start of the second quarter, the Bank of Japan announced a massive easing policy, significantly exceeding the market’s already-lofty expectations. This should be viewed as shock and awe, and should keep the yen as primary funding currency for the foreseeable future. We anticipate strength from the Australian dollar. The uncertainty surrounding China’s economy has abated to some extent. Furthermore, the actions of the Fed, the Bank of Japan, and the ECB should be supportive of risk assets, including the Australian dollar. TheBarclaysGovernmentBondIndexisanunmanagedindexofU.S.Treasuryand governmentagencybonds. TheBarclaysMunicipalBondIndexisanunmanagedindexoflong-termfixed-rate investment-gradetax-exemptbonds. TheBarclays10-YearU.S.TreasuryBellwetherIndexisanunmanagedindexofU.S. Treasurybondswith10years’maturity. TheBarclaysU.S.AggregateBondIndexisanunmanagedindexusedasageneral measureofU.S.fixed-incomesecurities. TheBarclaysU.S.Mortgage-BackedSecurities(MBS)Indexcoversagency mortgage-backedpass-throughsecurities(bothfixed-rateandhybridARM)issuedby GinnieMae(GNMA),FannieMae(FNMA),andFreddieMac(FHLMC). TheBofAMerrillLynchU.S.3-MonthTreasuryBillIndexconsistsofU.S.Treasurybills maturingin90days. TheCitigroupNon-U.S.WorldGovernmentBondIndexisanunmanagedindex generallyconsideredtoberepresentativeoftheworldbondmarketexcludingthe UnitedStates. TheDowJonesIndustrialAverageIndex(DJIA)isanunmanagedindexcomposed of30blue-chipstockswhoseonebindingsimilarityistheirhugeness—eachhassales peryearthatexceed$7billion.TheDJIAhasbeenprice-weightedsinceitsinception onMay26,1896,reflectslarge-capcompaniesrepresentativeofU.S.industry,and historicallyhasmovedintandemwithothermajormarketindexessuchastheSP500. TheJPMorganDevelopedHighYieldIndexisanunmanagedindexofhigh-yield fixed-incomesecuritiesissuedindevelopedcountries. TheJPMorganEmergingMarketsGlobalDiversifiedIndexiscomposedofU.S. dollar-denominatedBradybonds,eurobonds,tradedloans,andlocalmarketdebt instrumentsissuedbysovereignandquasi-sovereignentities. JPMorganGlobalHighYieldIndexisanunmanagedindexofglobalhigh-yield fixed-incomesecurities. TheMSCIEAFEIndexisanunmanagedlistofequitysecuritiesfromEuropeand Australasia,withallvaluesexpressedinU.S.dollars. TheMSCIEmergingMarketsIndexisafree-float-adjustedmarket-capitalization- weightedindexthatisdesignedtomeasureequitymarketperformanceintheglobal emergingmarkets. TheMSCIEuropeIndexisanunmanagedlistofequitysecuritiesoriginatinginanyof15 Europeancountries,withallvaluesexpressedinU.S.dollars. TheMSCIWorldIndexisanunmanagedlistofsecuritiesfromdevelopedandemerging markets,withallvaluesexpressedinU.S.dollars. TheNasdaqCompositeIndexisawidelyrecognized,market-capitalization-weighted indexthatisdesignedtorepresenttheperformanceofNasdaqsecuritiesandincludes over3,000stocks. TheRussell1000Indexisanunmanagedindexofthe1,000largestU.S.companies. TheRussell2000Indexisanunmanagedlistofcommonstocksthatisfrequentlyused asageneralperformancemeasureofU.S.stocksofsmalland/ormidsizecompanies. Russell3000GrowthIndexisanunmanagedindexofthosecompaniesinthebroad- marketRussell3000Indexchosenfortheirgrowthorientation. Russell3000ValueIndexisanunmanagedindexofthosecompaniesinthebroad- marketRussell3000Indexchosenfortheirvalueorientation. TheSPGSCIisacompositeindexofcommoditysectorreturnsthatrepresentsa broadlydiversified,unleveraged,long-onlypositionincommodityfutures. TheSP/LSTALeveragedLoanIndex(LLI)isanunmanagedindexofU.S.leveraged loans. TheSP500Indexisanunmanagedlistofcommonstocksthatisfrequentlyusedasa generalmeasureofU.S.stockmarketperformance. TheTokyoStockExchangeIndex(TOPIX)isamarket-capitalization-weightedindexof over1,100stockstradedintheJapanesemarket.
- 8. NOTES This material is provided for limited purposes. It is not intended as an offer or solicitation for the purchase or sale of any financial instrument, or any Putnam product or strategy. References to specific securities, asset classes, and financial markets are for illustrative purposes only and are not intended to be, and should not be interpreted as, recommendations or investment advice. The opinions expressed in this article represent the current, good-faith views of Putnam senior portfolio managers at the time of publication. The views are provided for informational purposes only and are subject to change. This material does not take into account any investor’s particular investment objectives, strategies, tax status, or investment horizon. The views and strategies described herein may not be suitable for all investors. Investors should consult a financial advisor for advice suited to their individual financial needs. Putnam Investments cannot guarantee the accuracy or completeness of any statements or data contained in the article. Predictions, opinions, and other information contained in this article are subject to change. Any forward-looking statements speak only as of the date they are made, and Putnam assumes no duty to update them. Forward-looking statements are subject to numerous assumptions, risks, and uncertainties. Actual results could differ materially from those anticipated. Past performance is not a guarantee of future results. As with any investment, there is a potential for profit as well as the possibility of loss. This presentation or any portion hereof may not be reprinted, sold, or redistributed in whole or in part without the express written consent of Putnam Investments. The information provided relates to Putnam Investments and its affiliates, which include The Putnam Advisory Company, LLC and Putnam Investments Limited®. Prepared for use in Canada by Putnam Investments Inc. [Investissements Putnam Inc.] (o/a Putnam Management in Manitoba). Where permitted, advisory services are provided in Canada by Putnam Investments Inc. [Investissements Putnam Inc.] (o/a Putnam Management in Manitoba) and its affiliate, The Putnam Advisory Company, LLC. Diversification does not assure a profit or protect against loss. It is possible to lose money in a diversified portfolio. In the United States, mutual funds are distributed by Putnam Retail Management. putnam.com CM0100 280919 4/13 Consider these risks before investing: International investing involves certain risks, such as currency fluctuations, economic instability, and political developments. Investments in small and/or midsize companies increase the risk of greater price fluctuations. Bond investments are subject to interest-rate risk, which means the prices of the fund’s bond investments are likely to fall if interest rates rise. Bond investments also are subject to credit risk, which is the risk that the issuer of the bond may default on payment of interest or principal. Interest-rate risk is generally greater for longer-term bonds, and credit risk is generally greater for below-investment-grade bonds, which may be considered speculative. Unlike bonds, funds that invest in bonds have ongoing fees and expenses. Lower-rated bonds may offer higher yields in return for more risk. Funds that invest in government securities are not guaranteed. Mortgage-backed securities are subject to prepayment risk. Commodities involve the risks of changes in market, political, regulatory, and natural conditions. Scan code or visit putnam.com/outlook for more insight on the global investment landscape. Visit putnam.com for news and information, and our Perspectives blog for in-depth analysis on a range of investment topics. If you are a U.S. retail investor, please request a prospectus, or a summary prospectus if available, from your financial representative or by calling Putnam at 1-800-225-1581. The prospectus includes investment objectives, risks, fees, expenses, and other information that you should read and consider carefully before investing.