SlideShare ist ein Scribd-Unternehmen logo
1 von 12
Downloaden Sie, um offline zu lesen
GP Ratio   Mar ' 08 Mar ' 07 Mar ' 06 Mar ' 05 Mar ' 04 Gross Profit 6576.35 5934.01 4782.7 4267.44 3679.34 sales 28,738.30 26664.25 20088.63 17199.17 13028.17 GP Ratio 22.883573 22.25455 23.80799 24.81189 28.241418
Net Profit Ratio   Mar ' 08 Mar ' 07 Mar ' 06 Mar ' 05 Mar ' 04 sales 28,738.30 26664.25 20088.63 17199.17 13028.17 net profit 3,000.91 2586.51 2146.36 2000.05 1727.28 Net Profit Ratio 10.442197 9.700292 10.68445 11.62876 13.25804
Operating ratio   Mar ' 08 Mar ' 07 Mar ' 06 Mar ' 05 Mar ' 04 sales 28,738.30 26664.25 20088.63 17199.17 13028.17 cost of goods sold 22,161.95 20730.24 15305.93 12931.73 9348.83 operating expenses 4,706.84 3,924.55 2945.19 2549.82 2096.95 Operating ratio 93.49 92.46 90.85 90.01 87.85
Debt Equity ratio   Mar ' 08 Mar ' 07 Mar ' 06 Mar ' 05 Mar ' 04 Debt 6,280.52 4,009.14 2,936.84 2,495.42 1,259.77 Equity 14,094.51 10,852.94 8,447.52 6,606.81 4,853.37 Debt Equity ratio 0.4456005 0.369406 0.347657 0.377704 0.259566
Current ratio   Mar ' 08 Mar ' 07 Mar ' 06 Mar ' 05 Mar ' 04 Current Assets 10,781.23 10,318.42 9,812.06 7,248.88 3,835.78 Current Liabilities 12,029.80 8,321.20 7,888.65 7,268.80 5,309.17 Current ratio 0.8962102 1.240016 1.24382 0.99726 0.722482
Fixed Asset T.O ratio   Mar ' 08 Mar ' 07 Mar ' 06 Mar ' 05 Mar ' 04 cost of goods sold 22,161.95 20730.24 15305.93 12931.73 9348.83 fixed Assets 15,337.03 8,845.63 6,509.99 6,608.57 6,304.57 Fixed Asset T.O ratio 1.4449962 2.343557 2.351145 1.956812 1.4828656
Return on networth   Mar ' 08 Mar ' 07 Mar ' 06 Mar ' 05 Mar ' 04 net profit 3,000.91 2586.51 2146.36 2000.05 1727.28 Equity 14,094.51 10,852.94 8,447.52 6,606.81 4,853.37 Return on networth 21.29134 23.83234 25.40817 30.27255 35.589292
Profit and Loss A/c Income:  Operating income  28,738.30 26,664.25 20,088.63 17,199.17 13,028.17 Expenses   Material consumed  20,931.81 19,529.88 14,376.11 12,101.28 8,720.10 Manufacturing expenses  1,230.14 1,200.36 929.82 830.45 628.73 Personnel expenses 1,544.57 1,367.83 1,143.13 1,039.34 882.49 Selling expenses 1,179.48 1,068.56 759.54 598.75 455.56 Adminstrative expenses 1,982.79 1,488.16 1,042.52 911.73 758.9 Expenses capitalised -1,131.40 -577.05 -308.85 -282.43 -144.89 Cost of sales 25,737.39 24,077.74 17,942.27 15,199.12 11,300.89 Operating profit 3,000.91 2,586.51 2,146.36 2,000.05 1,727.28 Other recurring income 389.03 887.23 685.18 399.94 235.65 Adjusted PBDIT 3,389.94 3,473.74 2,831.54 2,399.99 1,962.93 Financial expenses 471.56 455.75 350.24 234.3 225.96 Depreciation  652.31 586.29 520.94 450.16 382.6
Cntd… Other write offs 64.35 85.02 73.78 67.12 51.64 Adjusted PBT 2,201.72 2,346.68 1,886.58 1,648.41 1,302.73 Tax charges  547.55 660.37 524.93 415.5 482.55 Adjusted PAT    1,654.17    1,686.31    1,361.65    1,232.91    820.18 Non recurring items 374.75 227.15 167.23 4.04 -6.82 Other non cash adjustments - -0.07 - -1.54 -3.02 Reported net profit 2,028.92 1,913.39 1,528.88 1,235.41 810.34 Earnigs before appropriation 3,042.75 2,690.15 2,094.54 1,601.21 934.05 Equity dividend 578.43 578.07 497.94 452.19 282.11 Preference dividend - - - - - Dividend tax 81.25 98.25 69.84 63.42 36.14 Retained earnings 2,383.07 2,013.83 1,526.76 1,085.60 615.8
Balance sheet Sources of funds Owner's fund Equity share capital 385.54 385.41 382.87 361.79 353 Share application money - - - - 3.83 Preference share capital - - - - - Reserves & surplus 7,428.45 6,458.39 5,127.81 3,749.60 3,236.77 Loan funds Secured loans 2,461.99 2,022.04 822.76 489.81 942.65 Unsecured loans 3,818.53 1,987.10 2,114.08 2,005.61 317.12 Total 14,094.51 10,852.94 8,447.52 6,606.81 4,853.37
Uses of funds Fixed assets Gross block 10,830.83 8,775.80 7,971.55 6,611.95 5,985.40 Less : revaluation reserve 25.51 25.95 26.39 - - Less : accumulated depreciation 5,443.52 4,894.54 4,401.51 3,454.28 3,023.69 Net block 5,361.80 3,855.31 3,543.65 3,157.67 2,961.71 Capital work-in-progress 5,064.96 2,513.32 951.19 538.84 286.09 Investments 4,910.27 2,477.00 2,015.15 2,912.06 3,056.77 Net current assets Current assets, loans & advances 10,781.23 10,318.42 9,812.06 7,248.88 3,835.78 Less : current liabilities & provisions 12,029.80 8,321.20 7,888.65 7,268.80 5,309.17 Total net current assets -1,248.57 1,997.22 1,923.41 -19.92 -1,473.39 Miscellaneous expenses not written 6.05 10.09 14.12 18.16 22.19 Total 14,094.51 10,852.94 8,447.52 6,606.81 4,853.37
Notes: Book value of unquoted investments 4,145.82 2,117.86 1,648.57 2,480.15 2,778.87 Market value of quoted investments 2,530.55 1,323.08 1,550.00 1,260.05 732.76 Contingent liabilities 5,590.83 5,196.07 2,185.63 1,450.32 896.07 Number of equity sharesoutstanding (Lacs) 3855.04 3853.74 3828.34 3617.52 3529.58

Weitere ähnliche Inhalte

Was ist angesagt?

Ratio analysis at il&fs invest smart mba project finance
Ratio analysis at il&fs invest smart mba project financeRatio analysis at il&fs invest smart mba project finance
Ratio analysis at il&fs invest smart mba project financeBabasab Patil
 
Financial Ratio Analysis of Samsung for the year 2013-2014
Financial Ratio Analysis of Samsung for the year 2013-2014Financial Ratio Analysis of Samsung for the year 2013-2014
Financial Ratio Analysis of Samsung for the year 2013-2014Prinson Rodrigues
 
A project report on financial statement analysis
A project report on financial statement analysisA project report on financial statement analysis
A project report on financial statement analysisProjects Kart
 
Sip Project Report
Sip Project ReportSip Project Report
Sip Project Reportspragyaa
 
3 years comparative ratio, trend analysis and common size statement of bajaj ...
3 years comparative ratio, trend analysis and common size statement of bajaj ...3 years comparative ratio, trend analysis and common size statement of bajaj ...
3 years comparative ratio, trend analysis and common size statement of bajaj ...Jay Savani
 
Training and Development in Infosys
Training and Development in InfosysTraining and Development in Infosys
Training and Development in InfosysPriyanka Banerjee
 
infosys hr policies
infosys hr policiesinfosys hr policies
infosys hr policiesSneha Joy
 
Corporate Social Responsibility Activities of Tata Group
Corporate Social Responsibility Activities of Tata GroupCorporate Social Responsibility Activities of Tata Group
Corporate Social Responsibility Activities of Tata GroupManjit Singh
 
Company Analysis - TCS (Tata Consultancy Services)
Company Analysis - TCS (Tata Consultancy Services)Company Analysis - TCS (Tata Consultancy Services)
Company Analysis - TCS (Tata Consultancy Services)Kaustubh Barve
 
Reliance industries analysis
Reliance industries analysisReliance industries analysis
Reliance industries analysisMOHAMMED SAQIB
 
TRAININGg & DEVELOPMENT at tata group and tata motors
TRAININGg & DEVELOPMENT  at tata group and tata motorsTRAININGg & DEVELOPMENT  at tata group and tata motors
TRAININGg & DEVELOPMENT at tata group and tata motorsUsha Bhadoria
 
Comparative statement of reliance industries ltd
Comparative statement of reliance industries ltdComparative statement of reliance industries ltd
Comparative statement of reliance industries ltdvijay jha
 
Project report titles for mba in accounting
Project report titles for mba in accountingProject report titles for mba in accounting
Project report titles for mba in accountingmbaprojectconsultacy2014
 
Majestica Hotel in Shanghai? - Managing Global Alliances
Majestica Hotel in Shanghai? - Managing Global AlliancesMajestica Hotel in Shanghai? - Managing Global Alliances
Majestica Hotel in Shanghai? - Managing Global AlliancesPhuong Pham
 

Was ist angesagt? (20)

Ratio analysis project presentation
Ratio analysis project presentationRatio analysis project presentation
Ratio analysis project presentation
 
Ratio analysis at il&fs invest smart mba project finance
Ratio analysis at il&fs invest smart mba project financeRatio analysis at il&fs invest smart mba project finance
Ratio analysis at il&fs invest smart mba project finance
 
E-Global Business.doc
E-Global Business.docE-Global Business.doc
E-Global Business.doc
 
Financial Ratio Analysis of Samsung for the year 2013-2014
Financial Ratio Analysis of Samsung for the year 2013-2014Financial Ratio Analysis of Samsung for the year 2013-2014
Financial Ratio Analysis of Samsung for the year 2013-2014
 
Rebranding zee tv
Rebranding zee tvRebranding zee tv
Rebranding zee tv
 
A project report on financial statement analysis
A project report on financial statement analysisA project report on financial statement analysis
A project report on financial statement analysis
 
Sip Project Report
Sip Project ReportSip Project Report
Sip Project Report
 
3 years comparative ratio, trend analysis and common size statement of bajaj ...
3 years comparative ratio, trend analysis and common size statement of bajaj ...3 years comparative ratio, trend analysis and common size statement of bajaj ...
3 years comparative ratio, trend analysis and common size statement of bajaj ...
 
Training and Development in Infosys
Training and Development in InfosysTraining and Development in Infosys
Training and Development in Infosys
 
infosys hr policies
infosys hr policiesinfosys hr policies
infosys hr policies
 
Corporate Social Responsibility Activities of Tata Group
Corporate Social Responsibility Activities of Tata GroupCorporate Social Responsibility Activities of Tata Group
Corporate Social Responsibility Activities of Tata Group
 
Company Analysis - TCS (Tata Consultancy Services)
Company Analysis - TCS (Tata Consultancy Services)Company Analysis - TCS (Tata Consultancy Services)
Company Analysis - TCS (Tata Consultancy Services)
 
Reliance industries analysis
Reliance industries analysisReliance industries analysis
Reliance industries analysis
 
Infosys training design
Infosys training design Infosys training design
Infosys training design
 
TRAININGg & DEVELOPMENT at tata group and tata motors
TRAININGg & DEVELOPMENT  at tata group and tata motorsTRAININGg & DEVELOPMENT  at tata group and tata motors
TRAININGg & DEVELOPMENT at tata group and tata motors
 
Comparative statement of reliance industries ltd
Comparative statement of reliance industries ltdComparative statement of reliance industries ltd
Comparative statement of reliance industries ltd
 
A study on OCTAPACE culture
A study on OCTAPACE cultureA study on OCTAPACE culture
A study on OCTAPACE culture
 
Dabur
DaburDabur
Dabur
 
Project report titles for mba in accounting
Project report titles for mba in accountingProject report titles for mba in accounting
Project report titles for mba in accounting
 
Majestica Hotel in Shanghai? - Managing Global Alliances
Majestica Hotel in Shanghai? - Managing Global AlliancesMajestica Hotel in Shanghai? - Managing Global Alliances
Majestica Hotel in Shanghai? - Managing Global Alliances
 

Ähnlich wie Tata Motors Ratio Analysis

Wipro – Ratio Analysis
Wipro – Ratio AnalysisWipro – Ratio Analysis
Wipro – Ratio AnalysisJitendra
 
Excel Model for Valuation of Natural Gas Firm
Excel Model for Valuation of Natural Gas FirmExcel Model for Valuation of Natural Gas Firm
Excel Model for Valuation of Natural Gas FirmFlevy.com Best Practices
 
Bajaj finserv
Bajaj finservBajaj finserv
Bajaj finservRavi Teja
 
Tata Motors Capital Structure
Tata Motors Capital StructureTata Motors Capital Structure
Tata Motors Capital Structureitsvineeth209
 
Insurance financial statement analysis
Insurance financial statement analysisInsurance financial statement analysis
Insurance financial statement analysisGiulio Velliscig
 
Valuation Of ASHOK LEYLAND
Valuation Of ASHOK LEYLANDValuation Of ASHOK LEYLAND
Valuation Of ASHOK LEYLANDAakash Singh
 
Williams sonoma model
Williams sonoma model Williams sonoma model
Williams sonoma model Trishala Rasya
 
Jsw Ipo
Jsw IpoJsw Ipo
Jsw IpoKunal
 
Surya roshini blncsheet
Surya roshini blncsheetSurya roshini blncsheet
Surya roshini blncsheetnaughtiegirl
 
OdontoPrev ODPV3.BZ - 1Q12
OdontoPrev ODPV3.BZ - 1Q12OdontoPrev ODPV3.BZ - 1Q12
OdontoPrev ODPV3.BZ - 1Q12Rafael Marzocchi
 
Financial Analysis of HBL and Faysal Bank
Financial Analysis of HBL and Faysal BankFinancial Analysis of HBL and Faysal Bank
Financial Analysis of HBL and Faysal Bankadeel laghari
 
Reliance Industries ltd. data & analysis
Reliance Industries ltd. data & analysisReliance Industries ltd. data & analysis
Reliance Industries ltd. data & analysisPankaj Sharma
 
Valuation of Indian hospitality industry
Valuation of Indian hospitality industryValuation of Indian hospitality industry
Valuation of Indian hospitality industryShivani Chaluvadi
 

Ähnlich wie Tata Motors Ratio Analysis (20)

Wipro – Ratio Analysis
Wipro – Ratio AnalysisWipro – Ratio Analysis
Wipro – Ratio Analysis
 
Credit Analysis of HCC Excel
Credit Analysis of HCC ExcelCredit Analysis of HCC Excel
Credit Analysis of HCC Excel
 
Final Project - Complete
Final Project - CompleteFinal Project - Complete
Final Project - Complete
 
Excel Model for Valuation of Natural Gas Firm
Excel Model for Valuation of Natural Gas FirmExcel Model for Valuation of Natural Gas Firm
Excel Model for Valuation of Natural Gas Firm
 
Bajaj finserv
Bajaj finservBajaj finserv
Bajaj finserv
 
Tata Motors Capital Structure
Tata Motors Capital StructureTata Motors Capital Structure
Tata Motors Capital Structure
 
Insurance financial statement analysis
Insurance financial statement analysisInsurance financial statement analysis
Insurance financial statement analysis
 
Valuation Of ASHOK LEYLAND
Valuation Of ASHOK LEYLANDValuation Of ASHOK LEYLAND
Valuation Of ASHOK LEYLAND
 
Williams sonoma model
Williams sonoma model Williams sonoma model
Williams sonoma model
 
Jsw Ipo
Jsw IpoJsw Ipo
Jsw Ipo
 
INVESTAURA_Business-Planning-Template.pdf
INVESTAURA_Business-Planning-Template.pdfINVESTAURA_Business-Planning-Template.pdf
INVESTAURA_Business-Planning-Template.pdf
 
Surya roshini blncsheet
Surya roshini blncsheetSurya roshini blncsheet
Surya roshini blncsheet
 
OdontoPrev ODPV3.BZ - 1Q12
OdontoPrev ODPV3.BZ - 1Q12OdontoPrev ODPV3.BZ - 1Q12
OdontoPrev ODPV3.BZ - 1Q12
 
Hul p&l account
Hul p&l accountHul p&l account
Hul p&l account
 
Grasim
GrasimGrasim
Grasim
 
Financial Analysis of HBL and Faysal Bank
Financial Analysis of HBL and Faysal BankFinancial Analysis of HBL and Faysal Bank
Financial Analysis of HBL and Faysal Bank
 
Roll no..18.
Roll no..18.Roll no..18.
Roll no..18.
 
DABUR- DONE BY SNEHA
DABUR- DONE BY SNEHADABUR- DONE BY SNEHA
DABUR- DONE BY SNEHA
 
Reliance Industries ltd. data & analysis
Reliance Industries ltd. data & analysisReliance Industries ltd. data & analysis
Reliance Industries ltd. data & analysis
 
Valuation of Indian hospitality industry
Valuation of Indian hospitality industryValuation of Indian hospitality industry
Valuation of Indian hospitality industry
 

Mehr von purval

Retail Sector In India
Retail Sector In IndiaRetail Sector In India
Retail Sector In Indiapurval
 
Ethics And Functional Areas Finance
Ethics And  Functional Areas  FinanceEthics And  Functional Areas  Finance
Ethics And Functional Areas Financepurval
 
Ethics And Functional Areas H R M
Ethics And  Functional Areas  H R MEthics And  Functional Areas  H R M
Ethics And Functional Areas H R Mpurval
 
Company C S R
Company  C S RCompany  C S R
Company C S Rpurval
 
C G Transparency
C G  TransparencyC G  Transparency
C G Transparencypurval
 
Clause 49
Clause 49Clause 49
Clause 49purval
 
Business Ethics
Business  EthicsBusiness  Ethics
Business Ethicspurval
 
C G Intro
C G  IntroC G  Intro
C G Intropurval
 
Trouble
TroubleTrouble
Troublepurval
 
Role Of C E O In C G
Role Of  C E O In  C GRole Of  C E O In  C G
Role Of C E O In C Gpurval
 
C S R Intro
C S R  IntroC S R  Intro
C S R Intropurval
 
I T C 1
I T C 1I T C 1
I T C 1purval
 
Carroll Model
Carroll  ModelCarroll  Model
Carroll Modelpurval
 
U S C G
U S  C GU S  C G
U S C Gpurval
 
Ethics And Functional Areas Prod
Ethics And  Functional Areas   ProdEthics And  Functional Areas   Prod
Ethics And Functional Areas Prodpurval
 
Ethical Dilemma
Ethical  DilemmaEthical  Dilemma
Ethical Dilemmapurval
 
C G Code
C G  CodeC G  Code
C G Codepurval
 
Corp Ethical Behavior
Corp  Ethical BehaviorCorp  Ethical Behavior
Corp Ethical Behaviorpurval
 
C S R First World Report
C S R  First  World  ReportC S R  First  World  Report
C S R First World Reportpurval
 
Ethics And Functional Areas Mktg
Ethics And  Functional Areas    MktgEthics And  Functional Areas    Mktg
Ethics And Functional Areas Mktgpurval
 

Mehr von purval (20)

Retail Sector In India
Retail Sector In IndiaRetail Sector In India
Retail Sector In India
 
Ethics And Functional Areas Finance
Ethics And  Functional Areas  FinanceEthics And  Functional Areas  Finance
Ethics And Functional Areas Finance
 
Ethics And Functional Areas H R M
Ethics And  Functional Areas  H R MEthics And  Functional Areas  H R M
Ethics And Functional Areas H R M
 
Company C S R
Company  C S RCompany  C S R
Company C S R
 
C G Transparency
C G  TransparencyC G  Transparency
C G Transparency
 
Clause 49
Clause 49Clause 49
Clause 49
 
Business Ethics
Business  EthicsBusiness  Ethics
Business Ethics
 
C G Intro
C G  IntroC G  Intro
C G Intro
 
Trouble
TroubleTrouble
Trouble
 
Role Of C E O In C G
Role Of  C E O In  C GRole Of  C E O In  C G
Role Of C E O In C G
 
C S R Intro
C S R  IntroC S R  Intro
C S R Intro
 
I T C 1
I T C 1I T C 1
I T C 1
 
Carroll Model
Carroll  ModelCarroll  Model
Carroll Model
 
U S C G
U S  C GU S  C G
U S C G
 
Ethics And Functional Areas Prod
Ethics And  Functional Areas   ProdEthics And  Functional Areas   Prod
Ethics And Functional Areas Prod
 
Ethical Dilemma
Ethical  DilemmaEthical  Dilemma
Ethical Dilemma
 
C G Code
C G  CodeC G  Code
C G Code
 
Corp Ethical Behavior
Corp  Ethical BehaviorCorp  Ethical Behavior
Corp Ethical Behavior
 
C S R First World Report
C S R  First  World  ReportC S R  First  World  Report
C S R First World Report
 
Ethics And Functional Areas Mktg
Ethics And  Functional Areas    MktgEthics And  Functional Areas    Mktg
Ethics And Functional Areas Mktg
 

Kürzlich hochgeladen

Unleashing Real-time Insights with ClickHouse_ Navigating the Landscape in 20...
Unleashing Real-time Insights with ClickHouse_ Navigating the Landscape in 20...Unleashing Real-time Insights with ClickHouse_ Navigating the Landscape in 20...
Unleashing Real-time Insights with ClickHouse_ Navigating the Landscape in 20...Alkin Tezuysal
 
Landscape Catalogue 2024 Australia-1.pdf
Landscape Catalogue 2024 Australia-1.pdfLandscape Catalogue 2024 Australia-1.pdf
Landscape Catalogue 2024 Australia-1.pdfAarwolf Industries LLC
 
Design pattern talk by Kaya Weers - 2024 (v2)
Design pattern talk by Kaya Weers - 2024 (v2)Design pattern talk by Kaya Weers - 2024 (v2)
Design pattern talk by Kaya Weers - 2024 (v2)Kaya Weers
 
UiPath Community: Communication Mining from Zero to Hero
UiPath Community: Communication Mining from Zero to HeroUiPath Community: Communication Mining from Zero to Hero
UiPath Community: Communication Mining from Zero to HeroUiPathCommunity
 
The State of Passkeys with FIDO Alliance.pptx
The State of Passkeys with FIDO Alliance.pptxThe State of Passkeys with FIDO Alliance.pptx
The State of Passkeys with FIDO Alliance.pptxLoriGlavin3
 
React JS; all concepts. Contains React Features, JSX, functional & Class comp...
React JS; all concepts. Contains React Features, JSX, functional & Class comp...React JS; all concepts. Contains React Features, JSX, functional & Class comp...
React JS; all concepts. Contains React Features, JSX, functional & Class comp...Karmanjay Verma
 
Microservices, Docker deploy and Microservices source code in C#
Microservices, Docker deploy and Microservices source code in C#Microservices, Docker deploy and Microservices source code in C#
Microservices, Docker deploy and Microservices source code in C#Karmanjay Verma
 
Tampa BSides - The No BS SOC (slides from April 6, 2024 talk)
Tampa BSides - The No BS SOC (slides from April 6, 2024 talk)Tampa BSides - The No BS SOC (slides from April 6, 2024 talk)
Tampa BSides - The No BS SOC (slides from April 6, 2024 talk)Mark Simos
 
Microsoft 365 Copilot: How to boost your productivity with AI – Part one: Ado...
Microsoft 365 Copilot: How to boost your productivity with AI – Part one: Ado...Microsoft 365 Copilot: How to boost your productivity with AI – Part one: Ado...
Microsoft 365 Copilot: How to boost your productivity with AI – Part one: Ado...Nikki Chapple
 
React Native vs Ionic - The Best Mobile App Framework
React Native vs Ionic - The Best Mobile App FrameworkReact Native vs Ionic - The Best Mobile App Framework
React Native vs Ionic - The Best Mobile App FrameworkPixlogix Infotech
 
A Journey Into the Emotions of Software Developers
A Journey Into the Emotions of Software DevelopersA Journey Into the Emotions of Software Developers
A Journey Into the Emotions of Software DevelopersNicole Novielli
 
Connecting the Dots for Information Discovery.pdf
Connecting the Dots for Information Discovery.pdfConnecting the Dots for Information Discovery.pdf
Connecting the Dots for Information Discovery.pdfNeo4j
 
A Glance At The Java Performance Toolbox
A Glance At The Java Performance ToolboxA Glance At The Java Performance Toolbox
A Glance At The Java Performance ToolboxAna-Maria Mihalceanu
 
Genislab builds better products and faster go-to-market with Lean project man...
Genislab builds better products and faster go-to-market with Lean project man...Genislab builds better products and faster go-to-market with Lean project man...
Genislab builds better products and faster go-to-market with Lean project man...Farhan Tariq
 
Moving Beyond Passwords: FIDO Paris Seminar.pdf
Moving Beyond Passwords: FIDO Paris Seminar.pdfMoving Beyond Passwords: FIDO Paris Seminar.pdf
Moving Beyond Passwords: FIDO Paris Seminar.pdfLoriGlavin3
 
All These Sophisticated Attacks, Can We Really Detect Them - PDF
All These Sophisticated Attacks, Can We Really Detect Them - PDFAll These Sophisticated Attacks, Can We Really Detect Them - PDF
All These Sophisticated Attacks, Can We Really Detect Them - PDFMichael Gough
 
Long journey of Ruby standard library at RubyConf AU 2024
Long journey of Ruby standard library at RubyConf AU 2024Long journey of Ruby standard library at RubyConf AU 2024
Long journey of Ruby standard library at RubyConf AU 2024Hiroshi SHIBATA
 
Decarbonising Buildings: Making a net-zero built environment a reality
Decarbonising Buildings: Making a net-zero built environment a realityDecarbonising Buildings: Making a net-zero built environment a reality
Decarbonising Buildings: Making a net-zero built environment a realityIES VE
 
Generative Artificial Intelligence: How generative AI works.pdf
Generative Artificial Intelligence: How generative AI works.pdfGenerative Artificial Intelligence: How generative AI works.pdf
Generative Artificial Intelligence: How generative AI works.pdfIngrid Airi González
 
Top 10 Hubspot Development Companies in 2024
Top 10 Hubspot Development Companies in 2024Top 10 Hubspot Development Companies in 2024
Top 10 Hubspot Development Companies in 2024TopCSSGallery
 

Kürzlich hochgeladen (20)

Unleashing Real-time Insights with ClickHouse_ Navigating the Landscape in 20...
Unleashing Real-time Insights with ClickHouse_ Navigating the Landscape in 20...Unleashing Real-time Insights with ClickHouse_ Navigating the Landscape in 20...
Unleashing Real-time Insights with ClickHouse_ Navigating the Landscape in 20...
 
Landscape Catalogue 2024 Australia-1.pdf
Landscape Catalogue 2024 Australia-1.pdfLandscape Catalogue 2024 Australia-1.pdf
Landscape Catalogue 2024 Australia-1.pdf
 
Design pattern talk by Kaya Weers - 2024 (v2)
Design pattern talk by Kaya Weers - 2024 (v2)Design pattern talk by Kaya Weers - 2024 (v2)
Design pattern talk by Kaya Weers - 2024 (v2)
 
UiPath Community: Communication Mining from Zero to Hero
UiPath Community: Communication Mining from Zero to HeroUiPath Community: Communication Mining from Zero to Hero
UiPath Community: Communication Mining from Zero to Hero
 
The State of Passkeys with FIDO Alliance.pptx
The State of Passkeys with FIDO Alliance.pptxThe State of Passkeys with FIDO Alliance.pptx
The State of Passkeys with FIDO Alliance.pptx
 
React JS; all concepts. Contains React Features, JSX, functional & Class comp...
React JS; all concepts. Contains React Features, JSX, functional & Class comp...React JS; all concepts. Contains React Features, JSX, functional & Class comp...
React JS; all concepts. Contains React Features, JSX, functional & Class comp...
 
Microservices, Docker deploy and Microservices source code in C#
Microservices, Docker deploy and Microservices source code in C#Microservices, Docker deploy and Microservices source code in C#
Microservices, Docker deploy and Microservices source code in C#
 
Tampa BSides - The No BS SOC (slides from April 6, 2024 talk)
Tampa BSides - The No BS SOC (slides from April 6, 2024 talk)Tampa BSides - The No BS SOC (slides from April 6, 2024 talk)
Tampa BSides - The No BS SOC (slides from April 6, 2024 talk)
 
Microsoft 365 Copilot: How to boost your productivity with AI – Part one: Ado...
Microsoft 365 Copilot: How to boost your productivity with AI – Part one: Ado...Microsoft 365 Copilot: How to boost your productivity with AI – Part one: Ado...
Microsoft 365 Copilot: How to boost your productivity with AI – Part one: Ado...
 
React Native vs Ionic - The Best Mobile App Framework
React Native vs Ionic - The Best Mobile App FrameworkReact Native vs Ionic - The Best Mobile App Framework
React Native vs Ionic - The Best Mobile App Framework
 
A Journey Into the Emotions of Software Developers
A Journey Into the Emotions of Software DevelopersA Journey Into the Emotions of Software Developers
A Journey Into the Emotions of Software Developers
 
Connecting the Dots for Information Discovery.pdf
Connecting the Dots for Information Discovery.pdfConnecting the Dots for Information Discovery.pdf
Connecting the Dots for Information Discovery.pdf
 
A Glance At The Java Performance Toolbox
A Glance At The Java Performance ToolboxA Glance At The Java Performance Toolbox
A Glance At The Java Performance Toolbox
 
Genislab builds better products and faster go-to-market with Lean project man...
Genislab builds better products and faster go-to-market with Lean project man...Genislab builds better products and faster go-to-market with Lean project man...
Genislab builds better products and faster go-to-market with Lean project man...
 
Moving Beyond Passwords: FIDO Paris Seminar.pdf
Moving Beyond Passwords: FIDO Paris Seminar.pdfMoving Beyond Passwords: FIDO Paris Seminar.pdf
Moving Beyond Passwords: FIDO Paris Seminar.pdf
 
All These Sophisticated Attacks, Can We Really Detect Them - PDF
All These Sophisticated Attacks, Can We Really Detect Them - PDFAll These Sophisticated Attacks, Can We Really Detect Them - PDF
All These Sophisticated Attacks, Can We Really Detect Them - PDF
 
Long journey of Ruby standard library at RubyConf AU 2024
Long journey of Ruby standard library at RubyConf AU 2024Long journey of Ruby standard library at RubyConf AU 2024
Long journey of Ruby standard library at RubyConf AU 2024
 
Decarbonising Buildings: Making a net-zero built environment a reality
Decarbonising Buildings: Making a net-zero built environment a realityDecarbonising Buildings: Making a net-zero built environment a reality
Decarbonising Buildings: Making a net-zero built environment a reality
 
Generative Artificial Intelligence: How generative AI works.pdf
Generative Artificial Intelligence: How generative AI works.pdfGenerative Artificial Intelligence: How generative AI works.pdf
Generative Artificial Intelligence: How generative AI works.pdf
 
Top 10 Hubspot Development Companies in 2024
Top 10 Hubspot Development Companies in 2024Top 10 Hubspot Development Companies in 2024
Top 10 Hubspot Development Companies in 2024
 

Tata Motors Ratio Analysis

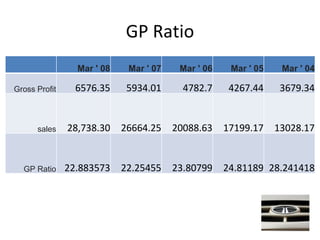
  • 1. GP Ratio   Mar ' 08 Mar ' 07 Mar ' 06 Mar ' 05 Mar ' 04 Gross Profit 6576.35 5934.01 4782.7 4267.44 3679.34 sales 28,738.30 26664.25 20088.63 17199.17 13028.17 GP Ratio 22.883573 22.25455 23.80799 24.81189 28.241418
  • 2. Net Profit Ratio   Mar ' 08 Mar ' 07 Mar ' 06 Mar ' 05 Mar ' 04 sales 28,738.30 26664.25 20088.63 17199.17 13028.17 net profit 3,000.91 2586.51 2146.36 2000.05 1727.28 Net Profit Ratio 10.442197 9.700292 10.68445 11.62876 13.25804
  • 3. Operating ratio   Mar ' 08 Mar ' 07 Mar ' 06 Mar ' 05 Mar ' 04 sales 28,738.30 26664.25 20088.63 17199.17 13028.17 cost of goods sold 22,161.95 20730.24 15305.93 12931.73 9348.83 operating expenses 4,706.84 3,924.55 2945.19 2549.82 2096.95 Operating ratio 93.49 92.46 90.85 90.01 87.85
  • 4. Debt Equity ratio   Mar ' 08 Mar ' 07 Mar ' 06 Mar ' 05 Mar ' 04 Debt 6,280.52 4,009.14 2,936.84 2,495.42 1,259.77 Equity 14,094.51 10,852.94 8,447.52 6,606.81 4,853.37 Debt Equity ratio 0.4456005 0.369406 0.347657 0.377704 0.259566
  • 5. Current ratio   Mar ' 08 Mar ' 07 Mar ' 06 Mar ' 05 Mar ' 04 Current Assets 10,781.23 10,318.42 9,812.06 7,248.88 3,835.78 Current Liabilities 12,029.80 8,321.20 7,888.65 7,268.80 5,309.17 Current ratio 0.8962102 1.240016 1.24382 0.99726 0.722482
  • 6. Fixed Asset T.O ratio   Mar ' 08 Mar ' 07 Mar ' 06 Mar ' 05 Mar ' 04 cost of goods sold 22,161.95 20730.24 15305.93 12931.73 9348.83 fixed Assets 15,337.03 8,845.63 6,509.99 6,608.57 6,304.57 Fixed Asset T.O ratio 1.4449962 2.343557 2.351145 1.956812 1.4828656
  • 7. Return on networth   Mar ' 08 Mar ' 07 Mar ' 06 Mar ' 05 Mar ' 04 net profit 3,000.91 2586.51 2146.36 2000.05 1727.28 Equity 14,094.51 10,852.94 8,447.52 6,606.81 4,853.37 Return on networth 21.29134 23.83234 25.40817 30.27255 35.589292
  • 8. Profit and Loss A/c Income:  Operating income  28,738.30 26,664.25 20,088.63 17,199.17 13,028.17 Expenses   Material consumed  20,931.81 19,529.88 14,376.11 12,101.28 8,720.10 Manufacturing expenses  1,230.14 1,200.36 929.82 830.45 628.73 Personnel expenses 1,544.57 1,367.83 1,143.13 1,039.34 882.49 Selling expenses 1,179.48 1,068.56 759.54 598.75 455.56 Adminstrative expenses 1,982.79 1,488.16 1,042.52 911.73 758.9 Expenses capitalised -1,131.40 -577.05 -308.85 -282.43 -144.89 Cost of sales 25,737.39 24,077.74 17,942.27 15,199.12 11,300.89 Operating profit 3,000.91 2,586.51 2,146.36 2,000.05 1,727.28 Other recurring income 389.03 887.23 685.18 399.94 235.65 Adjusted PBDIT 3,389.94 3,473.74 2,831.54 2,399.99 1,962.93 Financial expenses 471.56 455.75 350.24 234.3 225.96 Depreciation  652.31 586.29 520.94 450.16 382.6
  • 9. Cntd… Other write offs 64.35 85.02 73.78 67.12 51.64 Adjusted PBT 2,201.72 2,346.68 1,886.58 1,648.41 1,302.73 Tax charges  547.55 660.37 524.93 415.5 482.55 Adjusted PAT   1,654.17   1,686.31   1,361.65   1,232.91   820.18 Non recurring items 374.75 227.15 167.23 4.04 -6.82 Other non cash adjustments - -0.07 - -1.54 -3.02 Reported net profit 2,028.92 1,913.39 1,528.88 1,235.41 810.34 Earnigs before appropriation 3,042.75 2,690.15 2,094.54 1,601.21 934.05 Equity dividend 578.43 578.07 497.94 452.19 282.11 Preference dividend - - - - - Dividend tax 81.25 98.25 69.84 63.42 36.14 Retained earnings 2,383.07 2,013.83 1,526.76 1,085.60 615.8
  • 10. Balance sheet Sources of funds Owner's fund Equity share capital 385.54 385.41 382.87 361.79 353 Share application money - - - - 3.83 Preference share capital - - - - - Reserves & surplus 7,428.45 6,458.39 5,127.81 3,749.60 3,236.77 Loan funds Secured loans 2,461.99 2,022.04 822.76 489.81 942.65 Unsecured loans 3,818.53 1,987.10 2,114.08 2,005.61 317.12 Total 14,094.51 10,852.94 8,447.52 6,606.81 4,853.37
  • 11. Uses of funds Fixed assets Gross block 10,830.83 8,775.80 7,971.55 6,611.95 5,985.40 Less : revaluation reserve 25.51 25.95 26.39 - - Less : accumulated depreciation 5,443.52 4,894.54 4,401.51 3,454.28 3,023.69 Net block 5,361.80 3,855.31 3,543.65 3,157.67 2,961.71 Capital work-in-progress 5,064.96 2,513.32 951.19 538.84 286.09 Investments 4,910.27 2,477.00 2,015.15 2,912.06 3,056.77 Net current assets Current assets, loans & advances 10,781.23 10,318.42 9,812.06 7,248.88 3,835.78 Less : current liabilities & provisions 12,029.80 8,321.20 7,888.65 7,268.80 5,309.17 Total net current assets -1,248.57 1,997.22 1,923.41 -19.92 -1,473.39 Miscellaneous expenses not written 6.05 10.09 14.12 18.16 22.19 Total 14,094.51 10,852.94 8,447.52 6,606.81 4,853.37
  • 12. Notes: Book value of unquoted investments 4,145.82 2,117.86 1,648.57 2,480.15 2,778.87 Market value of quoted investments 2,530.55 1,323.08 1,550.00 1,260.05 732.76 Contingent liabilities 5,590.83 5,196.07 2,185.63 1,450.32 896.07 Number of equity sharesoutstanding (Lacs) 3855.04 3853.74 3828.34 3617.52 3529.58