SlideShare a Scribd company logo
1 of 2
Download to read offline
Market Dynamics                                                                         Prudential Fox & Roach
                                                                               Supply & Demand - # Units (FS, UC, Sold)
                                                                                 2 Years (Monthly) 07/01/08 - 07/31/10


                                                                                                  KEY INFORMATION

                            Jul-08                Jul-10            # Units Change     Percent Change
For Sale                12,774.0                 11,255.0                 -1,519.0            -11.9
Under Contract              1,070.0               819.0                   -251.0              -23.5
Sold                        1,210.0               771.0                   -439.0              -36.3


MLS: TReND        Period:    2 Years (Monthly)             Price:   All                      Construction Type:    All             Bedrooms:    All             Bathrooms:    All     Lot Size: All
Property Types:   Residential: (Single Family, Twin/Semi-Detached, Unit/Flat, Row/Townhouse/Cluster, Mobile, Other)                                                                   Sq Ft:    All
Counties:         Philadelphia


BrokerMetrics®                                                                                            1 of 2                                                                                      08/30/10
                                             Information not guaranteed. © 2010 - 2011 Terradatum and its suppliers and licensors (http://www.terradatum.com/metrics/licensors).
Market Dynamics                                                                              Prudential Fox & Roach
                                                                 Supply & Demand - # Units (FS, UC, Sold)
                                                                   2 Years (Monthly) 07/01/08 - 07/31/10


                       FOR SALE                       UNDER CONTRACT                                   SOLD                                   EXPIRED                           NEW LISTINGS
 Time Period     # Properties Average DOM           # Properties Average DOM                  # Properties  Average DOM                 # Properties Average DOM                        # Properties
Jul-10               11,255            126                   819                   68                   771                  70                 1,218                   182                   2,184
Jun-10               11,290            130                   807                   67                1,553                   72                 1,412                   195                   2,151
May-10               10,877            130                   728                   80                1,339                   67                 1,010                   173                   1,897
Apr-10               12,111            124                 1,872                   69                1,165                   80                 1,259                   197                   2,987
Mar-10               11,799            132                 1,448                   73                1,039                   77                 1,227                   191                   2,865
Feb-10               10,817            142                   973                   80                   627                  81                   910                   197                   1,783
Jan-10               10,912            141                   842                   79                   677                  72                 1,036                   192                   2,345
Dec-09               10,786            150                   702                   73                   877                  73                 1,517                   199                   1,350
Nov-09               11,150            139                   801                   71                1,339                   74                   913                   182                   1,688
Oct-09               11,760            132                 1,213                   73                1,153                   74                 1,085                   184                   2,273
Sep-09               11,878            132                 1,260                   75                1,035                   72                 1,131                   197                   2,328
Aug-09               11,685            134                 1,050                   77                1,137                   75                 1,085                   187                   2,096
Jul-09               11,897            132                 1,097                   72                1,132                   75                 1,211                   188                   2,085
Jun-09               12,226            131                 1,115                   72                1,117                   83                 1,299                   196                   2,392
May-09               12,155            133                 1,088                   81                1,040                   74                 1,233                   182                   2,282
Apr-09               11,991            131                 1,099                   76                   894                  81                 1,019                   178                   2,344
Mar-09               11,885            132                 1,041                   76                   804                  82                 1,197                   183                   2,348
Feb-09               11,301            134                   798                   82                   629                  74                   966                   181                   2,079
Jan-09               11,135            137                   723                   82                   637                  80                 1,190                   183                   1,992
Dec-08               11,281            139                   648                   80                   784                  75                 1,490                   186                   1,363
Nov-08               11,714            126                   719                   69                   765                  71                 1,077                   155                   1,703
Oct-08               12,255            119                   774                   72                   947                  63                 1,470                   152                   2,040
Sep-08               12,692            115                   930                   67                1,006                   67                 1,547                   164                   2,642
Aug-08               12,543            115                 1,014                   71                1,161                   69                 1,479                   152                   2,317
Jul-08               12,774            111                 1,070                   69                1,210                   67                 1,478                   152                   2,686


BrokerMetrics®                                                                                 2 of 2                                                                                                  08/30/10
                                  Information not guaranteed. © 2010 - 2011 Terradatum and its suppliers and licensors (http://www.terradatum.com/metrics/licensors).

More Related Content

What's hot

Months Supply of Inventory
Months Supply of InventoryMonths Supply of Inventory
Months Supply of InventoryMichael Tacconi
 
1 1 09 Months Supply Of Inventory
1 1 09 Months Supply Of Inventory1 1 09 Months Supply Of Inventory
1 1 09 Months Supply Of Inventorytjovanovski
 
July 2009 Montgomery County PA Homes For Sale - MSI and avg DOM
July 2009 Montgomery County PA Homes For Sale - MSI and avg DOMJuly 2009 Montgomery County PA Homes For Sale - MSI and avg DOM
July 2009 Montgomery County PA Homes For Sale - MSI and avg DOMPrudential Fox & Roach, Realtors
 

What's hot (17)

December 2009 Philadelphia County Basic Supply And Demand
December 2009 Philadelphia County Basic Supply And DemandDecember 2009 Philadelphia County Basic Supply And Demand
December 2009 Philadelphia County Basic Supply And Demand
 
December 2009 Montgomery County Basic Supply And Demand
December 2009 Montgomery County Basic Supply And DemandDecember 2009 Montgomery County Basic Supply And Demand
December 2009 Montgomery County Basic Supply And Demand
 
Philadelphia County MSI And Avg Dom
Philadelphia County MSI And Avg DomPhiladelphia County MSI And Avg Dom
Philadelphia County MSI And Avg Dom
 
January 2010 Philadelphia County Msi And Avg Dom
January 2010 Philadelphia County Msi And Avg DomJanuary 2010 Philadelphia County Msi And Avg Dom
January 2010 Philadelphia County Msi And Avg Dom
 
Montgomery County Basic Supply And Demand
Montgomery County Basic Supply And DemandMontgomery County Basic Supply And Demand
Montgomery County Basic Supply And Demand
 
July 2009 Philadelphia County Msi And Avg Dom
July 2009 Philadelphia County Msi And Avg DomJuly 2009 Philadelphia County Msi And Avg Dom
July 2009 Philadelphia County Msi And Avg Dom
 
Philadelphia County MSI And Avg Dom
Philadelphia County MSI And Avg DomPhiladelphia County MSI And Avg Dom
Philadelphia County MSI And Avg Dom
 
Montgomery county basic supply and demand
Montgomery county basic supply and demandMontgomery county basic supply and demand
Montgomery county basic supply and demand
 
December 2009 Bucks County MSI And Avg Dom
December 2009 Bucks County MSI And Avg DomDecember 2009 Bucks County MSI And Avg Dom
December 2009 Bucks County MSI And Avg Dom
 
Months Supply of Inventory
Months Supply of InventoryMonths Supply of Inventory
Months Supply of Inventory
 
December 2009 Philadelphia County Msi And Avg Dom
December 2009 Philadelphia County Msi And Avg DomDecember 2009 Philadelphia County Msi And Avg Dom
December 2009 Philadelphia County Msi And Avg Dom
 
July 2009 Bucks County MSI And Avg Dom
July 2009 Bucks County MSI And Avg DomJuly 2009 Bucks County MSI And Avg Dom
July 2009 Bucks County MSI And Avg Dom
 
January Bucks County MSI And Avg Dom
January Bucks County MSI And Avg DomJanuary Bucks County MSI And Avg Dom
January Bucks County MSI And Avg Dom
 
1 1 09 Months Supply Of Inventory
1 1 09 Months Supply Of Inventory1 1 09 Months Supply Of Inventory
1 1 09 Months Supply Of Inventory
 
July 2009 Montgomery County PA Homes For Sale - MSI and avg DOM
July 2009 Montgomery County PA Homes For Sale - MSI and avg DOMJuly 2009 Montgomery County PA Homes For Sale - MSI and avg DOM
July 2009 Montgomery County PA Homes For Sale - MSI and avg DOM
 
December 2009 Chester County Msi And Avg Dom
December 2009 Chester County Msi And Avg DomDecember 2009 Chester County Msi And Avg Dom
December 2009 Chester County Msi And Avg Dom
 
Bucks County MSI And Avg Dom
Bucks County MSI And Avg DomBucks County MSI And Avg Dom
Bucks County MSI And Avg Dom
 

Viewers also liked

Cordaid presentatie
Cordaid presentatieCordaid presentatie
Cordaid presentatiepeersme
 
Sacramental Preparation with Digital Creativity
Sacramental Preparation with Digital CreativitySacramental Preparation with Digital Creativity
Sacramental Preparation with Digital CreativityCaroline Cerveny
 
Offering your commercial and govt customers funding
Offering your commercial and govt customers fundingOffering your commercial and govt customers funding
Offering your commercial and govt customers fundingChris Barker
 
Uganda India Trade & Investment Promotion Group
Uganda India Trade & Investment Promotion GroupUganda India Trade & Investment Promotion Group
Uganda India Trade & Investment Promotion GroupIndia Advisors
 
Neolithic Site, Nerja Cave (PQI)
Neolithic Site, Nerja Cave (PQI)Neolithic Site, Nerja Cave (PQI)
Neolithic Site, Nerja Cave (PQI)Pilar Quiros
 
Stack Up Potatoes Week 1 Final
Stack Up Potatoes Week 1 FinalStack Up Potatoes Week 1 Final
Stack Up Potatoes Week 1 Finalchuays
 
Ministry of commerce
Ministry of commerceMinistry of commerce
Ministry of commerceSeetal Daas
 
Chatfield B M7powerpoint
Chatfield B M7powerpointChatfield B M7powerpoint
Chatfield B M7powerpointbrandon56
 
Collagistas en Arco y JustMad 2012
Collagistas en Arco y JustMad 2012Collagistas en Arco y JustMad 2012
Collagistas en Arco y JustMad 2012Teresa Císcar
 
II B.TECH. I SEM(R05) SUPPLE.
II B.TECH. I SEM(R05) SUPPLE. II B.TECH. I SEM(R05) SUPPLE.
II B.TECH. I SEM(R05) SUPPLE. P.G.GOPI NATH
 
Oc Housing Summit Rethinking Homeownership V5 Color
Oc Housing Summit   Rethinking Homeownership V5   ColorOc Housing Summit   Rethinking Homeownership V5   Color
Oc Housing Summit Rethinking Homeownership V5 ColorEhud Mouchly
 

Viewers also liked (20)

Video slide
Video slideVideo slide
Video slide
 
Cordaid presentatie
Cordaid presentatieCordaid presentatie
Cordaid presentatie
 
Sacramental Preparation with Digital Creativity
Sacramental Preparation with Digital CreativitySacramental Preparation with Digital Creativity
Sacramental Preparation with Digital Creativity
 
Data structures
Data structuresData structures
Data structures
 
Offering your commercial and govt customers funding
Offering your commercial and govt customers fundingOffering your commercial and govt customers funding
Offering your commercial and govt customers funding
 
Uganda India Trade & Investment Promotion Group
Uganda India Trade & Investment Promotion GroupUganda India Trade & Investment Promotion Group
Uganda India Trade & Investment Promotion Group
 
Ec 2012
Ec 2012Ec 2012
Ec 2012
 
Neolithic Site, Nerja Cave (PQI)
Neolithic Site, Nerja Cave (PQI)Neolithic Site, Nerja Cave (PQI)
Neolithic Site, Nerja Cave (PQI)
 
Capitulo 15 Sears
Capitulo 15 SearsCapitulo 15 Sears
Capitulo 15 Sears
 
Stack Up Potatoes Week 1 Final
Stack Up Potatoes Week 1 FinalStack Up Potatoes Week 1 Final
Stack Up Potatoes Week 1 Final
 
Ministry of commerce
Ministry of commerceMinistry of commerce
Ministry of commerce
 
3ºseptiembre
3ºseptiembre3ºseptiembre
3ºseptiembre
 
Chatfield B M7powerpoint
Chatfield B M7powerpointChatfield B M7powerpoint
Chatfield B M7powerpoint
 
Receta visual
Receta visualReceta visual
Receta visual
 
Collagistas en Arco y JustMad 2012
Collagistas en Arco y JustMad 2012Collagistas en Arco y JustMad 2012
Collagistas en Arco y JustMad 2012
 
Jago Re
Jago ReJago Re
Jago Re
 
Visual cv
Visual cvVisual cv
Visual cv
 
II B.TECH. I SEM(R05) SUPPLE.
II B.TECH. I SEM(R05) SUPPLE. II B.TECH. I SEM(R05) SUPPLE.
II B.TECH. I SEM(R05) SUPPLE.
 
Collage cpu
Collage cpuCollage cpu
Collage cpu
 
Oc Housing Summit Rethinking Homeownership V5 Color
Oc Housing Summit   Rethinking Homeownership V5   ColorOc Housing Summit   Rethinking Homeownership V5   Color
Oc Housing Summit Rethinking Homeownership V5 Color
 

Similar to September 2010 Montgomery County Basic Supply And Demand

1 1 09 Supply And Demand Listings
1 1 09 Supply And Demand Listings1 1 09 Supply And Demand Listings
1 1 09 Supply And Demand Listingstjovanovski
 
Philadelphia county msi and avg dom
Philadelphia county msi and avg domPhiladelphia county msi and avg dom
Philadelphia county msi and avg domguest0b96a3c
 

Similar to September 2010 Montgomery County Basic Supply And Demand (20)

Philadelphia County Basic Supply and Demand
Philadelphia County Basic Supply and DemandPhiladelphia County Basic Supply and Demand
Philadelphia County Basic Supply and Demand
 
Philadelphia county basic supply and demand
Philadelphia county basic supply and demandPhiladelphia county basic supply and demand
Philadelphia county basic supply and demand
 
June 2010 Philadelphia County Sold Median Price
June 2010 Philadelphia County Sold Median PriceJune 2010 Philadelphia County Sold Median Price
June 2010 Philadelphia County Sold Median Price
 
Philadelphia county sold median price
Philadelphia county sold median pricePhiladelphia county sold median price
Philadelphia county sold median price
 
July 2010 Montgomery County Basic Supply and Demand
July 2010 Montgomery County Basic Supply and DemandJuly 2010 Montgomery County Basic Supply and Demand
July 2010 Montgomery County Basic Supply and Demand
 
Montgomery County Basic Supply And Demand
Montgomery County Basic Supply And DemandMontgomery County Basic Supply And Demand
Montgomery County Basic Supply And Demand
 
July 2009 Philadelphia County Sold Median Price
July 2009 Philadelphia County Sold Median PriceJuly 2009 Philadelphia County Sold Median Price
July 2009 Philadelphia County Sold Median Price
 
1 1 09 Supply And Demand Listings
1 1 09 Supply And Demand Listings1 1 09 Supply And Demand Listings
1 1 09 Supply And Demand Listings
 
Philadelphia County Sold Median Price Analysis
Philadelphia County Sold Median Price AnalysisPhiladelphia County Sold Median Price Analysis
Philadelphia County Sold Median Price Analysis
 
Philadelphia County Sold Median Price Analysis
Philadelphia County Sold Median Price AnalysisPhiladelphia County Sold Median Price Analysis
Philadelphia County Sold Median Price Analysis
 
May 2010 Philadelphia County MSI And Avg Days on Market
May 2010 Philadelphia County MSI And Avg Days on Market May 2010 Philadelphia County MSI And Avg Days on Market
May 2010 Philadelphia County MSI And Avg Days on Market
 
Philadelphia County Sold Median Price
Philadelphia County Sold Median PricePhiladelphia County Sold Median Price
Philadelphia County Sold Median Price
 
January 2010 Philadelphia County Sold Median Price
January 2010 Philadelphia County Sold Median PriceJanuary 2010 Philadelphia County Sold Median Price
January 2010 Philadelphia County Sold Median Price
 
May 2010 Philadelphia County Sold Median Price
May 2010 Philadelphia County Sold Median PriceMay 2010 Philadelphia County Sold Median Price
May 2010 Philadelphia County Sold Median Price
 
2010 February Philadelphia County Sold Median Price
2010 February Philadelphia County Sold Median Price2010 February Philadelphia County Sold Median Price
2010 February Philadelphia County Sold Median Price
 
Montgomery County Msi And Avg Dom
Montgomery County Msi And Avg DomMontgomery County Msi And Avg Dom
Montgomery County Msi And Avg Dom
 
Philadelphia county msi and avg dom
Philadelphia county msi and avg domPhiladelphia county msi and avg dom
Philadelphia county msi and avg dom
 
Philadelphia county msi and avg dom
Philadelphia county msi and avg domPhiladelphia county msi and avg dom
Philadelphia county msi and avg dom
 
December 2009 Philadelphia County Sold Median Price
December 2009 Philadelphia County Sold Median PriceDecember 2009 Philadelphia County Sold Median Price
December 2009 Philadelphia County Sold Median Price
 
January 2010 Chester County Msi And Avg Dom
January 2010 Chester County Msi And Avg DomJanuary 2010 Chester County Msi And Avg Dom
January 2010 Chester County Msi And Avg Dom
 

More from Prudential Fox & Roach, Realtors

September 2010 Montgomery County Month Supply of Inventory and Average Days o...
September 2010 Montgomery County Month Supply of Inventory and Average Days o...September 2010 Montgomery County Month Supply of Inventory and Average Days o...
September 2010 Montgomery County Month Supply of Inventory and Average Days o...Prudential Fox & Roach, Realtors
 
July 2010 Montgomery County Month Supply of Inventory and Average Days on Market
July 2010 Montgomery County Month Supply of Inventory and Average Days on MarketJuly 2010 Montgomery County Month Supply of Inventory and Average Days on Market
July 2010 Montgomery County Month Supply of Inventory and Average Days on MarketPrudential Fox & Roach, Realtors
 

More from Prudential Fox & Roach, Realtors (20)

Bucks county market share
Bucks county market shareBucks county market share
Bucks county market share
 
Bucks county market share
Bucks county market shareBucks county market share
Bucks county market share
 
Bucks county market share
Bucks county market shareBucks county market share
Bucks county market share
 
September 2010 Bucks County Market Share
September 2010 Bucks County Market ShareSeptember 2010 Bucks County Market Share
September 2010 Bucks County Market Share
 
Bucks County Basic Supply and Demand
Bucks County Basic Supply and DemandBucks County Basic Supply and Demand
Bucks County Basic Supply and Demand
 
Montgomery county sold median price
Montgomery county sold median priceMontgomery county sold median price
Montgomery county sold median price
 
September 2010 Montgomery County Month Supply of Inventory and Average Days o...
September 2010 Montgomery County Month Supply of Inventory and Average Days o...September 2010 Montgomery County Month Supply of Inventory and Average Days o...
September 2010 Montgomery County Month Supply of Inventory and Average Days o...
 
September 2010 Montgomery county Market Share
September 2010 Montgomery county Market ShareSeptember 2010 Montgomery county Market Share
September 2010 Montgomery county Market Share
 
September 2010 Montgomery County Sold Median Price
September 2010 Montgomery County Sold Median PriceSeptember 2010 Montgomery County Sold Median Price
September 2010 Montgomery County Sold Median Price
 
July 2010 Philadelphia County Market Share
July 2010 Philadelphia County Market ShareJuly 2010 Philadelphia County Market Share
July 2010 Philadelphia County Market Share
 
July 2010 Montgomery County Month Supply of Inventory and Average Days on Market
July 2010 Montgomery County Month Supply of Inventory and Average Days on MarketJuly 2010 Montgomery County Month Supply of Inventory and Average Days on Market
July 2010 Montgomery County Month Supply of Inventory and Average Days on Market
 
July 2010 Montgomery County Sold Median Price
July 2010 Montgomery County Sold Median PriceJuly 2010 Montgomery County Sold Median Price
July 2010 Montgomery County Sold Median Price
 
July 2010 Montgomery County Market Share
July 2010 Montgomery County Market ShareJuly 2010 Montgomery County Market Share
July 2010 Montgomery County Market Share
 
July 2010 Philadelphia County Basic Supply and Demand
July 2010 Philadelphia County Basic Supply and DemandJuly 2010 Philadelphia County Basic Supply and Demand
July 2010 Philadelphia County Basic Supply and Demand
 
Montgomery county msi and avg dom
Montgomery county msi and avg domMontgomery county msi and avg dom
Montgomery county msi and avg dom
 
Montgomery county market share
Montgomery county market shareMontgomery county market share
Montgomery county market share
 
Montgomery county sold median price
Montgomery county sold median priceMontgomery county sold median price
Montgomery county sold median price
 
Delaware county msi and avg dom
Delaware county msi and avg domDelaware county msi and avg dom
Delaware county msi and avg dom
 
Delaware county market share
Delaware county market shareDelaware county market share
Delaware county market share
 
Delaware county basic supply and demand
Delaware county basic supply and demandDelaware county basic supply and demand
Delaware county basic supply and demand
 

September 2010 Montgomery County Basic Supply And Demand

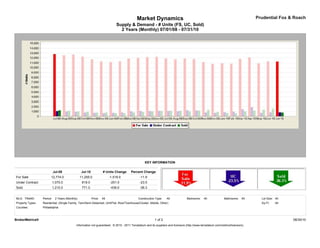
  • 1. Market Dynamics Prudential Fox & Roach Supply & Demand - # Units (FS, UC, Sold) 2 Years (Monthly) 07/01/08 - 07/31/10 KEY INFORMATION Jul-08 Jul-10 # Units Change Percent Change For Sale 12,774.0 11,255.0 -1,519.0 -11.9 Under Contract 1,070.0 819.0 -251.0 -23.5 Sold 1,210.0 771.0 -439.0 -36.3 MLS: TReND Period: 2 Years (Monthly) Price: All Construction Type: All Bedrooms: All Bathrooms: All Lot Size: All Property Types: Residential: (Single Family, Twin/Semi-Detached, Unit/Flat, Row/Townhouse/Cluster, Mobile, Other) Sq Ft: All Counties: Philadelphia BrokerMetrics® 1 of 2 08/30/10 Information not guaranteed. © 2010 - 2011 Terradatum and its suppliers and licensors (http://www.terradatum.com/metrics/licensors).
  • 2. Market Dynamics Prudential Fox & Roach Supply & Demand - # Units (FS, UC, Sold) 2 Years (Monthly) 07/01/08 - 07/31/10 FOR SALE UNDER CONTRACT SOLD EXPIRED NEW LISTINGS Time Period # Properties Average DOM # Properties Average DOM # Properties Average DOM # Properties Average DOM # Properties Jul-10 11,255 126 819 68 771 70 1,218 182 2,184 Jun-10 11,290 130 807 67 1,553 72 1,412 195 2,151 May-10 10,877 130 728 80 1,339 67 1,010 173 1,897 Apr-10 12,111 124 1,872 69 1,165 80 1,259 197 2,987 Mar-10 11,799 132 1,448 73 1,039 77 1,227 191 2,865 Feb-10 10,817 142 973 80 627 81 910 197 1,783 Jan-10 10,912 141 842 79 677 72 1,036 192 2,345 Dec-09 10,786 150 702 73 877 73 1,517 199 1,350 Nov-09 11,150 139 801 71 1,339 74 913 182 1,688 Oct-09 11,760 132 1,213 73 1,153 74 1,085 184 2,273 Sep-09 11,878 132 1,260 75 1,035 72 1,131 197 2,328 Aug-09 11,685 134 1,050 77 1,137 75 1,085 187 2,096 Jul-09 11,897 132 1,097 72 1,132 75 1,211 188 2,085 Jun-09 12,226 131 1,115 72 1,117 83 1,299 196 2,392 May-09 12,155 133 1,088 81 1,040 74 1,233 182 2,282 Apr-09 11,991 131 1,099 76 894 81 1,019 178 2,344 Mar-09 11,885 132 1,041 76 804 82 1,197 183 2,348 Feb-09 11,301 134 798 82 629 74 966 181 2,079 Jan-09 11,135 137 723 82 637 80 1,190 183 1,992 Dec-08 11,281 139 648 80 784 75 1,490 186 1,363 Nov-08 11,714 126 719 69 765 71 1,077 155 1,703 Oct-08 12,255 119 774 72 947 63 1,470 152 2,040 Sep-08 12,692 115 930 67 1,006 67 1,547 164 2,642 Aug-08 12,543 115 1,014 71 1,161 69 1,479 152 2,317 Jul-08 12,774 111 1,070 69 1,210 67 1,478 152 2,686 BrokerMetrics® 2 of 2 08/30/10 Information not guaranteed. © 2010 - 2011 Terradatum and its suppliers and licensors (http://www.terradatum.com/metrics/licensors).