June 2010 Philadelphia County Sold Median Price
•
0 gefällt mir•61 views


Empfohlen
Empfohlen
Weitere ähnliche Inhalte
Was ist angesagt?
Was ist angesagt? (16)
Ähnlich wie June 2010 Philadelphia County Sold Median Price
Ähnlich wie June 2010 Philadelphia County Sold Median Price (19)
Mehr von Prudential Fox & Roach, Realtors
Mehr von Prudential Fox & Roach, Realtors (20)
Kürzlich hochgeladen
Kürzlich hochgeladen (20)
June 2010 Philadelphia County Sold Median Price
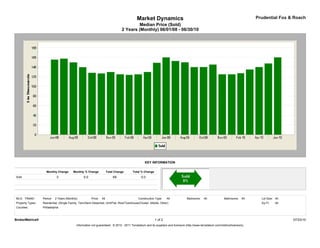
- 1. Market Dynamics Prudential Fox & Roach Median Price (Sold) 2 Years (Monthly) 06/01/08 - 06/30/10 KEY INFORMATION Monthly Change Monthly % Change Total Change Total % Change Sold 3 0.0 69 0.0 MLS: TReND Period: 2 Years (Monthly) Price: All Construction Type: All Bedrooms: All Bathrooms: All Lot Size: All Property Types: Residential: (Single Family, Twin/Semi-Detached, Unit/Flat, Row/Townhouse/Cluster, Mobile, Other) Sq Ft: All Counties: Philadelphia BrokerMetrics® 1 of 2 07/23/10 Information not guaranteed. © 2010 - 2011 Terradatum and its suppliers and licensors (http://www.terradatum.com/metrics/licensors).
- 2. Market Dynamics Prudential Fox & Roach Median Price (Sold) 2 Years (Monthly) 06/01/08 - 06/30/10 FOR SALE UNDER CONTRACT SOLD EXPIRED NEW LISTINGS Time Period Median $ # Properties Median $ # Properties Median $ # Properties Median $ # Properties Median $ # Properties Jun-10 149,900 11,101 139,900 801 160,000 1,523 140,000 1,453 149,900 2,130 May-10 149,900 10,741 136,500 731 147,500 1,331 145,000 1,039 145,000 1,887 Apr-10 149,900 12,005 160,000 1,878 140,000 1,163 125,900 1,273 149,900 2,976 Mar-10 148,950 11,722 142,450 1,448 135,000 1,030 138,900 1,245 162,900 2,849 Feb-10 139,900 10,761 149,900 972 127,500 626 117,950 916 155,450 1,778 Jan-10 135,000 10,861 135,000 836 125,000 669 130,000 1,042 134,900 2,334 Dec-09 135,000 10,752 135,000 703 125,000 875 137,500 1,522 122,500 1,350 Nov-09 139,900 11,125 135,000 804 145,000 1,338 149,900 919 129,900 1,688 Oct-09 139,900 11,745 139,900 1,216 140,000 1,154 140,950 1,092 141,950 2,274 Sep-09 139,900 11,869 140,000 1,262 139,900 1,035 139,900 1,136 139,600 2,324 Aug-09 141,900 11,686 149,900 1,050 150,000 1,136 139,900 1,091 139,900 2,096 Jul-09 145,000 11,898 149,900 1,097 152,750 1,132 149,000 1,211 137,999 2,085 Jun-09 149,900 12,228 153,450 1,116 160,000 1,117 149,900 1,299 149,000 2,392 May-09 149,900 12,157 160,000 1,088 148,750 1,040 149,900 1,233 145,000 2,282 Apr-09 150,000 11,993 169,000 1,099 130,000 894 144,900 1,019 159,900 2,344 Mar-09 149,900 11,887 139,900 1,041 124,950 804 139,900 1,197 154,900 2,348 Feb-09 145,000 11,301 134,900 798 124,000 629 139,900 964 142,000 2,079 Jan-09 149,900 11,135 139,900 723 125,000 636 159,000 1,190 133,750 1,992 Dec-08 149,900 11,281 129,900 648 130,000 784 140,000 1,490 129,900 1,363 Nov-08 149,900 11,714 129,900 719 127,000 765 156,000 1,077 139,900 1,703 Oct-08 149,900 12,255 129,950 774 128,000 947 141,750 1,470 139,900 2,040 Sep-08 149,900 12,692 134,900 930 139,500 1,006 159,000 1,547 154,900 2,642 Aug-08 149,900 12,543 142,700 1,014 149,900 1,160 149,900 1,479 135,000 2,317 Jul-08 153,350 12,774 149,250 1,070 157,500 1,210 159,000 1,478 145,000 2,686 Jun-08 155,000 12,745 154,900 1,120 155,675 1,276 149,999 1,537 149,900 2,604 BrokerMetrics® 2 of 2 07/23/10 Information not guaranteed. © 2010 - 2011 Terradatum and its suppliers and licensors (http://www.terradatum.com/metrics/licensors).