Tribal Infra
- 1. Table No.32/ŸÖŒŸÖÖ Îú.32
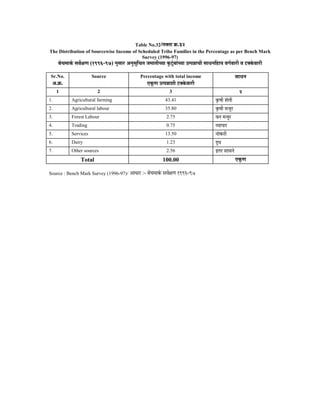
The Distribution of Sourcewise Income of Scheduled Tribe Families in the Percentage as per Bench Mark
Survey (1996-97)
²Öê“Ö´ÖÖÔú ÃÖ¾ÖìÖÖ (1996-97) −ÖãÃÖÖ¸ü †−ÖãÃÖæ×“ÖŸÖ •Ö´ÖÖŸÖß“µÖÖ ãú™Óüã²ÖÖÓ“µÖÖ ˆŸ¯Ö®ÖÖ“Öß ÃÖÖ¬Ö−Ö×ÆüÖµÖ ¾Ö÷ÖÔ¾ÖÖ¸üß ¾Ö ™üŒêú¾ÖÖ¸üß
Sr.No. Source Percentage with total income ÃÖÖ¬Ö−Ö
†.Îú. ‹æúÖ ˆŸ¯Ö®ÖÖ¿Öß ™üŒêú¾ÖÖ¸üß
1 2 3 2
1. Agricultural farming 43.41 éúÂÖß ¿ÖêŸÖß
2. Agricultural labour 35.80 éúÂÖß ´Ö•Öæ¸ü
3. Forest Labour 2.75 ¾Ö−Ö ´Ö•Öæ¸ü
4. Trading 0.75 ¾µÖÖ¯ÖÖ¸ü
5. Services 13.50 −ÖÖêú¸üß
6. Dairy 1.23 ¤æü¬Ö
7. Other sources 2.56 ‡ŸÖ¸ü ÃÖÖ¬Ö−Öê
Total 100.00 ‹æúÖ
Source : Bench Mark Survey (1996-97)/ †Ö¬ÖÖ¸ü :- ²Öë“Ö´ÖÖÔú ÃÖ¾ÖìÖÖ 1996-97