SlideShare a Scribd company logo
1 of 28
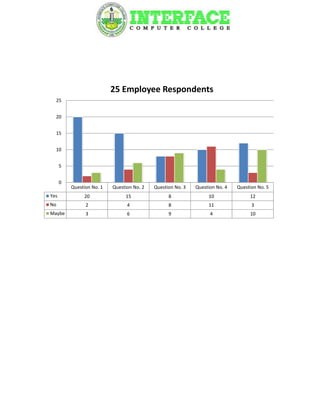
25 Employee Respondents
  25


  20


  15


  10


      5


      0
          Question No. 1   Question No. 2   Question No. 3   Question No. 4   Question No. 5
Yes            20               15                8               10               12
No              2                4                8               11                3
Maybe           3                6                9                4               10
Tally/Frequency percentage

Question No. 1                    Question No. 2                Question No. 3
  Yes       No   Maybe               Yes   No   Maybe              Yes   No     Maybe

      12%
                                    24%
 8%                                                              36%              32%


                                  16%             60%
                 80%
                                                                          32%


                 Question No. 4                 Question No. 5
                    Yes      No   Maybe            Yes     No   Maybe

                       16%

                                    40%         40%
                                                                   48%


                   44%
                                                         12%
30
                    25 Client/Customer Respondents
  25

  20

  15

  10

      5

      0
          Question No. 1   Question No. 2   Question No. 3   Question No. 4   Question No. 5
Yes            24               15                3                9               15
No              0                1               17               15                1
Maybe           1                9                5                1                9
Tally/Frequency percentage

Question No. 1                    Question No. 2                  Question No. 3
     Yes   No    Maybe              Yes       No   Maybe            Yes    No    Maybe
0%
       11%                                                                      12%
                                                                    20%
                                  36%


                                                     60%
                                   4%
                89%                                                             68%


                  Question No. 4                    Question No. 5
                       Yes   No    Maybe               Yes   No    Maybe
                             4%


                                        36%          36%


                                                                     60%
                      60%
                                                       4%
50 respondents (Employee and Client/Customer)
  50
  45
  40
  35
  30
  25
  20
  15
  10
   5
   0
        Question No. 1   Question No. 2   Question No. 3   Question No. 4   Question No. 5
Yes          44               30               11               19               27
No            2                5               25               26                4
Maybe         4               15               14                5               19
Tally/Frequency percentage

Question No. 1                  Question No. 2                Question No. 3
  Yes   No   Maybe                 Yes   No   Maybe              Yes   No     Maybe

  4% 8%
                                                                              22%
                                 30%                           28%


                                                60%
                                 10%
             88%                                                            50%


             Question No. 4                   Question No. 5
                   Yes     No   Maybe            Yes     No   Maybe

                         10%

                                  38%         38%


                                                                 54%
               52%
                                                    8%
Formula:


R=No. of respondent   R=?

N=No. of people       N=100

e=Margin of error     e=10 %( 0.1)
Formula:


                     50 respondents from Employee & Client/Customer

QUESTION NO.1

           Yes                           No                           Maybe


           Classes   Tally/Frequency                            Degree     p)
                                                   f)
            Yes             44                   88                   316.8
            No               2                    4                    14.4
           Maybe             4                    8                    28.8
                     R= 50 respondent           100                      =360
QUESTION NO.2


      Yes                           No             Maybe


       Classes   Tally/Frequency                Degree   p)
                                           f)
        Yes             30                60       216
        No               5                10        36
       Maybe            15                30       108
                 R= 50 respondent        100         =360
QUESTION NO.3


       Yes                          No              Maybe


       Classes   Tally/Frequency                Degree   p)
                                           f)
        Yes             11                22       79.2
        No              25                50       180
       Maybe            14                28      100.8
                 R= 50 respondent        100         =360
QUESTION NO.4


       Yes                          No              Maybe


       Classes   Tally/Frequency                Degree   p)
                                           f)
        Yes             19                38      136.8
        No              26                52      187.2
       Maybe             5                10       36
                 R= 50 respondent        100        =360
QUESTION NO.5


       Yes                          No               Maybe


       Classes   Tally/Frequency                 Degree   p)
                                            f)
        Yes             27                54       194.4
        No               4                 8        28.8
       Maybe            19                38       136.8
                 R= 50 respondent        100          =360
25 respondents from Employee

QUESTION NO.1


       Yes                            No                     Maybe


       Classes   Tally/Frequency                         Degree   p)
                                               f)
        Yes             20                   80             288
        No               2                    8             28.8
       Maybe             3                   12             43.2
                 R= 25 respondent           100               =360
QUESTION NO.2


       Yes                          No              Maybe


       Classes   Tally/Frequency                Degree   p)
                                           f)
        Yes             15                60       216
        No               4                16       57.6
       Maybe             6                24       86.4
                 R= 25 respondent        100         =360
QUESTION NO.3


       Yes                          No              Maybe


       Classes   Tally/Frequency                Degree   p)
                                           f)
        Yes              8                32      115.2
        No               8                32      115.2
       Maybe             9                36      129.6
                 R= 25 respondent        100        =360
QUESTION NO.4


       Yes                          No              Maybe


       Classes   Tally/Frequency                Degree   p)
                                           f)
        Yes             10                40       144
        No              11                44      158.4
       Maybe             4                16       57.6
                 R= 25 respondent        100         =360
QUESTION NO.5


       Yes                          No              Maybe


       Classes   Tally/Frequency                Degree   p)
                                           f)
        Yes             12                48      172.8
        No               3                12       43.2
       Maybe            10                40       144
                 R= 25 respondent        100         =360
25 respondents from Client/Customer


QUESTION NO.1


       Yes                            No                           Maybe


       Classes   Tally/Frequency                               Degree   p)
                                               f)
        Yes
        No
       Maybe
                 R= 25 respondent           100                     =360
QUESTION NO.2


       Yes                          No              Maybe


       Classes   Tally/Frequency                Degree   p)
                                           f)
        Yes
        No
       Maybe
                 R= 25 respondent        100         =360
QUESTION NO.3


       Yes                          No              Maybe


       Classes   Tally/Frequency                Degree   p)
                                           f)
        Yes              3
        No              17
       Maybe             5
                 R= 25 respondent        100         =360
QUESTION NO.4


       Yes                          No              Maybe


       Classes   Tally/Frequency                Degree   p)
                                           f)
        Yes              9
        No              15
       Maybe             1
                 R= 25 respondent        100         =360
QUESTION NO.5


       Yes                          No              Maybe


       Classes   Tally/Frequency                Degree   p)
                                           f)
        Yes             15
        No               1
       Maybe             9
                 R= 25 respondent        100         =360
Formula used:


ITS= Individual Total Score

A= Number of persons who mark Yes

B= Number of persons who mark No

C= Number of persons who mark Maybe

X= Total number of respondents


                       50 respondents (Employee and Client/Customer)


                                   = 4.84 Yes


                                   = 4.5 Yes
= 3.72 No


= 3.86 No


= 4.46 Yes
25 respondents (Employee)


  = 4.72 Yes


  = 4.44 Yes


  = 4.00 Yes
= 3.96 No


= 4.36 Yes
25 respondents (Client/Customer)


     = 4.96 Yes


     = 4.56 Yes


     = 3.44 No
= 3.76 No


               = 4.56 Yes


Scale Table


   SCALE
   INTERPRETATION

   5.00-4.00      Yes
   3.99-2.51      No
   2.50-1.00      Maybe
More Related Content

Viewers also liked (14)

Cd design
Cd designCd design
Cd design
 
A2 evaluation, question two
A2 evaluation, question twoA2 evaluation, question two
A2 evaluation, question two
 
Magazine research q kerrang nme
Magazine research q kerrang nmeMagazine research q kerrang nme
Magazine research q kerrang nme
 
Chapter 6
Chapter 6Chapter 6
Chapter 6
 
Chapter 5 by roo and clau
Chapter 5 by roo and clauChapter 5 by roo and clau
Chapter 5 by roo and clau
 
Proyecto gira 4_b
Proyecto gira 4_bProyecto gira 4_b
Proyecto gira 4_b
 
Chapter1
Chapter1Chapter1
Chapter1
 
Natco
NatcoNatco
Natco
 
C PROGRAMING AND PC
C PROGRAMING AND PCC PROGRAMING AND PC
C PROGRAMING AND PC
 
Proyecto musica de_terror3
Proyecto musica de_terror3Proyecto musica de_terror3
Proyecto musica de_terror3
 
Powertrain Codes DTC list
Powertrain Codes DTC listPowertrain Codes DTC list
Powertrain Codes DTC list
 
Storm Anatomy
Storm AnatomyStorm Anatomy
Storm Anatomy
 
C Programing Solve Presentation -CSE
C Programing Solve Presentation -CSEC Programing Solve Presentation -CSE
C Programing Solve Presentation -CSE
 
The Emerging Virtual Reality Landscape: a Primer
The Emerging Virtual Reality Landscape: a PrimerThe Emerging Virtual Reality Landscape: a Primer
The Emerging Virtual Reality Landscape: a Primer
 

Recently uploaded

+971581248768>> SAFE AND ORIGINAL ABORTION PILLS FOR SALE IN DUBAI AND ABUDHA...
+971581248768>> SAFE AND ORIGINAL ABORTION PILLS FOR SALE IN DUBAI AND ABUDHA...+971581248768>> SAFE AND ORIGINAL ABORTION PILLS FOR SALE IN DUBAI AND ABUDHA...
+971581248768>> SAFE AND ORIGINAL ABORTION PILLS FOR SALE IN DUBAI AND ABUDHA...
?#DUbAI#??##{{(☎️+971_581248768%)**%*]'#abortion pills for sale in dubai@
 
Cloud Frontiers: A Deep Dive into Serverless Spatial Data and FME
Cloud Frontiers:  A Deep Dive into Serverless Spatial Data and FMECloud Frontiers:  A Deep Dive into Serverless Spatial Data and FME
Cloud Frontiers: A Deep Dive into Serverless Spatial Data and FME
Safe Software
 

Recently uploaded (20)

Exploring the Future Potential of AI-Enabled Smartphone Processors
Exploring the Future Potential of AI-Enabled Smartphone ProcessorsExploring the Future Potential of AI-Enabled Smartphone Processors
Exploring the Future Potential of AI-Enabled Smartphone Processors
 
TrustArc Webinar - Unlock the Power of AI-Driven Data Discovery
TrustArc Webinar - Unlock the Power of AI-Driven Data DiscoveryTrustArc Webinar - Unlock the Power of AI-Driven Data Discovery
TrustArc Webinar - Unlock the Power of AI-Driven Data Discovery
 
Axa Assurance Maroc - Insurer Innovation Award 2024
Axa Assurance Maroc - Insurer Innovation Award 2024Axa Assurance Maroc - Insurer Innovation Award 2024
Axa Assurance Maroc - Insurer Innovation Award 2024
 
Strategize a Smooth Tenant-to-tenant Migration and Copilot Takeoff
Strategize a Smooth Tenant-to-tenant Migration and Copilot TakeoffStrategize a Smooth Tenant-to-tenant Migration and Copilot Takeoff
Strategize a Smooth Tenant-to-tenant Migration and Copilot Takeoff
 
Strategies for Unlocking Knowledge Management in Microsoft 365 in the Copilot...
Strategies for Unlocking Knowledge Management in Microsoft 365 in the Copilot...Strategies for Unlocking Knowledge Management in Microsoft 365 in the Copilot...
Strategies for Unlocking Knowledge Management in Microsoft 365 in the Copilot...
 
FWD Group - Insurer Innovation Award 2024
FWD Group - Insurer Innovation Award 2024FWD Group - Insurer Innovation Award 2024
FWD Group - Insurer Innovation Award 2024
 
Corporate and higher education May webinar.pptx
Corporate and higher education May webinar.pptxCorporate and higher education May webinar.pptx
Corporate and higher education May webinar.pptx
 
Apidays New York 2024 - The Good, the Bad and the Governed by David O'Neill, ...
Apidays New York 2024 - The Good, the Bad and the Governed by David O'Neill, ...Apidays New York 2024 - The Good, the Bad and the Governed by David O'Neill, ...
Apidays New York 2024 - The Good, the Bad and the Governed by David O'Neill, ...
 
presentation ICT roal in 21st century education
presentation ICT roal in 21st century educationpresentation ICT roal in 21st century education
presentation ICT roal in 21st century education
 
Apidays New York 2024 - Accelerating FinTech Innovation by Vasa Krishnan, Fin...
Apidays New York 2024 - Accelerating FinTech Innovation by Vasa Krishnan, Fin...Apidays New York 2024 - Accelerating FinTech Innovation by Vasa Krishnan, Fin...
Apidays New York 2024 - Accelerating FinTech Innovation by Vasa Krishnan, Fin...
 
Artificial Intelligence Chap.5 : Uncertainty
Artificial Intelligence Chap.5 : UncertaintyArtificial Intelligence Chap.5 : Uncertainty
Artificial Intelligence Chap.5 : Uncertainty
 
+971581248768>> SAFE AND ORIGINAL ABORTION PILLS FOR SALE IN DUBAI AND ABUDHA...
+971581248768>> SAFE AND ORIGINAL ABORTION PILLS FOR SALE IN DUBAI AND ABUDHA...+971581248768>> SAFE AND ORIGINAL ABORTION PILLS FOR SALE IN DUBAI AND ABUDHA...
+971581248768>> SAFE AND ORIGINAL ABORTION PILLS FOR SALE IN DUBAI AND ABUDHA...
 
Cloud Frontiers: A Deep Dive into Serverless Spatial Data and FME
Cloud Frontiers:  A Deep Dive into Serverless Spatial Data and FMECloud Frontiers:  A Deep Dive into Serverless Spatial Data and FME
Cloud Frontiers: A Deep Dive into Serverless Spatial Data and FME
 
Mastering MySQL Database Architecture: Deep Dive into MySQL Shell and MySQL R...
Mastering MySQL Database Architecture: Deep Dive into MySQL Shell and MySQL R...Mastering MySQL Database Architecture: Deep Dive into MySQL Shell and MySQL R...
Mastering MySQL Database Architecture: Deep Dive into MySQL Shell and MySQL R...
 
Repurposing LNG terminals for Hydrogen Ammonia: Feasibility and Cost Saving
Repurposing LNG terminals for Hydrogen Ammonia: Feasibility and Cost SavingRepurposing LNG terminals for Hydrogen Ammonia: Feasibility and Cost Saving
Repurposing LNG terminals for Hydrogen Ammonia: Feasibility and Cost Saving
 
GenAI Risks & Security Meetup 01052024.pdf
GenAI Risks & Security Meetup 01052024.pdfGenAI Risks & Security Meetup 01052024.pdf
GenAI Risks & Security Meetup 01052024.pdf
 
ProductAnonymous-April2024-WinProductDiscovery-MelissaKlemke
ProductAnonymous-April2024-WinProductDiscovery-MelissaKlemkeProductAnonymous-April2024-WinProductDiscovery-MelissaKlemke
ProductAnonymous-April2024-WinProductDiscovery-MelissaKlemke
 
A Year of the Servo Reboot: Where Are We Now?
A Year of the Servo Reboot: Where Are We Now?A Year of the Servo Reboot: Where Are We Now?
A Year of the Servo Reboot: Where Are We Now?
 
Apidays Singapore 2024 - Modernizing Securities Finance by Madhu Subbu
Apidays Singapore 2024 - Modernizing Securities Finance by Madhu SubbuApidays Singapore 2024 - Modernizing Securities Finance by Madhu Subbu
Apidays Singapore 2024 - Modernizing Securities Finance by Madhu Subbu
 
Web Form Automation for Bonterra Impact Management (fka Social Solutions Apri...
Web Form Automation for Bonterra Impact Management (fka Social Solutions Apri...Web Form Automation for Bonterra Impact Management (fka Social Solutions Apri...
Web Form Automation for Bonterra Impact Management (fka Social Solutions Apri...
 

Ai report

  • 1. 25 Employee Respondents 25 20 15 10 5 0 Question No. 1 Question No. 2 Question No. 3 Question No. 4 Question No. 5 Yes 20 15 8 10 12 No 2 4 8 11 3 Maybe 3 6 9 4 10
  • 2. Tally/Frequency percentage Question No. 1 Question No. 2 Question No. 3 Yes No Maybe Yes No Maybe Yes No Maybe 12% 24% 8% 36% 32% 16% 60% 80% 32% Question No. 4 Question No. 5 Yes No Maybe Yes No Maybe 16% 40% 40% 48% 44% 12%
  • 3. 30 25 Client/Customer Respondents 25 20 15 10 5 0 Question No. 1 Question No. 2 Question No. 3 Question No. 4 Question No. 5 Yes 24 15 3 9 15 No 0 1 17 15 1 Maybe 1 9 5 1 9
  • 4. Tally/Frequency percentage Question No. 1 Question No. 2 Question No. 3 Yes No Maybe Yes No Maybe Yes No Maybe 0% 11% 12% 20% 36% 60% 4% 89% 68% Question No. 4 Question No. 5 Yes No Maybe Yes No Maybe 4% 36% 36% 60% 60% 4%
  • 5. 50 respondents (Employee and Client/Customer) 50 45 40 35 30 25 20 15 10 5 0 Question No. 1 Question No. 2 Question No. 3 Question No. 4 Question No. 5 Yes 44 30 11 19 27 No 2 5 25 26 4 Maybe 4 15 14 5 19
  • 6. Tally/Frequency percentage Question No. 1 Question No. 2 Question No. 3 Yes No Maybe Yes No Maybe Yes No Maybe 4% 8% 22% 30% 28% 60% 10% 88% 50% Question No. 4 Question No. 5 Yes No Maybe Yes No Maybe 10% 38% 38% 54% 52% 8%
  • 7. Formula: R=No. of respondent R=? N=No. of people N=100 e=Margin of error e=10 %( 0.1)
  • 8. Formula: 50 respondents from Employee & Client/Customer QUESTION NO.1 Yes No Maybe Classes Tally/Frequency Degree p) f) Yes 44 88 316.8 No 2 4 14.4 Maybe 4 8 28.8 R= 50 respondent 100 =360
  • 9. QUESTION NO.2 Yes No Maybe Classes Tally/Frequency Degree p) f) Yes 30 60 216 No 5 10 36 Maybe 15 30 108 R= 50 respondent 100 =360
  • 10. QUESTION NO.3 Yes No Maybe Classes Tally/Frequency Degree p) f) Yes 11 22 79.2 No 25 50 180 Maybe 14 28 100.8 R= 50 respondent 100 =360
  • 11. QUESTION NO.4 Yes No Maybe Classes Tally/Frequency Degree p) f) Yes 19 38 136.8 No 26 52 187.2 Maybe 5 10 36 R= 50 respondent 100 =360
  • 12. QUESTION NO.5 Yes No Maybe Classes Tally/Frequency Degree p) f) Yes 27 54 194.4 No 4 8 28.8 Maybe 19 38 136.8 R= 50 respondent 100 =360
  • 13. 25 respondents from Employee QUESTION NO.1 Yes No Maybe Classes Tally/Frequency Degree p) f) Yes 20 80 288 No 2 8 28.8 Maybe 3 12 43.2 R= 25 respondent 100 =360
  • 14. QUESTION NO.2 Yes No Maybe Classes Tally/Frequency Degree p) f) Yes 15 60 216 No 4 16 57.6 Maybe 6 24 86.4 R= 25 respondent 100 =360
  • 15. QUESTION NO.3 Yes No Maybe Classes Tally/Frequency Degree p) f) Yes 8 32 115.2 No 8 32 115.2 Maybe 9 36 129.6 R= 25 respondent 100 =360
  • 16. QUESTION NO.4 Yes No Maybe Classes Tally/Frequency Degree p) f) Yes 10 40 144 No 11 44 158.4 Maybe 4 16 57.6 R= 25 respondent 100 =360
  • 17. QUESTION NO.5 Yes No Maybe Classes Tally/Frequency Degree p) f) Yes 12 48 172.8 No 3 12 43.2 Maybe 10 40 144 R= 25 respondent 100 =360
  • 18. 25 respondents from Client/Customer QUESTION NO.1 Yes No Maybe Classes Tally/Frequency Degree p) f) Yes No Maybe R= 25 respondent 100 =360
  • 19. QUESTION NO.2 Yes No Maybe Classes Tally/Frequency Degree p) f) Yes No Maybe R= 25 respondent 100 =360
  • 20. QUESTION NO.3 Yes No Maybe Classes Tally/Frequency Degree p) f) Yes 3 No 17 Maybe 5 R= 25 respondent 100 =360
  • 21. QUESTION NO.4 Yes No Maybe Classes Tally/Frequency Degree p) f) Yes 9 No 15 Maybe 1 R= 25 respondent 100 =360
  • 22. QUESTION NO.5 Yes No Maybe Classes Tally/Frequency Degree p) f) Yes 15 No 1 Maybe 9 R= 25 respondent 100 =360
  • 23. Formula used: ITS= Individual Total Score A= Number of persons who mark Yes B= Number of persons who mark No C= Number of persons who mark Maybe X= Total number of respondents 50 respondents (Employee and Client/Customer) = 4.84 Yes = 4.5 Yes
  • 24. = 3.72 No = 3.86 No = 4.46 Yes
  • 25. 25 respondents (Employee) = 4.72 Yes = 4.44 Yes = 4.00 Yes
  • 26. = 3.96 No = 4.36 Yes
  • 27. 25 respondents (Client/Customer) = 4.96 Yes = 4.56 Yes = 3.44 No
  • 28. = 3.76 No = 4.56 Yes Scale Table SCALE INTERPRETATION 5.00-4.00 Yes 3.99-2.51 No 2.50-1.00 Maybe