UiPath Community: Communication Mining from Zero to Hero
GAA sept09 Shrimp Sensory Trial - Nunes-Castro
1. seafood safety
Omega-3 Feed Enrichment Improves
Consumer Acceptance Of Shrimp Tails
ucts with omega-3 fatty acids and color
enhancement are typical objectives that
affect product differentiation and related
consumer purchasing choices.
The authors carried out a study to eval-
uate the effects of three dietary lipid
sources on Litopenaeus vannamei tail com-
position and consumers’ level of acceptance
of the white shrimp product.
Shrimp Culture
Juvenile shrimp of 11.4 ± 2.0 g weight
were reared for nine weeks in 500-L exper-
imental clearwater tanks and fed one of
four diets. The diets were similar in nutri-
tive levels except their essential fatty acid
(EFA) profiles, which varied as a result of
the main oil sources used and their inclu-
sion levels in the diets.
Two diets with fish oil and krill oil were
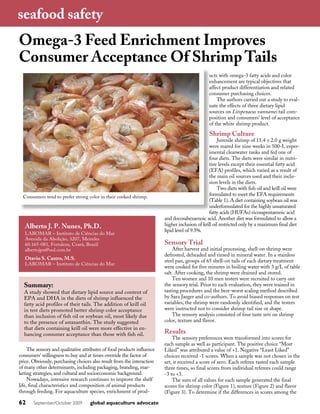
Consumers tend to prefer strong color in their cooked shrimp.
formulated to meet the EFA requirements
(Table 1). A diet containing soybean oil was
underformulated for the highly unsaturated
fatty acids (HUFAs) eicosapentaenoic acid
and docosahexaenoic acid. Another diet was formulated to allow a
Alberto J. P. Nunes, Ph.D. higher inclusion of krill oil restricted only by a maximum final diet
lipid level of 9.5%.
LABOMAR – Instituto de Ciências do Mar
Avenida da Abolição, 3207, Meireles
60.165-081, Fortaleza, Ceará, Brazil Sensory Trial
albertojpn@uol.com.br After harvest and initial processing, shell-on shrimp were
defrosted, deheaded and rinsed in mineral water. In a stainless
Otavio S. Castro, M.S. steel pan, groups of 65 shell-on tails of each dietary treatment
LABOMAR – Instituto de Ciências do Mar
were cooked for five minutes in boiling water with 3 g/L of table
salt. After cooking, the shrimp were drained and stored.
Ten women and 10 men testers were recruited to carry out
Summary: the sensory trial. Prior to each evaluation, they were trained in
A study showed that dietary lipid source and content of tasting procedures and the best-worst scaling method described
EPA and DHA in the diets of shrimp influenced the by Sara Jaeger and co-authors. To avoid biased responses on test
fatty acid profiles of their tails. The addition of krill oil variables, the shrimp were randomly identified, and the testers
in test diets promoted better shrimp color acceptance were instructed not to consider shrimp tail size or shape.
than inclusion of fish oil or soybean oil, most likely due The sensory analysis consisted of four taste sets on shrimp
to the presence of astaxanthin. The study suggested color, texture and flavor.
that diets containing krill oil were more effective in en-
hancing consumer acceptance than those with fish oil. Results
The sensory preferences were transformed into scores for
each sample as well as participant. The positive choice “Most
The sensory and qualitative attributes of food products influence Liked” was attributed a value of +1. Negative “Least Liked”
consumers’ willingness to buy and at times override the factor of choices received -1 scores. When a sample was not chosen in the
price. Obviously, purchasing choices also result from the interaction set, it received a score of zero. Each referee tasted each sample
of many other determinants, including packaging, branding, mar- three times, so final scores from individual referees could range
keting strategies, and cultural and socioeconomic background. -3 to +3.
Nowadays, intensive research continues to improve the shelf The sum of all values for each sample generated the final
life, final characteristics and composition of animal products scores for shrimp color (Figure 1), texture (Figure 2) and flavor
through feeding. For aquaculture species, enrichment of prod- (Figure 3). To determine if the differences in scores among the
62 September/October 2009 global aquaculture advocate
2. Table 1. Main lipid sources, inclusion levels
and fatty acid composition of test diets.
Fish Soybean Krill Krill
Chemical Composition Oil Oil Oil Oil
Nutritional Levels
Testers gave high
scores on color and Crude protein (g/kg, wet basis) 351.80 354.40 353.50 353.10
flavor for shrimp Crude fiber (g/kg, wet basis) 12.00 9.00 13.30 12.00
fed diets with krill Ash (g/kg, wet basis) 93.70 89.50 91.00 82.30
oil. For texture, they Inclusion of Lipid Sources
preferred shrimp fed
a diet with fish oil. Fish oil (g/kg, wet basis) 266.00 0 0 0
Krill oil (g/kg, wet basis) 0 0 483.00 550.00
Soybean oil (g/kg, wet basis) 100.00 345.00 44.00 38.00
Cholesterol (g/kg, wet basis) 0 13.00 0 4.00
Soybean lecithin (g/kg,
wet basis) 150.00 150.00 0 0
Marine oil:plant oil ratio 2.70 0 11.00 14.40
Nutrient Levels
40 Total lipid content (g/kg,
wet basis) 88.80 94.00 80.80 91.30
30
Best-Worse Score
c DHA (% total lipid content) 2.54 0.28 1.60 1.37
20 EPA (% total lipid content) 5.10 0.65 5.35 5.07
c
HUFAs (% total lipids) 7.64 0.93 6.94 6.44
10 LOA (% total lipids) 28.32 44.71 16.21 17.97
0 LNA (% total lipids) 3.40 4.91 1.52 2.03
a Krill Oil Krill Oil EFAs (% total lipids) 39.36 50.54 24.68 26.44
(483 g/kg) (550 g/kg)
-10 b Astaxanthin (ug/100 ul) 13.80 14.70 21.40 17.30
-20 DHA = Docosahexaenoic acid, EPA = Eicosapentaenoic acid
Fish Oil LOA = Linoleic acid, LNA = Linolenic acid
-30
Table 2. Fatty acid profiles of shrimp tails.
-40
Soybean Oil
Profile (% total lipid content)
Figure 1. Sensory trial scores for shrimp color. Different letters
in bars denote significant (a = 0.05) difference. Fish Krill Oil Soybean Krill Oil
Fatty Acids Oil (483 g/kg) Oil (550 g/kg)
10 Linoleic acid 14.93 11.10 26.94 11.53
8 Linolenic acid 0.63 0.54 1.30 0
Docosahexaenoic acid 5.34 4.22 3.53 5.66
Best-Worse Score
6 Eicosapentaenoic acid 10.09 11.50 6.60 13.92
4
2 samples were statically significant, a non-parametric Mann-
0 Whitney U test was carried out for each variable.
Fish Oil Krill Oil (483 g/kg)
-2
Shrimp Color, Texture, Flavor
-4
Soybean Oil Krill Oil With 65% of all positive choices, shrimp fed the diet with
-6 the greater krill oil content received the highest final score for
(550 g/kg)
-8 shrimp color, followed by the other diet with krill oil. The diet
-10 with soybean oil was chosen as worst in color in 68% of all tastes.
Variations in shrimp texture preference were very slight, and
Figure 2. Sensory trial scores for shrimp texture. no significant (P > 0.05) differences were found among the
tasted shrimp. As the shrimp tails were shell-on, differences
15 resulting from variations in shrimp body weight and/or molting
stage could have influenced the scoring.
Best-Worse Score
10 Shrimp fed the diet with greater krill oil obtained the highest
c
5
score for shrimp flavor. The other krill diet had results not sig-
bc nificantly different from the fish fed feed with fish oil. Despite
0 this, shrimp fed the diet with fish oil were negatively chosen
ab Krill Oil Krill Oil
(483 g/kg) a almost two-fold more often than the shrimp fed krill-supple-
Fish Oil (550 g/kg)
-5 mented feed. Shrimp fed the diet with soybean oil had the low-
est flavor score and the highest percentage of negative choices,
-10 although it did not significantly differ from the diet with fish oil.
Soybean Oil Shrimp tails from animals fed diets containing increased lev-
-15
els of HUFAs – those with added fish or krill oil – showed
Figure 3. Sensory trial scores for shrimp flavor. Different letters in higher amounts of these fatty acids than shrimp fed the soy oil
bars denote significant (a = 0.05) difference. diet (Table 2).
global aquaculture advocate September/October 2009 63