![Winter 1996 45
For decades, production logs have been
used in new wells to optimize ultimate
recovery and to help avoid potential pro-
duction problems. In older wells, these logs
aid in diagnosing declining production and
planning remedial work.1
From the outset, production logging (PL)
has been used to determine the dynamic pat-
terns of flow rates of water, oil and gas under
stable producing or injecting conditions by
answering the following questions: How
much of the well is flowing? Which zones are
producing oil, water and gas? How much of
each type of fluid is flowing from each zone?
Ideally, PL techniques should identify each
fluid, measure the volume fraction of each
fluid in the pipe—called the holdup—and
its velocity, and from these compute flow
rates.2 Traditional PL measurements use tur-
bine flowmeters called spinners for velocity,
gradiomanometers for density, capacitance
for holdup, manometers for pressure and
thermometers for temperature. Of these five
measurements, only velocity and density
tend to be used in traditional quantitative
PL analysis.
The reliability of the data generated by
traditional PL logging depends almost
exclusively on the type of well being
logged. In vertical wells with high flow
rates—usually from 200 to 5000 B/D [30 to
800 m3/d], depending on the tool used and
the pipe diameter—these PL measurements
and their analysis usually produce reliable
results. However, in some wells, phenom-
ena such as flow behind casing or inter-
zone flow make traditional PL difficult.
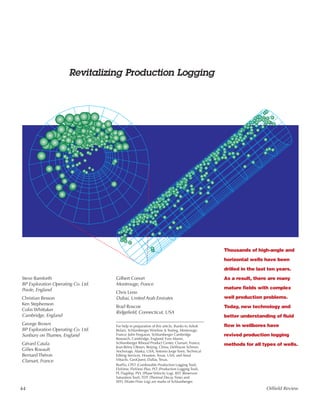
The upsurge in deviated and horizontal
wells creates boreholes with very different
fluid flow characteristics from vertical wells,
adding further complexity to multiphase
flow and radically changing the physics and
technology of fluid-flow measurement
(above). In gas-and-liquid or oil-and-water
flow, the lighter phase moves rapidly along
the high side of the borehole, establishing a
circulating current that often causes a back-
flow along the lower side (see “Fluid Flow
Fundamentals,” page 61).
Depending on the borehole deviation, the
velocity and holdup of the different phases
can change dramatically for any given flow
rate. In these circumstances, traditional PL
measurements may become unreliable.3
This article looks at how new techniques are
helping to shed light on flow in complex
vertical wells, and to deliver PL measure-
ments in deviated and horizontal wells.
,,,,,
,,,,,
,,,,,
,
,,,,,
Stagnant gas Failed external
casing packer
Fault
Formation
instability
Oil layer
Cuttings Fractures
Water
Gas
,,,
,,
,,,
ssThe challenges facing production log-
ging in horizontal wells. Trapped fluids
can directly affect production and influ-
ence the data from a production log, espe-
cially sensors such as spinners and capac-
itance tools. Because horizontal wells
inevitably have doglegs and undulations,
stagnant water may lie either inside or out-
side the casing in low areas at the bottom
of the well; stagnant gas may accumulate
on the high side of drainhole undulations.
These nonflowing fluids distort measure-
ments. Changes in the flowing cross-sec-
tional area have a direct impact on spin-
ner response (inset, left). Horizontal wells
are frequently completed uncemented,
using prepacked screens or slotted liners
with external casing packers (ECPs). An
ECP that fails to set properly or formation
collapse create volume changes that
affect flow velocities. Faults, fractures and
formation instabilities may cause fluid
crossflow. Cuttings on the low side of the
borehole may alter fluid velocities and
result in erroneous readings.
1. Wade RT, Cantrell RC, Poupon A and Moulin J: “Pro-
duction Logging (The Key to Optimum Well Perfor-
mance,” Journal of Petroleum Technology 17 (Febru-
ary 1965): 137-144.
2. For an authoritative treatment of multiphase flow: Hill
AD: ”Production Logging-Theoretical and Interpreta-
tive Elements,” SPE Monograph 14, 1990.
3. Brown G: ”Using Production-Log Data From Horizon-
tal Wells,” Transactions of the SPWLA 36th Annual
Logging Symposium, Paris, June 26-29, 1995, paper SS.](data:image/gif;base64,R0lGODlhAQABAIAAAAAAAP///yH5BAEAAAAALAAAAAABAAEAAAIBRAA7)
Empfohlen
Empfohlen
Weitere ähnliche Inhalte
Was ist angesagt?
Was ist angesagt? (20)
Andere mochten auch
Andere mochten auch (20)
Ähnlich wie registro de pozoz
Ähnlich wie registro de pozoz (20)
Mehr von opulento22
Kürzlich hochgeladen
Kürzlich hochgeladen (20)
registro de pozoz
- 1. 44 Oilfield Review Steve Bamforth BP Exploration Operating Co. Ltd. Poole, England Christian Besson Ken Stephenson Colin Whittaker Cambridge, England George Brown BP Exploration Operating Co. Ltd. Sunbury on Thames, England Gérard Catala Gilles Rouault Bernard Théron Clamart, France Gilbert Conort Montrouge, France Chris Lenn Dubai, United Arab Emirates Brad Roscoe Ridgefield, Connecticut, USA For help in preparation of this article, thanks to Ashok Belani, Schlumberger Wireline & Testing, Montrouge, France; John Ferguson, Schlumberger Cambridge Research, Cambridge, England; Yves Manin, Schlumberger Riboud Product Center, Clamart, France; Jean-Rémy Olesen, Beijing, China; DeWayne Schnorr, Anchorage, Alaska, USA; Antonio Jorge Torre, Technical Editing Services, Houston, Texas, USA; and Amal Vittachi, GeoQuest, Dallas, Texas. BorFlo, CPLT (Combinable Production Logging Tool), FloView, FloView Plus, PLT (Production Logging Tool), PL Flagship, PVL (Phase Velocity Log), RST (Reservoir Saturation Tool), TDT (Thermal Decay Time) and WFL (Water Flow Log) are marks of Schlumberger. Revitalizing Production Logging Thousands of high-angle and horizontal wells have been drilled in the last ten years. As a result, there are many mature fields with complex well production problems. Today, new technology and better understanding of fluid flow in wellbores have revived production logging methods for all types of wells.
- 2. Winter 1996 45 For decades, production logs have been used in new wells to optimize ultimate recovery and to help avoid potential pro- duction problems. In older wells, these logs aid in diagnosing declining production and planning remedial work.1 From the outset, production logging (PL) has been used to determine the dynamic pat- terns of flow rates of water, oil and gas under stable producing or injecting conditions by answering the following questions: How much of the well is flowing? Which zones are producing oil, water and gas? How much of each type of fluid is flowing from each zone? Ideally, PL techniques should identify each fluid, measure the volume fraction of each fluid in the pipe—called the holdup—and its velocity, and from these compute flow rates.2 Traditional PL measurements use tur- bine flowmeters called spinners for velocity, gradiomanometers for density, capacitance for holdup, manometers for pressure and thermometers for temperature. Of these five measurements, only velocity and density tend to be used in traditional quantitative PL analysis. The reliability of the data generated by traditional PL logging depends almost exclusively on the type of well being logged. In vertical wells with high flow rates—usually from 200 to 5000 B/D [30 to 800 m3/d], depending on the tool used and the pipe diameter—these PL measurements and their analysis usually produce reliable results. However, in some wells, phenom- ena such as flow behind casing or inter- zone flow make traditional PL difficult. The upsurge in deviated and horizontal wells creates boreholes with very different fluid flow characteristics from vertical wells, adding further complexity to multiphase flow and radically changing the physics and technology of fluid-flow measurement (above). In gas-and-liquid or oil-and-water flow, the lighter phase moves rapidly along the high side of the borehole, establishing a circulating current that often causes a back- flow along the lower side (see “Fluid Flow Fundamentals,” page 61). Depending on the borehole deviation, the velocity and holdup of the different phases can change dramatically for any given flow rate. In these circumstances, traditional PL measurements may become unreliable.3 This article looks at how new techniques are helping to shed light on flow in complex vertical wells, and to deliver PL measure- ments in deviated and horizontal wells. ,,,,, ,,,,, ,,,,, , ,,,,, Stagnant gas Failed external casing packer Fault Formation instability Oil layer Cuttings Fractures Water Gas ,,, ,, ,,, ssThe challenges facing production log- ging in horizontal wells. Trapped fluids can directly affect production and influ- ence the data from a production log, espe- cially sensors such as spinners and capac- itance tools. Because horizontal wells inevitably have doglegs and undulations, stagnant water may lie either inside or out- side the casing in low areas at the bottom of the well; stagnant gas may accumulate on the high side of drainhole undulations. These nonflowing fluids distort measure- ments. Changes in the flowing cross-sec- tional area have a direct impact on spin- ner response (inset, left). Horizontal wells are frequently completed uncemented, using prepacked screens or slotted liners with external casing packers (ECPs). An ECP that fails to set properly or formation collapse create volume changes that affect flow velocities. Faults, fractures and formation instabilities may cause fluid crossflow. Cuttings on the low side of the borehole may alter fluid velocities and result in erroneous readings. 1. Wade RT, Cantrell RC, Poupon A and Moulin J: “Pro- duction Logging (The Key to Optimum Well Perfor- mance,” Journal of Petroleum Technology 17 (Febru- ary 1965): 137-144. 2. For an authoritative treatment of multiphase flow: Hill AD: ”Production Logging-Theoretical and Interpreta- tive Elements,” SPE Monograph 14, 1990. 3. Brown G: ”Using Production-Log Data From Horizon- tal Wells,” Transactions of the SPWLA 36th Annual Logging Symposium, Paris, June 26-29, 1995, paper SS.
- 3. 46 Oilfield Review When to Run Production Logs Generally, PL has two important applica- tions: measuring well performance with respect to reservoir dynamics and analyzing mechanical problems in the borehole. Although decisions to run production logs usually depend on specific reservoir eco- nomics, there are general guidelines. First, PL may be used in new wells to eval- uate initial production and verify the integrity of the completion—for example, indicating where there is flow behind cas- ing. When initial performance does not meet expectations, information from PL may often point to remedial work to optimize production and suggest different completion techniques for future wells. A special use of PL in horizontal, high-rate wells is to verify friction-induced production loss in long drainholes. This friction loss sometimes negates any extra productivity expected from the long drainhole, and a better choice would be to drill multiple, shorter lateral sections in a stacked or fan- shaped pattern.4 Second, PL should be considered for any well that shows sudden decreases in pro- duction or increases in gas/oil ratio (GOR) or water cut. Third, just as a yearly checkup by a physi- cian is prudent, PL may be used periodically to detect problems such as water or gas con- ing, or fingering before extensive production loss occurs. This is particularly important for dump-flood wells, where PL is the only monitoring method.5 Fourth, injection wells may be initially analyzed and then monitored with PL. Knowledge of where injected fluids are going is critical for avoiding undesired flooding that leads to serious problems such as casing-annulus crossflow, the creation of unswept and trapped hydrocarbons, and water-wet damaged formations. 1:200 m X50 X25 Radius of Bit 0 10 Openhole Sw 1993 100 p.u. 0 Openhole Porosity 50 p.u. 0 Openhole Porosity 50 p.u. 0 Downhole Flow Rate 0 B/D 10000 RST Oil 1996 1996 100 p.u. 0 Openhole Sw 1993 50 p.u. 0 Openhole Fluid Volume 1996 50 p.u. 0 RST Fluid Volume GR (C.H.)-GR (O.H.) 1 0 0 Borehole Water Borehole Oil Casing Wall Assumed Cement Sheath Formation Perforated Zone Nonmovable Oil (O.H.) Water Shale 1 Shale 2 Feldspar Quartz Calcite RST Oil 1996 Water Oil Gas Scales 4 Zone 3 2 1 ssOpenhole CPLT-RST evaluation from South China Sea. Track 1 (left) contains a well sketch with casing (black) and a cemented casing-formation annulus (gray hatching). Uranium scale was indicated by the difference in natural gamma ray activity between the openhole and most recent cased-hole gamma ray survey. Track 2 contains the open- hole log and the latest RST water saturation analysis. Track 3 shows the production logs and static-fluid volume analysis in the formation. The top of Zone 3 at X41 and the top half of Zone 2 at X47 still shows some unproduced oil. Zones 1 and 4 are completely depleted. The production logs shows most of the water production coming from the top of Zone 2 at X46 m.
- 4. Winter 1996 47 The ability to carry out downhole PL mea- surements in a stabilized well under dynamic conditions is the key to successful production management. The resulting downhole flow-rate determination may be compared with stabilized surface flow rates. This quantitative comparison between downhole and surface flow rates allows detection of any surface-to-downhole dis- crepancies caused by such factors as tubing leaks, thief zones, unwanted fluid entries or other hydraulic malfunctions. Production Logging in Vertical Wells Increasingly, operators incorporate PL into their reservoir monitoring programs. Today, this often includes cased-hole saturation logging techniques—such as thermal-neu- tron decay time or carbon-oxygen measure- ments—run in combination with traditional PL tools to provide an enhanced under- standing of reservoir dynamics.6 The RST Reservoir Saturation Tool can be used to make a snapshot of reservoir satura- tion. Repeating these measurements over time helps monitor changes in reservoir sat- uration. But the dynamic description of flow conditions obtained from production log profiles is absolutely necessary to unravel complex commingled production in a many wells. For example, to gain a clear picture of pro- duction dynamics in a declining reservoir, the CPLT Combinable Production Logging Tool log and the RST technique were used in com- bination in a reservoir located in the Pearl River Mouth basin in the South China Sea. The reservoir, a sand-shale sequence, was producing from four commingled sand- stone formations, and the operator needed to understand current reservoir production on a layer-by-layer basis. The CPLT-RST reservoir monitoring suite was deployed in a well located at the top of the reservoir (previous page). Openhole well evalua- tions, with the latest hydrocarbon volume from RST C/O monitoring, showed the changes in reservoir saturations. The lowest zone had been completely depleted, as had about half of the next zone. A cased-hole versus openhole gamma ray comparison revealed evidence of sub- stantial scale buildup in the lowest perfo- rated zones. This indicated that large vol- umes of water had been produced from the lower zones, and scale could potentially plug perforations. The production logs provided the key to understanding what was happening in the well. The flowmeter and gradiomanometer profiles showed that there was only a little fluid production, mostly water, coming from the lowest perforations. About 60% of the total water production came from the sec- ond lowest set of perforations, and most of that from just 2 m [6.5 ft] of the upper sec- tion of perforations. Surprisingly, the RST monitor log indicated that water production was coming from a fully oil-bearing part of the formation. It was suspected that the water was coning up from the bottom part of the zone, now com- pletely depleted of hydrocarbons. Logs from other wells, downdip in the reservoir, con- firmed this conclusion. Reducing the draw- down pressures may allow production of the bypassed hydrocarbons, still contained in this zone, to continue. In the well’s second highest perforated zone, the RST monitor logs showed a signif- icant oil-water contact (OWC). The lowest half of the zone was fully depleted, whereas the upper half was untouched by produc- tion. Unexpectedly, production log profiles indicated greater hydrocarbon production than water, perhaps because scale had plugged the lower perforations in the watered-out part of the zone. The upper per- forations in this zone did not appear to be plugged by scale, yet the production profiles showed minimal contribution over the entire interval. This result confirmed the diagnosis from RST monitoring logs that the upper formation layer had been swept of all movable hydrocarbons. Another example, this time in a vertical well with a thief zone and borehole water entry, occurred in India’s offshore Bombay High field, operated by Indian Oil and Nat- ural Gas Commission (ONGC). The reser- voir was under waterflood, and the operator needed to identify zones of water entry and to determine whether flow was occurring behind the casing. It was also suspected that injection water had broken through and was being produced from one of five sets of perforations. A WFL Water Flow Log tool was com- bined with the PLT Production Logging Tool log to distinguish between flow inside and outside the casing (see “Fluid-Flow Logging Using Time-of-Flight,” page 50). The down- hole flow rates were complex. The top of the lowest set of perforations, Zone 5, pro- duced only small quantities of water. There was a large increase in water flow coming from the second lowest set of perforations. A modest amount of oil, 400 BOPD [63 m3/d], was also produced from this zone. The middle set of perforations, Zone 3, also produced 1000 BWPD [160 m3/d] with only a small amount of oil. The second highest set of perforations showed no fluid production (next page). 4. Hill D, Neme E, Ehlig-Economides C and Mollinedo M: ”Reentry Drilling Gives New Life to Aging Fields,” Oilfield Review 8, no. 3 (Autumn 1996): 4-17. 5. In dump-flood wells, water is produced from an aquifer and injected into a producing formation in the same well. 6. Albertin, I, Darling, H, Mahdavi, M, Plasek R, Cedeño I, Hemingway J, Richter P, Markley M, Olesen J-R, Roscoe B and Zeng W: “The Many Facets of Pulsed Neutron Cased Hole Logging,” Oilfield Review 8, no. 2 (Summer 1996): 28-41. An essential input for RST-A C/O monitoring logging is the oil holdup in the borehole. The PL gradiomanome- ter provides this measurement.
- 5. 48 Oilfield Review With the top set of perforations—Zone 1— the picture changed dramatically. Here, more than half of the production from the four zones below disappeared into the for- mation. Zone 1 was acting as a major thief zone, consuming 120 BOPD [19 m3/d] and about 2200 BWPD [350 m3/d] from the well. This unusual crossflow, verified by WFL results, indicates a pressure differential between the two formation layers, which was not present when the well was initially put on production. The WFL survey also indicated that there was no channeling behind the casing. Armed with this knowledge, the operator had two choices for remediation—squeeze the perforations in the lowest zones (3 to 5) to prevent water production, or isolate Zones 1 and 2 using a dual-completion scheme, putting the long string on gas lift, and allowing continued production of 400 BOPD [64 m3/d] from Zone 4. Nonvertical Production Logging Once a well substantially deviates from vertical and multiphase flow becomes complex, spinner tools often indicate only reverse flow—especially when the spinner is not centralized in the borehole, but lying near the bottom where the reverse flow is found (next page, right).7 Capacitance tools may also measure the lower, denser phase of the fluid giving misleading holdup data. As the well’s angle increases to horizontal, flow becomes entirely stratified, and the averaged mixture velocity from a flowmeter spinner alone is meaningless. Other phenomena affect PL measurements in deviated and horizontal wells. For exam- ple stagnant fluids may confuse sensors; fractures and faults may allow crossflow; and failed external packers may introduce variable flow regimes (see page 45). Horizontal and many deviated wells are often completed either open hole, with uncemented slotted liners or with prepacked screens.8 Such completions introduce other special fluid-flow and pro- duction problems that usually are not encountered in vertical, cased wells—such as flow restrictions due to the logging tool in the pipe forcing fluids to channel through the liner-formation annulus. Furthermore, a 0 12 24 36 48 60 0 300 600 900 1200 Countrate,cpsCountrate,cps 1500 0 12 24 36 48 60 0 10 20 30 40 50 GR API Measured Fluid Velocity ft/min 1:200 0 60 0 125 X390 5 4 3 2 1 X380 X370 Measured Fluid Density gm/cm3 0 125 Measured Temperature °F WFL Water Flow Rate BWPD 243 245 Reconstructed Fluid Velocity ft/min 0 125 Reconstructed Fluid Density gm/cm3 0 125 Downhole Flow Rate B/D Gas Oil Water 0.0 6000.0 0.0 6000.0 200 160 120 80 40 0 0 12 24 36 48 60 0 12 24 36 48 60 0 100 200 300 400 500 Time, sec 0 12 24 36 48 60 0 40 80 120 160 200 0 12 24 36 48 60 0 40 80 120 160 Time, sec 200 GR Far Near GR Far Near Zone ssThief zone in vertical well. The PLT-WFL interpretation analysis indicated that Zone 1 is removing more than 120 BOPD and 2200 BWPD from the well. Crossflow had been set up by the injection and production schemes. At X354, the WFL decay-time distributions showed a flow rate over 2000 BWPD inside the casing (inset, above right). At X393 m, the WFL decay-time distribu- tions showed that no flow was detected (inset, right).
- 6. Winter 1996 49 special problem occurs near the uphole end of a slotted liner. Here, annular fluids are forced out of the annulus back into the liner or casing, resulting in significant turbulence that tends to mix the fluids. This turbulence can encourage backflow to develop on the low side of the hole, which can seriously affect flowmeter readings. In horizontal wells completed with con- ventional cemented liners, flowmeter spin- ner profiles look more like their vertical counterparts, often showing smooth, distinct evenly-separated profiles when recorded at different speeds.9 However, cementing in horizontal wells is usually not as successful as in vertical wells because the liner is decentralized within the borehole, often leading to cement voids and channels with accompanying annular production. Other problems in horizontal completions include acceleration of fluids due to gravity when undulations in the well profile are suf- ficiently large. If peaks of the flowmeter mea- surements are taken as representative of the full mixture velocity, the trend is an increase in velocity where the well turns downward and a decrease as the flow reaches the trough of the undulation. Backflow always appears to occur in inverted, undulating wells where the heavy phase falls down the low side of the drainhole. In many cases, the heavy phase (usually water) simply circulates in the sump and is not produced. Delivering Data from Deviated Wells Success in isolating crossflow problems in the offshore Bombay well convinced the operator to try a combined WFL-PLT approach in a cased-hole, deviated well that was producing oil, water and gas. The oper- ator was unsure of the exact location of the water entry zones and whether these could be sealed off using cement squeezes to reduce water cut. Again, channeling behind casing was sus- pected. This time, the WFL measurements showed this, and confirmed the PLT measure- ments in a difficult environment. The spinner tool data below X050 indicated downflow, the temperature gradient suggested possible upward fluid movement and the gra- diomanometer tool showed a single-phase fluid below X050—a very confusing picture. The spinner measurement was presumed unreliable in this zone, as it had insufficient resolution to measure low apparent flow. The thermometer was affected by fluid movement inside and outside the casing, but could not differentiate between the two flow regions. The WFL data helped resolve the dilemma, by distinguishing between flows inside and outside the casing (above left). In this case, water was flowing outside ,,,,,,,, ,,,, ,,,, ,,,, Water flow Gas flow ssBackflow as drain- hole moves towards vertical. In highly deviated or horizon- tal wells and at low fluid velocities, buoyancy forces tend to segregate fluids. The lighter phase flows in the upper part of the pipe dragging along with it some of the heavier phase. Sometimes part of the heavier phase moves down- wards due to grav- ity, causing a circu- lation within the pipe. Badly central- ized flowmeters in the lower portion of the deviated pipe will respond to this downward flow. 7. In this article, the range of deviated wells will include moderate to the so-called “high angle” 30° to 85° from vertical; horizontal wells range from 85° to 95°. 8. Brown G, reference 3. 9. Spinner turn rates are calibrated by logging at different cable speeds. Countrate,cps Flow Outside Pipe Flow Inside Pipe Countrate,cps 400 320 240 160 80 0 12 24 36 48 60 2200 880 440 0 1760 1320 Time, sec 12 24 36 48 60 Time, sec Velocity = 8.5 ft/min Rate = 439 BWPD Background Total count rate Background Total count rate Velocity = 8.8 ft/min Rate = 850 BWPD ssDistinguishing between water flow inside and outside casing. Time-of-flight gamma ray time-decay distributions indicated whether the flow is inside or outside the casing. The lower graph shows the response when water is flowing inside the casing. The blue shaded area reflects the final time-decay response to flowing water after the background and standing water signals have been removed. The blue area had a sharply peaked response, which indicated that the slug of activated water flow occurred in a smooth cross-sectional pipe area without dispersion. The top graph indicates the magnitude and shape of the time-decay response when flow is outside casing. Here the time distribution was much broader, reflecting slug disper- sion as it flowed around the outside of cas- ing. Lower total counting rates are due to gamma ray attenuation in the casing. (continued on page 52)
- 7. 50 Oilfield Review Several years ago, the WFL Water Flow Log tech- nique was introduced using the TDT-P Thermal Decay Time tool to provide water-velocity data, first in vertical wells, then later in deviated and horizontal wells.1 Today, the RST Reservoir Satu- ration Tool log provides water-velocity information with more precision.2 A burst of fast neutrons from the RST tool activates oxygen atoms in a small region surrounding the neutron source in the tool. This includes any oxygen in the water flowing in the pipe. Oil does not contain oxygen and there- fore is not affected. Activated oxygen atoms, in a process like fluorescence, give off radiation, in the form of gamma rays, radiating for a short time after the neutron burst. Moving water in the pipe will carry a cloud of activated oxygen with it past the detectors in the tool (above right). The time between the neutron burst and the detection of the activated water cloud will be a time-of-flight for the water flow in the pipe, and is used to compute water velocity. The half-life of the oxygen activation is only seven sec- onds, so after a few minutes, the activation radia- tion has subsided to an undetectable level, making the measurement environmentally safe. There are two detectors in the RST tool.The tool can use a variable neutron burst width from 0.1 to 3 sec with delays from 3.5 to 20 sec to measure water-flow rates from as low as 6 ft/min [1.8 m/min] to as high as 500 ft/min [152 m/min]. The RST tool may be inverted to measure downward water flow. An additional gamma ray (GR) detector may be incorporated in the logging tool string to measure higher velocities. The RST-WFL technique may be used to mea- sure other parameters. The total activation count rate is proportional to the volume of water acti- vated by the neutron burst, and therefore is a mea- sure of the water holdup in the pipe. The time pro- file, or shape, of the activation count rate distribution carries information about whether the activated water is flowing near the tool in the bore- hole or behind the casing pipe in the annulus. Fluid-Flow Logging Using Time-of-Flight Casing Minitron Water Oil Near count rate Far count rate GR count rate ssWFL Water Flow Log Measurements. A short burst of neutrons activates oxygen in the surrounding water, and flowing water carries the activated cloud at the water velocity. Source-detector distances and time-of-flight are used to determine the water velocity. 0 10 20 30 40 50 60 70 80 90 Time, sec Casing Water Oil PVL Phase Velocity Log sonde Oil-miscible marker RST tool Near detector borehole sigma indicatorMarker signal ss PVL Phase Velocity Log technique. A slug of oil-miscible marker fluid is injected into the flowing oil phase, and is detected by the RST tool. The time-of-flight between injection and slug detection along with the distance between the injector tool and RST detector gives the oil velocity. The same process is used for water phase-velocity measurements except a water-miscible marker compound is injected into the heavier phase.
- 8. Winter 1996 51 For horizontal wells, fluid flows are stratified, with the light phase moving rapidly in the upflow sections of the well along the high side of the borehole. Slight changes in borehole deviation cause large changes in fluid holdup and the veloci- ties of different phases, making it necessary to know all fluid velocities. Spinners are usually not applicable in stratified flow, and radioactive trac- ers are useful useful only for water-velocity mea- surements, because there are no oil-miscible forms available. Radioactive tracers also have strict procurement and safety issues. The PVL Phase Velocity log also uses a time-of- flight method to measure both oil and water veloc- ities.3 This technique uses a chemical marker that is injected into either the oil or water stream. The time the marker takes to reach the detector is a measure of fluid velocity (previous page, bottom). The chemical marker contains a high concentra- tion of the element gadolinium, which has a large thermal neutron absorption cross section. The RST tool senses the large increase in the borehole absorption cross section caused by the passage of the gadolinium slug (above). A high concentration of gadolinium chloride [GdCl3] in water is used as a water-miscible marker. It has the high density and low viscosity necessary for the water-phase measurements. For the oil-phase measurements, a new, gadolinium- rich compound, with low density and viscosity is used. These markers are safe to handle, even in concentrated form, and pose no environmental threat when injected into borehole fluids. Flow-loop experiments at Schlumberger Cam- bridge Research, Cambridge, England have vali- dated the PVL measurements under a large variety of flow conditions. Both single-phase oil and water measurements show excellent agreement between PVL-measured and actual flow rates (above). Two- phase measurements, using oil and water or gas and water, demonstrate the ability to measure sep- arately each phase in a segregated flow (right). 130 132 134 136 138 140 142 144 490 ft/min 12 ft/min Time, sec Boreholesigmaindicator 300 ft/min 200 ft/min 100 ft/min 50 ft/min 0 5 10 15 20 25 60 80 100 120 Raw Data Filtered Data ssTypical marker slug time-of-flight distributions for a variety of fluid-flow velocities. 500 Actual water velocity, ft/min 0 400 300 200 100 0 100 200 300 400 500 PVLmeasurements,ft/min ssPVL water velocity measurements in the flow-loop. Water velocity measurements made using the PVL technique for horizontal stratified two-phase flow (oil and water), where the water holdup was kept at 50%, show good agreement with actual controlled flow rates. The error bars are dominated by the sampling frequency of the borehole absorption measurement. 200 100 0 200 100 0 200 100 0 200 100 0 200 100 0 Velocity,ft/min Oil Water 2300 BOPD 3000 BOPD 3800 BOPD Deviation, degree 85 87 89 91 93 750 BOPD 1500 BOPD ssTwo-phase velocity measurements in the Schlumberger Cambridge Research flow loop. Oil and water velocity measurements made using the PVL technique in a laboratory flow loop with two-phase flow where the water flow rate was maintained con- stant at 1500 BWPD. The loop was tilted from 85 to 92 degrees and the water and oil velocities measured for oil flow rates ranging from 750 to 3800 BOPD. The results show that small deviations from horizon- tal can cause large changes in the measured fluid velocities. 1. Lenn C, Kimminau S and Young P: “Logging of Water Mass Entry in Deviated Well Oil/Water Flows,” paper SPE 26449, presented at the 68th SPE Annual Techni- cal Conference and Exhibition, Houston, Texas, USA, October 3-6, 1993. 2. Albertin et al, reference 6, main text. 3. Roscoe BA and Lenn C: ”Oil and Water-velocity Log- ging in Horizontal Wells Using Chemical Markers,” paper SPE 37153, presented the 1996 SPE Interna- tional Conference on Horizontal Well Technology, Calgary, Alberta, Canada, November 18-20, 1996.
- 9. 52 Oilfield Review the casing below X050 m causing the tem- perature to change faster than the local geothermal gradient. Above X050 m, the WFL data revealed flow inside the casing, in good agreement with the production log- ging interpretation (right). The WFL interpretation helped pinpoint the three-phase production to Zones 2 and 3. Only gas and oil enter the well from Zone 1. The WFL data show that water, from below Zone 5, flowed behind the casing. With a clear understanding of the produc- tion problems in the well, the operator could choose between two remedial treat- ments—eliminating all water production by closing Zones 2 and 3, simultaneously cut- ting potential oil production by a third; or simply decreasing water cut by repairing the cement below X050 m. The next field example shows how a new PL holdup and velocity imaging tool helped determine the correct remedial action for a well on the North Slope, Alaska, USA operated by ARCO Alaska Inc. and BP Exploration (next page, left).10 The 49° deviated well, was flowing at 1141 BOPD [181 m3/d] with 82% water cut at surface and a GOR of 2583 ft3/bbl. Four zones were originally perforated, and tradi- tional PL interpretation based on density, velocity and temperature indicated mixed water and oil production in the lower three zones, and gas in the top two. For example, in the lowest perforated zone, the gra- diomanometer showed a reduction in fluid density, usually interpreted as first hydrocar- bon entry. Based on traditional PL measure- ments and interpretation, only this lowest zone would be produced, and all upper zones would have been plugged. A completely different picture emerged using the recently introduced FloView imag- ing tool (see, “Advantages of Holdup and Bubble Imaging in Production Logging,” page 54). The FloView water holdup curve remained at 100% in the lower zone. The density drop measured by the traditional gra- diomanometer probably occurred when the tool moved from a dense sump fluid lying below the lowest perforated zone into lighter water produced from the first set of perfora- tions. Next, the FloView holdup detected a small hydrocarbon entry in Zone 2, and a large entry in Zone 3, as seen in the FloView holdup map. Well Sketch 15 in. -15 Downhole Flow Rate 0 B/D 4000 WFL Water Rate 0 B/D 4000 1 X025 2 WFL GR red -25 ft/min 100 WFL Far blue -25 ft/min 100 WFL Near green -25 ft/min 100 Fluid Vel -25 ft/min 100 Theor.Dens 6.6 1.10 gm/cm3 Theor. Temp 235 240 °C Theor. Pres 1010 1090 psi Fluid density 0.6 1.10 gm/cm3 Temperature 235 240 °C Pressure 1010 1090 psi Matrix Cement Production Perforations Shale Water Oil Gas WFL Water Rates 3 X050 4 X075 5 Flow outside Outsidevelocities ssWater flow logs at different depths in a deviated well. Track 1 (left) shows a well sketch and perforations at each zone. Track 2 shows WFL velocity results. The next three tracks show PL density, temperature and pressure measurements. Results of flow model analysis are shown in Track 6 (right). The reconstruction of PL measurements (dashed red) based on the flow model analysis is shown along with the original (solid black) PL measure- ments in Track 5. Three detectors were used by the WFL to cover a wide range of flows. Water velocities inside the casing, derived from the near detector are shown as green cir- cular tadpoles, while the far detector readings are shown in blue and the gamma ray readings in red. The triangular-shaped tadpoles represent readings for flow outside the casing. In this display, the 45° angle of the tadpole tails show an upflow in the well. Downward flow would be indicated by tails pointing 45° downward.10.Vittachi A and North RJ: ”Application of a New Radial Borehole Fluid Imaging Tool in Production Logging Highly Deviated Wells,” paper SPE 36565, presented at the SPE Annual Technical Conference and Exhibition, Denver, Colorado, USA, October 6-9, 1996.
- 10. Winter 1996 53 In addition, the FloView bubble (or hydro- carbon) velocity map pinpointed the first significant hydrocarbon entry midway up Zone 3. The caliper readings, shown as a casing cross-section profile, supported the idea that the gradiomanometer interpreta- tion was adversely influenced by changes in casing diameter between Zones 1 and 3. A restriction in the casing at X900 ft caused an increase in both spinner and FloView veloc- ity measurements. Just above X900 ft, between Zones 3 and 4, there was a reduction in average FloView bubble velocity. The FloView images showed a narrow band of hydrocarbon in this section of the well—low water holdup and higher bubble velocity throughout the top section of the casing. This zone appeared to have water backflow shown by comparing an overlay of two passes of the FloView velocity, one going up the well and a second traveling downhole. A large sepa- ration between the up and down passes was seen in the region experiencing the water backflow. The upgoing FloView pass read higher hydrocarbon velocity than the down- going pass. This occurred because water was flowing backwards down the pipe, car- rying hydrocarbon bubbles down with it against the upward motion of the tool. This abnormal separation in FloView velocities is an easily recognized flag to spot reverse flow in the well. Farther up the well, the opposite occurred. Starting at Zone 4, the upgoing FloView pass had a lower hydrocarbon velocity than the downgoing pass. This occurs because hydrocarbon bubbles, carried by the upward flowing water, were moving along with the upward moving tool—a sign of sig- nificant hydrocarbon entry in Zone 4. The downhole flow rates and profiles com- puted from the imaging measurements were significantly different from those determined using traditional PL measurements alone. Flow rates calculated using data from this new technique were within 8% of actual production rates (above). Based on these results, the recommendation to the operator was to plug off all the zones except Zone 3, the only significant oil producer. The overlay techniques shown in this example can be used as a qualitative method of identifying zones of hydrocarbon entry and water backflow. FloView Hydrcarb. Velocity (down) Oil Water Gas Gradio Density 0.6 gm/cm3 1.1 Temperature 218 °F 223 0.5 v/v 1 FloView Holdup FloView Holdup Map Downhole Flow Profile 0 10,000 B/D Spinner Velocity 25 ft/min 375 0 ft/min 350 FloView Velocity (up) FloView Velocity Map 0.6 1.0 v/v 0 350 ft/min1:600 ft Perfs Casing GR 0 150 API X800 X1000 X900 1 2 3 4 ssIdentifying fluid entry. The holdup map in Track 2 and the hydrocarbon velocity map in Track 4, from an Alaskan well show the first hydrocarbon entry in Zone 3. The center of each map track represents the high-side of the casing. The difference between the up (dashed red) and down (solid red) passes of the FloView imaging tool in Track 3 indicates backflow (shaded grey area where curves cross over) at X900, and hydrocarbon production (unshaded crossover) in Zones 3 and 4. 4 Production, B/D 3 2 1 0 20001000 3000 4000 Conventional PL Results 4 Production, B/D Zone 3 2 1 0 2000 4000 PL Results with FloView Gas Oil Water Gas Oil Water 1000 3000 Zone ssComparing production logging tech- niques. Downhole production from each zone was measured using conventional PL techniques and compared with those from the new FloView imaging technique. The new technique showed that only Zone 3 had significant oil production.
- 11. 54 Oilfield Review The 111⁄16-in. FloView production logging tool makes four independent measurements of bore- hole fluids, distributed in different quadrants of the pipe cross section (right). The self-centralized device uses matchstick- sized, electrical probes to measure the resistivity of the wellbore fluid—high for hydrocarbons and low for water. The probes are located inside of each of the tool’s four centralizer blades to protect them from damage, and their azimuthal position within the pipe cross section is measured. The FloView imager may be run in up to 95⁄8-in. casing. Each probe is sensitive to the local resis- tivity of the fluid within the pipe and generates a binary output when their sharp leading edges impinge on droplets of oil or gas in a water-contin- uous phase, or conversely, water in an oil-continu- ous phase (next page, left). Assuming the fluids are distinct and not in an emulsion form, and that the bubble size is larger than the tip of the probe (less than 1 mm), both water holdup and bubble count measurements may be obtained from the binary output of the probe.1 Water holdup is computed from the fraction of the time that the probe is conducting, and bubble count comes from the average frequency of the out- put. In a water-continuous phase, an increasing bubble count means an increasing hydrocarbon velocity, and vice versa in an oil-continuous phase. In biphasic fluid flow, the oil or gas holdup may be obtained from a closure relationship with the water holdup—the closure relation simply states that the sum of the holdups of all the phases equals unity. The probes cannot discriminate oil from gas. Even in three-phase fluid flow, this device still yields an accurate water holdup measurement. Averaged local outputs for holdup and bubble count are determined for each of the four individ- ual probes. The outputs from each of these probes are combined to map local stratified holdup. In a typical two-phase environment, the FloView tool has many advantages over the gradiomano- meter (next page, right). Jetting of producing fluid in front of perforated zones or changes in pipe diameter because of scale or restrictions have a venturi pressure effect on gradiomanometer response. The gradiomanometer does not mea- sure density directly, but measures the gravitation pressure gradient with differential sensors over a known vertical height difference. For this reason, gradiomanometer measurements are more diffi- cult in highly deviated wells and are impossible in horizontal wells because the vertical separation between sensor measure points is reduced and the measurement loses resolution. Finally, if the flow velocity is sufficiently high, friction will affect the gradiomanometer response. Advantages of Holdup and Bubble Imaging in Production Logging ssFlow-imaging tool and holdup images. The FloView imaging tool has four probes, which map the local water holdup in the borehole (inset above). FloView images show increasing water holdup as deviation decreases and correlate well with flow loop photos. Probe Probe Probe FloView images ConnectorCeramic insulator 0 0.5 Water holdup 0.440.48 91º90º89º80º 0.580.71 Flow rate 1500 B/D Deviation from vertical 1 Conductive tip Probe holding bracket Casing Flow loop photos 1. During most field tests, bubble sizes vary between 1 and 5 mm, within the requirements of the probes. Only at high flow rates (in excess of 2 m/sec [6.5 ft/sec]) are smaller bubble sizes experienced that might affect the holdup and bubble-count measurements.
- 12. Winter 1996 55 Probe output Conducting Time Not conducting Probe Flow Oil Gas ssPrinciple of local probe measurement. Oil and gas do not conduct electric current, but water does. Water holdup is determined by the fraction of time the probe tip is conducting. Bubble count is determined by counting the nonconducting cycles. Jetting, venturi effects Gradio Second oil entry First oil entry Water entry FloView holdup FloView bubble count Stagnant water Mud Friction effects Third oil entry ssFloView tool and gradiomanometer comparison in two-phase flow. At the bottom of the well (middle), there is frequently some mud and dense stagnant water. The gradiomanometer (right) responds to density change, and will detect the density decrease above the stagnant fluid, which in many cases might be mistaken for oil entry. FloView probes do not respond to the water change since both water and stagnant water are conductive. Therefore, the holdup (left) remains at 100% and the bubble count stays at zero. The next zone is producing water, typically opposite perforations. The gradiomanometer detects another density change, and as before, this change may be misinterpreted as an oil entry, because the produced water is invariably less dense than the stagnant water. Once again, FloView probes do not respond to this water change since both waters are conductive. At the first oil entry in the next zone, the outputs of the FloView probes will indicate less than 100% water holdup, and the bubble count will start to increase. The gradiomanometer density will also record the change, if enough oil enters, and the oil density is suffi- ciently different from the produced water. As the tool passes across additional oil entries, FloView water holdup will continue to decrease and the bubble count will increase. The gradiomanometer will also register these oil entries with a decreasing density, if the oil entries change the mixture density significantly.
- 13. 56 Oilfield Review Horizontal Wells: The Flagship Project During 1994, British Petroleum Exploration Operating Co. Ltd. and Schlumberger Oil- field Services established a joint initiative— “The Flagship Project”—to develop new techniques for the diagnosis and treatment of high-angle and horizontal well produc- tion problems. The diagnosis part of this project involved development of new PL tools. First, a novel tool string incorporating sensors targeted at the stratified flow regimes encountered in horizontal and near-horizontal wells was developed—combining the CPLT tool, an extra gamma ray detector, the RST tool, FloView Plus tool, fluid marker injector and a total flow rate spinner tool (above).11 This equipment is now being used in the North Sea and the Middle East to make quantitative flow-rate measurements of oil and water in cemented and perforated liners, with a long- term goal of being able to measure three- phase flow in uncemented liners. The first application of this tool string was to resolve flow profiles and monitor move- ment of OWCs in the Sherwood sandstone reservoir, in the Wytch Farm field that strad- dles the coastline of southern England. Using extended-reach drilling technology, at least ten onshore wells were drilled with stepouts of up to 8000 m [26,248 ft] and having reservoir sections of up to 2700 m [8858 ft]. The wells have electrically submersible pumps (ESPs) and produce up to 20,000 BOPD [3178 m3/d]. To manage the field, BP employs production logging on selected wells to assess flow profiles with respect to reservoir zones and to monitor the move- ment of OWCs. This information is used to determine future well trajectories, optimize standoff from the OWC and target future well intervention needs, such as to shut off water and add secondary perforations. GR RST FloView tools Bubble velocity Water holdup RST Reservoir Saturation Tool Oil holdup Gas indicator FloView Plus tool WFL Water Flow Log Water velocity Water holdup Water flow-rate index CPLT CPLT Combinable Production Logging Tool Pressure and temperature Fluid marker injector Spinner Total flow rate Gamma ray detector PVL Phase Velocity Log Marker injection for oil and/or water velocity ssThe PL Flagship tool string. This composite string consists of the CPLT Combinable Production Logging Tool, an RST module with an extra gamma ray tool, used for water flow logging and PVL Phase Velocity Logging, a FloView Plus fluid imaging tool, a fluid marker injector tool used with the PVL, and a total flow rate spinner tool. The two imaging FloView tools are mounted with their probes aligned for enhanced coverage of the borehole cross section. Water holdup Above 0.94 0.88 - 0.93 0.82 - 0.87 0.76 - 0.81 0.71 - 0.75 0.65 - 0.70 0.59 - 0.64 0.53 - 0.58 0.47 - 0.52 0.41 - 0.46 0.35 - 0.40 0.29 - 0.34 0.24 - 0.28 0.18 - 0.23 0.12 - 0.17 0.06 - 0.11 Below 0.5 Average holdup = 0.261 ssHoldup image from Wytch Farm 1F-18SP well. Multiple positions of the imaging probes provide a detailed local holdup image. From this image, the local holdup profile is com- bined with the different phase velocities to determine multiphase fluid-flow rates. 11. Lenn C, Bamforth S and Jariwala H: ”Flow Diagnosis in an Extended Reach Well at the Wytch Farm Oil- field Using a New Tool string Combination Incorpo- rating Novel Production Technology,” paper SPE 36580, presented at the SPE Annual Technology Con- ference and Exhibition, Denver, Colorado, USA, October 6-9, 1996. 12. Roscoe B: ”Three-Phase Holdup Determination in Horizontal Wells Using a Pulsed Neutron Source,” paper SPE 37147, presented at the 1996 SPE Interna- tional Conference on Horizontal Well Technology, Calgary, Alberta, Canada, November 18-20, 1996.
- 14. Winter 1996 57 Three Wytch Farm wells were chosen to evaluate the new Flagship tool string—two with water cut and one a dry-oil producer. The first water-cut well 1F-18SP was drilled to a 4450 m [14,600 ft] total depth, with a horizontal displacement of nearly 3800 m [12,468 ft]. Once the main drainhole was drilled through the productive section, the well trajectory was dropped to penetrate the OWC. This permits future logging of the OWC as it moves. The reservoir was perfo- rated 33 m [106 ft] above the initial OWC, giving an initial estimated productivity index (PI) of 100 B/D/psi. Production started at 15,000 B/D [2384 m3/d] dry oil, declining after three years to a rate of 13,000 B/D [2066 m3/d] fluid with a 9 to 14% water cut at the time of logging. This well was selected to test the new tool string because it had the highest water cut in the field, penetrated the OWC and presented the best opportunity for coiled tubing intervention. Despite using a revolutionary tool string for this trial, the logging objectives were typ- ical of any PL job: To determine the source of water production, identify the oil and water profile in the well and assess each zone’s contribution, and determine any movement of the OWC in the reservoir. Analysis of the PL data revealed that the well was producing fluid along the entire length of its perforated section. Water pro- duction was occurring only in the lowest perforations—in the toe of the well—possi- bly due to coning in a zone of high vertical permeability, rather than a general move- ment of the OWC. The RST-Sigma saturation monitor logs showed that the OWC had moved up only 10.8 m [35 ft] from its original position. The independent WFL velocity and the PVL water-velocity measurements both showed good agreement with the PL results. In addi- tion, oil-velocity measurements were obtained from the PVL tool. Local probes on the FloView tool provided holdup distribution images of the fluids, confirming that the flow was stratified (previ- ous page, bottom). In addition, RST-C/O ratio and borehole salinity from the RST- Sigma logs were used for holdup analysis (see “Multiphase Holdup Measurements,” right).12 All three methods—FloView Images, C/O ratio, and borehole salinity— provided similar results, confirming trends or conclusions about holdup analysis. Flow profiles were computed from the velocity and holdup measurements for both oil and water phases. Multiphase holdup measurements are made with the basic RST C/O measurement, which is usually used to determine the volume of oil in the forma- tion. The carbon and oxygen signals are generated by fast neutron inelastic scattering, which leaves these elements in high-energy excited states that decay immediately by gamma ray emission. Most carbon-oxygen excitations take place within 15 to 23 cm [6 to 9 in.] of the tool. This means all C/O measurements are sensitive to the local ele- mental concentrations, and therefore to the relative amount of oil and water holdup in the borehole as well as the saturations in the formation (above). The RST-A tool has two detectors with one more and one less sensitive to the borehole environ- ment by virtue of their spacing from the source. Gamma ray spectra from both detectors lead to relative elemental carbon and oxygen yields, which are used to solve simultaneously for the vol- ume of formation oil and the borehole oil holdup.1 The RST C/O crossplot response and RST-A inelastic near-to-far count rate ratios are used together to determine multiphase fluid holdup. The inelastic spectra give carbon-oxygen ratios and detector count rates. The crossplot near detector C/O ratio response is determined primarily by the oil holdup in the borehole and the far detector C/O response by the oil volume in the formation. The near-to-far inelastic count rate ratio primarily depends on the overall borehole density, which is related to the borehole gas holdup.2 Two-phase (oil and water) holdup is determined using the crossplot C/O response, while both crossplot and count rate ratios are used simultaneously for holdup determi- nation in three-phase (oil, water and gas) solutions. Multiphase Holdup Measurements 1. Roscoe B: ”Three-Phase Holdup Determination in Horizontal Wells Using a Pulsed Neutron Source,” paper SPE 37147, presented at the 1996 SPE Interna- tional Conference on Horizontal Well Technology, Calgary, Alberta, Canada, November 18-20, 1996. 2. An approach to measure borehole gas holdup with a fullbore backscatter gamma ray density tool can be found in: Kessler C and Frisch G: “New Fullbore Pro- duction Logging Sensor Improves the Evaluation of Production in Deviated and Horizontal Wells,” paper SPE 29815, presented at the 1995 Middle East Oil Technical Conference, Manama, Bahrain, March 11-14, 1995. YG = 0.00 YG = 0.33 YG = 0.67 YG = 1.00 Gas Holdup Response Casing Counts InelasticN/FratioFarC/Oratio Energy Porosity Near C/O ratio C/O Model Response Inelastic Spectrum Gas RST Tool Water YG YW YO YG Borehole oil Borehole water Formationoil Formation water Carbon Oxygen Near and Far count rate Near and Far C/O ratio ssMultiphase holdup from RST tool. Inelastic spectra (left) lead to carbon-oxygen ratios and near-and-far detector count rates. The crossplot of near and far C/O ratio responses are determined primarily by oil holdup YO in the borehole (lower right plot) and oil volume in the formation. The near-to-far inelastic count rate ratio (upper right plot) primarily depends on the overall borehole density which is related to the borehole gas holdup, YG.
- 15. 58 Oilfield Review The data acquisition capability of the tool string allows most critical parameters to be determined by alternative independent methods—for example, C/O and imaging holdup data, or WFL and PVL velocity data supported by spinner measurements— instilling greater confidence in the results. The new tool string clearly identified all the water entry points in the well, confirmed that the downhole flow was stratified, and proved that water and oil flow rates could be accurately determined using the new phase velocity and C/O-based holdup mea- surements. The upper perforations were pro- ducing oil. Oil flow rates derived from the PVL velocity and C/O holdup, within 500 B/D [80 m3/d], were 12,500 B/D [1986 m3/d]. The water-flow rates derived from the PVL and WFL measurements, within 500 B/D, were 3500 B/D [556 m3/d]. In the second water-cut well to be logged with the PL Flagship tool string, water entry was found to be not from the toe as before, but from a nonsealing intersecting fault. The logs showed that water was being drawn up through the fault from the OWC. In the third well—a dry-oil producer—the PVL oil-velocity measurements were tested against a fullbore spinner flowmeter in the horizontal drainhole completed with sand screens. The PVL data matched the spinner velocity, which functioned effectively in monophasic production. Tying It All Together—Interpretation Traditional PL interpretation for vertical wells primarily uses density from the gra- diomanometer to compute oil and water holdup, and the averaged measured flowmeter velocity from the spinner to com- pute fluid-flow rates using the slip velocity computed from a fluid model.13 Pressure, temperature and other data are largely ignored by conventional PL analysis. However, such a limited approach is inad- equate for most wells. By using all available production logging data, more complete answers may be delivered with greater confi- dence. The BorFlo production logging ana- lyzer is being introduced to do this (above right). This single interpretation package uses physical models based on fluid dynamics in deviated and horizontal boreholes, relating the physics of fluid flow to the parameters measured by the PL tools (see “Interpreting Multiphase Flow Measurements in Horizon- tal Wells,” next page). With this interactive PL interpretation tool, measurements may be stacked, tool responses calibrated and flow- rate solutions determined. Multiple measurement of production parameters—such as fluid velocities from spinners, WFL and PVL logging runs, as well as holdup measurements from imaging tools and RST logs—enable delivery of optimized solutions to the fluid-flow dynamics. Knowl- edge of sensor responses allows the opti- mization to be based on the confidence lev- els of each logging measurement. This forward-modeling program tests the results of different flow conditions, based on many iterations, to determine the most likely downhole fluid-flow regime that is consis- tent with all the borehole geometries, well- bore environment, and observed production logging and surface measurements.14 Fluid Velocity Stacking Calibrations Blocking Flow Rate Solution Final Results Initialization Tool Incoherence Tool Incoherence S o l v e r Flow Model Tool Model 7800 7600 7700 Spin - rpm Cable Speed Bot. Top Slope Intercept 7750 7700 .21 .02 7800 7750 .22 .03 7800 7600 7700 Flow Velocity Temp Inputs Data Editing Depth Matching Log Inputs Well and Fluid Characteristics 7600 7700 7800 Calibrations Reconstruction Depth Matching Report and Well Sketch Gas Oil Water Lower perfs Upper perfs ssBorFlo overview. The PL interpretation program allows the engineer to do log stacking, calibrations and define well and fluid characteristics interactively. The interpretation matches the PL measurements with those determined by a fluid-flow model based on dif- ferent flow conditions occurring at each interval. 13. Slip velocity is the difference between the two-phase average velocities. For discussion of traditional pro- duction log interpretation: Hill AD, reference 2. 14. For example, the Duckler analytical model is used to determine parameters of the gas/liquid flow regime, and the volumetric model developed by Choquette and Piers separates the oil/water regime. For more on the development and use of the constrained solver PL interpretation models such as PLGLOB: Torre J, Roy MM, Suryanarayana G and Crossoaurd P: ”Go with the Flow,” Middle East Well Evaluation Review 13 (1992): 26-37.
- 16. A new fluid dynamics-based interpretation model called the Stratflo model has been developed to compute oil-water flow rates from logging mea- surements in high-angle and horizontal wells.1 The model depends on basic flow equations, which, in turn, depend on dynamic parameters such as fluid velocities and holdup, and static parameters such as well diameter, borehole deviation, and fluid densities and viscosities. Frictional terms at the casing wall are based on monophasic results (right). At the phase interface a simple flat inter- face frictional model is assumed. A correlation for the frictional factor between the two phases has been developed from flow-loop measurements. The model is based on the principle that the pressure variation ∆P along the axis of the well in each phase is equal. In steady state, the pressure variation in each phase has a hydrostatic compo- nent, which depends on density and the borehole deviation (the difference in height of the vertical positions), and a frictional component, which can be divided into two parts: the shear stress on the wall for oil Tow and water Tww, and the shear stress on the fluid interface Ti. The steady-state model simply sets the pres- sure in the oil ∆Po equal to the pressure drop in the water ∆Pw, by defining a function F = ∆Po – ∆Pw = 0. In this model, the function F depends on dynamic parameters such as flow rates and holdup, as well as static parameters, such as flowing diam- eter D, deviation angle, θ, fluid densities ρo and ρw, and viscosities, µo and µw. For example, in terms of the dynamic parameters Vw water veloc- ity and Vo oil velocity and Yw water holdup, the function can be expressed as F(Vw, Vo, Yw) = 0. This function is a nonlinear algebraic equation and a function of three independent variables. To use the model, readily-measured parameters such as local holdup and velocity measurements may be used for two of the necessary input dynamic parameters. With the mass conservation equations, which relate flow rates, velocities and water holdup, the model can be solved for other combinations of inputs, depending on available data. Outputs are computed from the flow model and mass-conservation equations using a root- finding technique. The flow model gives good results up to about 6000 B/D [953 m3/d] for each phase—the limit where the simple flat interface starts to degener- ate as the mixing layer grows. The model accu- rately accounts for the variation in holdup at differ- ent borehole angles and flow rates (right). Interpreting Multiphase Flow Measurements in Horizontal Wells θ Tow Tww Vo Vw Ti ∆P in water = ∆P in oil Pressure Drop Wall friction (Tw) Interfacial friction (Ti) Gravity (ρ,devi) ∆P ∆P ∆hρo ρw ssStratified flow model. The flow model for two- phase flow equates the pressure difference due to the hydrostatic head (which depends on borehole devia- tion angle θ), ∆h, and the wall, Tw, and interfacial, Ti, friction components for each of the two fluids. 1.0 Waterholdup Deviation, deg 87 0.8 0.6 0.4 0.2 0 88 89 90 91 92 Flow model Flow model Flow=800 B/D Flow=7000 B/D ssMeasured and predicted holdup variation. Holdup was measured at different deviations and flow rates in the Schlumberger Cambridge Research flow loop and compared with results predicted by the stratified flow model StratFlo. The results show the rapid vari- ation in holdup with borehole deviation at low flow rates (red curve), as well as the reduced holdup sen- sitivity at a high flow rate (yellow curve). The results are shown for a water cut of 50%. 1. Theron BE and Unwin T: ”Stratified Flow Model and Interpretation in Horizontal Wells,” paper SPE 36560, presented at the 1996 SPE Annual Technical Confer- ence and Exhibition, Denver, Colorado, USA, October 6-9 1996. Winter 1996 59
- 17. The Outlook The ongoing development effort in under- standing three-phase flow is delivering results—including detailed gas holdup and velocity measurements—that are reshaping PL services. However, there is still an impor- tant flow domain not adequately covered by today’s technology—environments where there is low water holdup and significant drainhole deviation. Work is under way at SCR to understand the complex fluid dynamics, flow instabilities and phase mix- ing in all regions. This experimentation together with hydrodynamic modeling will lead to better future understanding and management of flow in the borehole (right). Improved instrumentation and tool tech- nology are also promising faster, more effi- cient and lower-cost services—some using slickline. Other applications will see per- manent downhole sensors used for produc- tion monitoring.15 These devices are rapidly becoming more sophisticated, mea- suring properties other than temperature and pressure—such as hydrocarbons and phase mixing. The outlook for production logging is cer- tainly brighter now that it has been at any time during the last decade. Operators can look forward not only to a better under- standing of their reservoirs, but also to use of this knowledge for more effectively man- aging their assets. —RH ssComputed 3D droplet-averaged simulations of two-phase flow showing the effects of shear instabilities. Mapped projections of fluid holdup are shown for horizontal (top) and vertical (middle) lateral cross section of the borehole and at four positions cutting vertically across a borehole (bottom). Oil (red) rises due to buoyancy forming an emulsified layer of oil on the high side of the pipe. The lighter, upper layer flows at a higher velocity than does the water (blue). This shear flow becomes unstable and an instability occurs that causes the emulsion of oil to disperse in the water: large eddies mix the two phases up. Then the process repeats farther up the pipe. Such fluid simulations help scientists test fluid-flow models under many conditions and design better methods to measure their properties. Technology Forum In conjunction with the Schlumberger ClientLink initiative, Oilfield Review announces its first online technology discussion. The Production Logging Web-Forum is an interactive site for comments on this article, inquiries about technology, or open discussions concerning production logging tools, interpretation and applications. To access this forum, point your browser to the following URL: www.connect.slb.com/forums/pl/ If you have problems making the connection, please E-mail: skipton@slb.com 15. Baker A, Gaskell J, Jeffery J, Thomas A, Veneruso T, and Unneland T: ”Permanent Monitoring—Looking at Lifetime Reservoir Dynamics,” Oilfield Review 7, no. 4 (Winter 1995): 32-46. 60 Oilfield Review