Flagler college replaces microsoft SCOM with opmanager to manage 3300 interfaces
•
1 like•1,634 views

Flagler college replaces microsoft SCOM with opmanager to manage 3300 interfaces

Recommended
More Related Content
Viewers also liked
Viewers also liked (17)
Similar to Flagler college replaces microsoft SCOM with opmanager to manage 3300 interfaces
Similar to Flagler college replaces microsoft SCOM with opmanager to manage 3300 interfaces (20)
More from ManageEngine, Zoho Corporation
More from ManageEngine, Zoho Corporation (20)
Recently uploaded
Recently uploaded (20)
Flagler college replaces microsoft SCOM with opmanager to manage 3300 interfaces
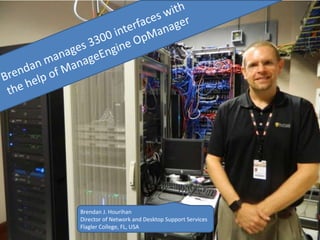
- 1. Brendan J. Hourihan Director of Network and Desktop Support Services Flagler College, FL, USA
- 2. About Flagler College • A private college located in St. Augustine, Florida with about 2,500 students and 450 faculties. • Offers professional programs in selected studies emphasizing liberal arts, education and business. • The college has been named as one of the southeast region's best comprehensive liberal arts colleges, • And also included in the list of "America's Best Colleges"
- 3. Monitoring Requirements To monitor system resources such as CPU, Disk, and Memory utilization on virtual servers and send alerts based on configured thresholds To know exactly how the network bandwidth is being utilized. To ensure high availability across the network so that all the devices, services are up and running 24*7 continuously. To proactive monitor all the files/ folders placed on the college-owned computer or network. To periodically check the intranet or internet websites to ensure they are reachable and serving the pages within the expected time
- 4. Challenges faced by Brendan & his team before using OpManager
- 5. Before switching to OpManager, they used 3 instances of Microsoft SCOM to manage 3300 interfaces and to share the network load 3300 Interfaces Microsoft SCOM Microsoft SCOM Microsoft SCOM
- 6. As an effect of using multiple instances to monitor the network infrastructure, the IT team spent more time on… • Installation and Deployment • Ongoing maintenance • Navigating to the root cause of network performance issues • Extracting performance reports This time consumption made situation worse during critical IT performance setbacks.
- 7. So Brendan and his team were desperately looking for an unified network management console that will make their life easy. After evaluating few network monitoring tools, they finally choose ManageEngine OpManager
- 8. How did ManageEngine OpManager fulfill their requirement • Single, centralized, and easy-to-use network management • Can be installed within minutes and starts monitoring the network instantly • Customizable performance dashboards to view the overall IT performance • Real time graphs for performance Monitors (CPU, Memory, Disk & etc.)/ Traffic and Bandwidth Utilization • Color-coded Alarms & Intelligent Event-Alarm Correlation • Email / SMS based notifications • Includes powerful networking tools like MIB Browser, Ping, Traceroute etc. • Over 100+ Network performance Reports
- 9. Now Brendan uses just one OpManager console to manage his 3300 interfaces 3300 Interfaces ManageEngine OpManager
- 10. Server Monitoring • OpManager monitors servers, services and applications across multiple vendor OS • Over 300 performance metrics including CPU utilization, partition-wise disk space and memory utilization • Monitors VMware, Hyper-V and Xen • Resolves server performance problems instantly.
- 11. Flow–based network traffic analysis • OpManager monitors how exactly network bandwidth is being utilized • Prioritizes and classify applications that hog the network bandwidth • Provides real-time insight into the network bandwidth with granularity reports.
- 12. Network Availability Monitoring • OpManager offers comprehensive network uptime monitoring to ensure that all your network devices, services are up and running 24*7 continuously. • Provides real–time availability statistics, as well as detailed monitoring and analysis of network, servers and any other business critical applications.
- 13. Network Files and Folders Monitoring OpManager provides file and folder monitoring functionality that lets IT team monitor the presence of network files/folders, changes made to the files/folders, their sizes and age.
- 14. Website Monitoring OpManager offers 24*7 monitoring of websites for availability and performance that helps to identify website problems, keep track of the web server farms etc. before they escalate into substantial downtime and lost revenue.
- 15. Hear what Brendan had to say about OpManager