Designing Real-Time Data Dashboards for Busy Users
•
16 gefällt mir•2,640 views

A case study of the work that went into designing a real-time data dashboard for chartbeat.com, presented at the O'Reilly Web 2.0 conference in New York, NY 2010.
![Today’s talk ,[object Object],[object Object],[object Object],[object Object],[object Object]](data:image/gif;base64,R0lGODlhAQABAIAAAAAAAP///yH5BAEAAAAALAAAAAABAAEAAAIBRAA7)
Empfohlen
Weitere ähnliche Inhalte
Andere mochten auch
Andere mochten auch (12)
Ähnlich wie Designing Real-Time Data Dashboards for Busy Users
Ähnlich wie Designing Real-Time Data Dashboards for Busy Users (20)
Kürzlich hochgeladen
Kürzlich hochgeladen (20)
Designing Real-Time Data Dashboards for Busy Users
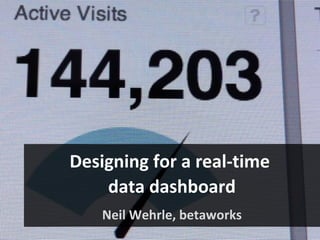
- 1. Designing for a real-time data dashboard Neil Wehrle, betaworks
- 3. A brief history of chartbeat
- 12. Short demo
- 13. Who’s got time for real-time?
- 14. Chartbeat users are busy people
- 15. Sketches
- 16. All on the same page
- 17. Pivot points
- 21. Primary focus is still real-time
- 23. Finding it right away How many people are on my site? What are they doing? Where did they come from?
- 27. * Bling *
- 28. Next steps
Hinweis der Redaktion
- I’m going to cover five things: • A brief walkthrough of how we got to the present state of Chartbeat • A case study highlighting three key elements related to the design of chartbeat • A wrapup that points to future directions for chartbeat.
- One of the recurrent themes of this talk is that you can’t have a present with a past, so I’m going to start off by telling you a little bit about where chartbeat came from.
- Chartbeat started at betaworks, a New York City-based company that invests in and builds companies with a strong focus on social media. Betaworks has a particular way of building products, using a flexible series of gates to shepherd good ideas to market.
- Betaworks has started and incubated products like bit.ly and socialflow, which I have worked on, as well as tweetdeck and twitterfeed. All of these have a view on, or a complete focus on, real-time data.
- An early internal project was something called Firefly. • Firefly was a real-time chat environment that site owners could include on their site. • Users could chat in real-time and “see” other users on the page. Here you can see how cursors would flit about the page, and users could just click to spawn a chat bubble and start chatting. Firefly didn’t work out well for a number of reasons, but mostly users were completely weirded out by the experience of encountering random users on a website. Another big problem was that sites had to have enough traffic in order to achieve a critical mass of simultaneous users.
- And, the quality of the conversation left a lot to be desired.
- Fundamentally, I think Firefly was a classic case of a technology looking for a problem to solve. What it did do is scratch some sort of itch regarding real-time data. We learned that site publishers were really, really interested in a couple of features. • One was a user count that showed both the number of total people on the page and the number engaged with Firefly. Firefly also showed what users were doing, such as typing and where their cursor was on the page. • Firefly also had the ability to go back in time, by means of a replay bar at the bottom of the page. Because we were constantly pinging the site, we could we tell you how many people were on the site, what they were doing, where they came from, and what their experience as far as page performance.
- The next step was to re-orient these abilities into something clearly less consumer-facing, but no less interesting – a real-time dashboard of site activities. Initially, we thought this would be of use to bloggers and other content publishers paying close attention to Twitter. These were the only people we knew of who were interested in the viral loop and monitoring and responding to events as they happened. We priced it low, thinking people could afford $9.95 a month, and made it easy to install – just a line of code to call some javascript.
- Once we had a version up, we immediately began gathering feedback from users. We did using both methodical and more anecdotal approaches – we ran some usability tests with actual users, conducted heuristic evaluations, and listened to our customers talk about the product on Twitter, the support forums and email communications. The initial response was very positive, but patterns emerged that shaped our thinking about the next version. Betaworks felt like it was really onto something now, so it brought in a new and larger team, and settled into a rapid, iterative design/build/test cycles.
- The rest of this talk will go into depth on several key learnings and experiences we’ve had over the past year in getting the current version of chartbeat up and running.
- For those in the audience who’ve never seen Chartbeat, or would like a refresher, I’ll give you a quick walkthrough of the product. This should also be helpful in illustrating some of the points I’m covering later in the talk.
- One of our first realizations, and one that has played the most significant role in shaping how chartbeat has evolved, is that chartbeat is a tool for people on the front lines. These are people who don’t have backgrounds in technology, analytics, or stats. These are not data analysts. These people are creating content, deciding where to place it, and responding to changes in the online environment.
- We faced a typical problem in trying to express the data we gathered from user research and anecdotal encounters with users. Since we had a small team – just one and half developers, one general manager, and myself dedicated at about 75% to the project, we needed to prioritize. We used personas and scenarios to help isolate user goals and to focus our development efforts.
- We spent a lot of time working together to nail down the first principles of the product and sketching out ideas. Typically, we’ll move from whiteboard, to my sketchbook, to a tool like omnigraffle (for a sketch, not specs), while building out technical prototypes. From these, we did a lot of internal “hallway usability” tests (one of the great things about betaworks is there are always people coming through the office, or people working on completely different things).
- We talked to a lot of people who had access to “leading web analytic” tools, and universally they could not or did not want to use them. They can’t find information, and they don’t understand what they are looking at. Nobody but the most die-hard (some would say masochistic) data analyst wants to spend time drilling endlessly through navigational trees to arrive at a single pie chart of data. We worked extremely hard to move from a multi-page dashboard to a one that effectively communicates almost everything in a single view. We only surface the top active pages.
- To maintain a single-page view of their data, we’ve allowed users to focus on particluar aspects of the data, but instead of taking them off the page, we effectively “pivot” around their selection and popluate the panels with the subset of relevant data.
- Once users are a little acclimated to chartbeat, they begin to ask “what does it mean?”. They want to understand if the values and trends they saw were something to be concerned about. Of course, historical data provides necessary context for the real-time data. The challenge for us, then was how to build a product that provided that without becoming overwhelming or ending up just like so many of the other analytics packages out there.
- Showing users historical data raises issues that bump directly into our first principles of simplicity. Chartbeat is pinging and storing a lot of data, and that’s expensive. Typically, displaying historical data has required a lot of fiddling controls to select time periods, etc. We wanted to take a different approach. This illustration is of what’s called the “Coastline paradox”, which describes the dificulty of measuring something like a coastline – what degree of fidelity is adequate to satisfy? http://en.wikipedia.org/wiki/Coastline_paradox
- What we’ve arrived at is a series of efforts to push historical data to the periphery, or to layer it in a manner that keeps it unobtrusive but meaningful. A very simple example is the red line that appears at the top of the page. Just by showing the same time period behind it as a gray line immediately shows users if any unusual activity is happening. This also functions as an entrée into deeper historical insights by serving as a global replay control, so instead of a traditional view of historical data, we’ve actually created a “Tivo for your website” that animates the entire dashboard in a replay of events in the past.
- Incorporating historical benchmarks into most real-time measurement ensures that the focus is still on real-time and that users never see historical data divorced from it.
- One of our First Principles states that our users should be able to derive a clear action from the data presented.
- Users typically arriving at chartbeat are asking the same thing: How many people are on my site? What are they doing here? And Where did they come from? Knowing what users want to do on the site let us arrange a default view for them, positioning data where they want to encounter it. Here we see the positions, generally speaking, of where users will locate this information. Not only are they at the top of the page but the layout intentionally conforms to the typical F-shape page-scanning behavior observed online.
- The data element that most people are interested in is how many people are on their site right now? Traditional analytics use what is arguably a more immediately intuitive method of counting hits on a site. Chartbeat uses a sampling method, which counts how many visitors are on a site each time, as well as what they are doing across that time. It is somewhat analogous to nightclub, where traditional analytics is like the bouncer, just counting who comes in. On the other hand, imagine a photographer on the inside, taking snapshots of everyone. Not only can you count how many people are there, but you can see what they are doing, how long they stayed there, and even if they made to other rooms in the club.
- Of course a key part of developing chartbeat was selecting what chart types to include. We faced a number of issues, some of which were covered earlier in this talk, but essentially boiled down to a few problems: - When did we want to show users trend data (which can obscure explicit numbers, but gives user a sense of relative movement) and when did we want to show counts (which by themselves are hard to make sense of without context)?
- An example of where we chose to develop our own chart type is in the Top Pages panel. We spent a lot of time resolving how to display relative page-level traffic. In our first version, we used a standard tree map. Users were very intrigued by it, and claimed to love it, but when I interviewed a number of them, none could correctly display what they were looking at. The tree map would create distorted pictures (arguably, useful) of sites that had extremely high or low volume, or were sites with a lot of traffic through a single page. We came up with something that we feel effectively communicates the vast range of traffic, while making more sites visible and readable. Remember, we are focused on end-users, not data analysts, people who value simplicity and usability over precision.
- Users LOVE the kinetic nature of chartbeat. We added several interesting elements that evolved out of earlier explorations. • First, on startup, the dials have a little extra movement that conveys some liveliness. • More typically, the pie chart wedges fly in on page load. • We also flash a background color for each of the pages to indicate upward or downward trending. • And finally, to the right, we have a streaming column of raw hits that we refer to internally as “the Matrix”. From an informational standpoint, these don’t add a whole lot, but users told us they found it mezmerising, and that it gave them a better sense of what visitors were interested in.
- In a kind of backhanded compliment, users have tweeted many times how addictive chartbeat is. Next steps are to look for ways to make data more actionable to give front line users what they need to take action on trending items.