Information Graphics Timeline Of Development
•Download as PPTX, PDF•
1 like•1,158 views

The history of how information graphics came to be what it is today.

Recommended
More Related Content
Similar to Information Graphics Timeline Of Development
Similar to Information Graphics Timeline Of Development (20)
More from NPR Audience Insight & Research
More from NPR Audience Insight & Research (20)
Recently uploaded
Recently uploaded (20)
Information Graphics Timeline Of Development
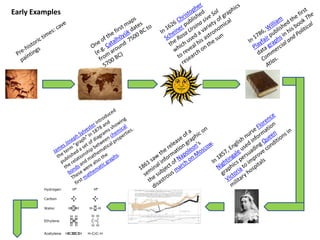
- 1. In 1626 Christopher Scheiner published the Rosa Ursinasive Sol which used a variety of graphics to reveal his astronomical research on the sun Early Examples In 1786, William Playfair published the first data graphs in his book The Commercial and Political Atlas. One of the first maps (e.g. Çatalhöyük dates from around 7500 BC to 5700 BC) Pre-historic times: cave paintings James Joseph Sylvester introduced the term "graph" in 1878 and published a set of diagrams showing the relationship between chemical bonds and mathematical properties. These were also the first mathematic graphs. In 1857, English nurse Florence Nightingale used information graphics persuading Queen Victoria to improve conditions in military hospitals 1861 saw the release of a seminal information graphic on the subject of Napoleon's disastrous march on Moscow.
- 2. In 1936 Otto Neurath introduced a system of pictographs intended to function as an international visual or picture language. In 1958 Stephen Toulmin proposed a graphical argument model that became influential in argumentation theory and its applications. In 1942 IsidoreIsou published the Lettrist manifesto. Claim Ground (Evidence, Data) Warrant Backing Rebuttal Qualifier Also in 1972 the Pioneer Plaque was launched into space with the Pioneer 10 probe. Inscribed into the plaque was an information graphic intended as a kind of interstellarmessage in a bottle, designed by Carl Sagan and Frank Drake. The message is unique in that it is intended to be understood by extraterrestrial beings. 2005–Present day. The information graphic trend starts to become popular amongst the larger social media aggregation sites Digg Reddit. The data contained in modern info graphics tends to be research centric and attributed to multiple sources. ? 20th Century Examples