Table 2: Comparison of rates of growth for New Jersey suburban municipalities
•
0 likes•1,092 views

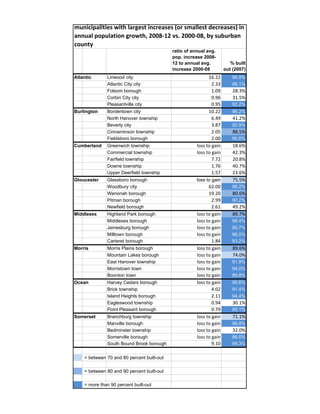
A comparison of growth rates of New Jersey suburban municipalities 2000 to 2008 vs. 2008 to 2012, showing a reversal of population trends among closer-in, largely built-out suburbs.

Recommended
More Related Content
What's hot
What's hot (12)
Viewers also liked
More from New Jersey Future
More from New Jersey Future (20)
Recently uploaded
Recently uploaded (20)
Table 2: Comparison of rates of growth for New Jersey suburban municipalities
- 1. municipalities with largest increases (or smallest decreases) in annual population growth, 2008‐12 vs. 2000‐08, by suburban county ratio of annual avg. pop. increase 200812 to annual avg. increase 2000-08 Atlantic Burlington Linwood city Atlantic City city Folsom borough Corbin City city Pleasantville city Bordentown city North Hanover township Beverly city Cinnaminson township Fieldsboro borough Cumberland Greenwich township Commercial township Fairfield township Downe township Upper Deerfield township Gloucester Glassboro borough Woodbury city Wenonah borough Pitman borough Newfield borough Middlesex Morris Ocean Somerset Highland Park borough Middlesex borough Jamesburg borough Milltown borough Carteret borough Morris Plains borough Mountain Lakes borough East Hanover township Morristown town Boonton town Harvey Cedars borough Brick township Island Heights borough Eagleswood township Point Pleasant borough Branchburg township Manville borough Bedminster township Somerville borough South Bound Brook borough = between 70 and 80 percent built-out = between 80 and 90 percent built-out = more than 90 percent built-out 16.22 2.33 1.09 0.96 0.95 10.22 6.49 3.87 2.05 2.00 loss to gain loss to gain 7.72 1.76 1.57 loss to gain 62.00 19.20 2.99 2.61 loss to gain loss to gain loss to gain loss to gain 1.84 loss to gain loss to gain loss to gain loss to gain loss to gain loss to gain 4.02 2.11 0.94 0.79 loss to gain loss to gain loss to gain loss to gain 9.10 % built out (2007) 96.9% 98.1% 28.3% 31.5% 92.2% 96.2% 41.2% 92.9% 88.5% 96.6% 18.6% 42.3% 20.8% 40.7% 23.6% 75.5% 98.2% 80.6% 90.2% 49.2% 89.7% 96.4% 95.7% 96.5% 93.2% 89.6% 74.0% 91.9% 94.0% 89.8% 99.6% 91.4% 94.4% 30.1% 99.1% 71.1% 98.8% 32.0% 96.0% 98.3%