Fundamentalequityanalysis Kospiindexmemberss Korea 110208093344 Phpapp02
1. 08.02.2011
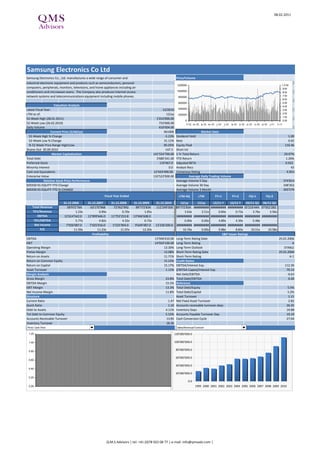
Samsung Electronics Co Ltd
Samsung Electronics Co., Ltd. manufactures a wide range of consumer and Price/Volume
industrial electronic equipment and products such as semiconductors, personal
1200000 1.0 M
computers, peripherals, monitors, televisions, and home appliances including air .9 M
conditioners and microwave ovens. The Company also produces Internet access 1000000 .8 M
network systems and telecommunications equipment including mobile phones. 800000 .7 M
.6 M
600000 .5 M
Valuation Analysis .4 M
Latest Fiscal Year: 12/2010 400000 .3 M
LTM as of: 12/yy 200000 .2 M
.1 M
52-Week High (28.01.2011) 1'014'000.00
0 .0 M
52-Week Low (26.02.2010) 733'000.00 f-10 m-10 a-10 m-10 j-10 j-10 a-10 s-10 o-10 n-10 d-10 j-11 f-11
Daily Volume 610'004.00
Current Price (2/dd/yy) 961000 Market Data
52-Week High % Change -5.23% Dividend Yield 1.00
52-Week Low % Change 31.11% Beta 0.92
% 52 Week Price Range High/Low 85.05% Equity Float 110.46
Shares Out 30.09.2010 147.3 Short Int -
Market Capitalization 141'554'700.00 1 Yr Total Return 29.97%
Total Debt 3'680'341.00 YTD Return 1.26%
Preferred Stock 119'467.0 Adjusted BETA 0.922
Minority Interest 0.0 Analyst Recs 43
Cash and Equivalents 12'443'490.00 Consensus Rating 4.953
Enterprise Value 133'522'000.00 Average Daily Trading Volume
Relative Stock Price Performance Average Volume 5 Day 374'814
005930 KS EQUITY YTD Change - Average Volume 30 Day 348'262
005930 KS EQUITY YTD % CHANGE - Average Volume 3 Month 393'579
Fiscal Year Ended LTM-4Q LTM FY+1 FY+2 FQ+1 FQ+2
31.12.2006 31.12.2007 31.12.2008 31.12.2009 31.12.2010 12/yy 12/yy 12/11 Y 12/12 Y 03/11 Q1 06/11 Q2
Total Revenue 58'972'764 63'175'968 72'952'992 89'772'834 112'249'500 89'772'834 ######### ######### ######### 35'216'444 37'052'282
TEV/Revenue 1.23x 0.99x 0.70x 1.05x - 3.63x 2.51x 0.84x 0.73x 3.76x 3.56x
EBITDA 12'614'542.0 12'999'646.0 11'753'253.8 13'946'608.0 - ######### ######### ######### ######### ######### #########
TEV/EBITDA 5.77x 4.82x 4.32x 6.73x - 0.00x 0.00x 4.89x 4.39x 5.48x -
Net Income 7'926'087.0 7'425'016.0 5'525'904.0 9'649'487.0 13'236'500.0 ######### ######### ######### ######### ######### #########
P/E 11.59x 11.23x 11.97x 12.20x - 16.76x 0.00x 9.88x 8.83x 10.51x 10.58x
Profitability S&P Issuer Ratings
EBITDA 13'946'610.00 Long-Term Rating Date 25.01.2006
EBIT 14'924'100.00 Long-Term Rating A
Operating Margin 13.30% Long-Term Outlook STABLE
Pretax Margin 12.08% Short-Term Rating Date 25.01.2006
Return on Assets 11.71% Short-Term Rating A-1
Return on Common Equity 15.23% Credit Ratios
Return on Capital 15.17% EBITDA/Interest Exp. 112.30
Asset Turnover 1.11% (EBITDA-Capex)/Interest Exp. 70.13
Margin Analysis Net Debt/EBITDA -0.63
Gross Margin 23.8% Total Debt/EBITDA 0.26
EBITDA Margin 15.5% Reference
EBIT Margin 13.3% Total Debt/Equity 5.5%
Net Income Margin 11.8% Total Debt/Capital 5.2%
Structure Asset Turnover 1.11
Current Ratio 1.47 Net Fixed Asset Turnover 2.82
Quick Ratio 1.10 Accounts receivable turnover-days 26.35
Debt to Assets 4.11% Inventory Days 19.88
Tot Debt to Common Equity 5.52% Accounts Payable Turnover Day 19.19
Accounts Receivable Turnover 13.85 Cash Conversion Cycle 27.04
Inventory Turnover 18.36
Price/ Cash Flow Sales/Revenue/Turnover
1.20 120'000'000.0
1.00 100'000'000.0
0.80
80'000'000.0
60'000'000.0
0.60
40'000'000.0
0.40
20'000'000.0
0.20
0.0
0.00 1999 2000 2001 2002 2003 2004 2005 2006 2007 2008 2009 2010
Q.M.S Advisors | tel: +41 (0)78 922 08 77 | e-mail: info@qmsadv.com |
2. 08.02.2011
Samsung Electronics Co Ltd
Holdings By: All
Holder Name Portfolio Name Source Amt Held % Out Latest Chg File Dt Inst Type
SAMSUNG ELECTRONICS n/a EXCH 17'348'865 11.78 (107'395) 19.01.2011 Corporation
SAMSUNG LIFE INSURAN n/a EXCH 11'034'460 7.49 - 01.07.2010 Insurance Company
CITIBANK NA n/a Co File 8'921'328 6.06 - 31.12.2009 Bank
NATIONAL PENSION SER n/a EXCH 7'358'213 5 138'849 19.04.2010 Investment Advisor
SAMSUNG C&T CORP n/a EXCH 5'976'362 4.06 - 11.11.2010 Corporation
KUN-HEE LEE n/a EXCH 4'985'464 3.38 - 11.11.2010 n/a
FIDELITY MANAGEMENT Multiple Portfolios MF-AGG 2'672'520 1.81 24'808 31.12.2010 Investment Advisor
CAPITAL WORLD INVEST Multiple Portfolios MF-AGG 2'468'141 1.68 (148'500) 30.09.2010 Investment Advisor
VANGUARD GROUP INC Multiple Portfolios MF-AGG 2'228'850 1.51 58'586 31.12.2010 Investment Advisor
FRANKLIN RESOURCES I Multiple Portfolios MF-AGG 1'367'152 0.93 (53'749) 31.12.2010 Investment Advisor
KOREA INVESTMENT TRU Multiple Portfolios MF-AGG 1'182'519 0.8 (105'310) 30.09.2010 Investment Advisor
SAMSUNG INVESTMENT T Multiple Portfolios MF-AGG 1'100'017 0.75 (31'443) 30.09.2010 Investment Advisor
MIRAE ASSET INVESTME Multiple Portfolios MF-AGG 1'008'480 0.68 (528'883) 30.09.2010 Investment Advisor
FIDELITY INTERNATION Multiple Portfolios MF-AGG 989'695 0.67 43'867 31.07.2010 Investment Advisor
MAPS INVESTMENT MANA Multiple Portfolios MF-AGG 975'142 0.66 (683'801) 30.09.2010 Mutual Fund Manager
BLACKROCK FUND ADVIS Multiple Portfolios MF-AGG 878'140 0.6 (18'860) 04.02.2011 Investment Advisor
JAE-YONG LEE n/a EXCH 840'403 0.57 - 01.07.2010 n/a
T ROWE PRICE ASSOCIA Multiple Portfolios MF-AGG 760'307 0.52 57'876 31.12.2010 Investment Advisor
SCHRODER INVESTMENT Multiple Portfolios MF-AGG 610'707 0.41 39'680 30.09.2010 Investment Advisor
CAPITAL INTERNATIONA Multiple Portfolios MF-AGG 576'368 0.39 - 31.10.2010 Investment Advisor
Firm Name Analyst Recommendation Weighting Change Target Price Date Date
Nomura CW CHUNG buy 5 M 1'350'000 Not Provided 07.02.2011
Mirae Asset Securities KIM CHANG-YEUL JAY buy 5 M 1'200'000 12 month 07.02.2011
Hyundai Securities JIN SUNG-HAE buy 5 M 1'200'000 Not Provided 01.02.2011
Daewoo Securities JAMES SONG buy 5 M 1'200'000 12 month 31.01.2011
NH Investment & Securities SEO WON-SEOK buy 5 M 1'300'000 12 month 31.01.2011
Samsung Securities KIM DO-HAN buy 5 M 1'250'000 12 month 31.01.2011
Eugene Investment & Securities Co., Ltd JEONG
LEE buy 5 M 1'200'000 12 month 31.01.2011
Shinhan Investment Corp KIM YOUNG-CHAN buy 5 M 1'300'000 Not Provided 31.01.2011
Tong Yang Investment Bank SHIN HYUNJOON buy 5 M 1'400'000 12 month 31.01.2011
Woori Investment & Securities YOUNG PARK buy 5 M 1'250'000 12 month 31.01.2011
Credit Suisse HWANG MIN-SEONG outperform 5 M 1'100'000 Not Provided 31.01.2011
UBS NICOLAS GAUDOIS buy 5 M 1'280'000 12 month 31.01.2011
KTB Securities CHOI DAVID buy 5 M 1'300'000 12 month 31.01.2011
Mizuho Securities CHARLES PARK buy 5 M 1'200'000 12 month 31.01.2011
Hanwha Securities Co., Ltd AHN SEONG-HO buy 5 M 1'300'000 Not Provided 31.01.2011
KB Investment & Securities Co., Ltd SEO JUIL RICKY buy 5 M 1'200'000 12 month 31.01.2011
HI Investment Securities SONG MYUNG-SUP buy 5 M 1'200'000 Not Provided 31.01.2011
Kyobo Securities KOO JA-WOO buy 5 M 1'350'000 6 month 31.01.2011
CLSA Asia Pacific Markets MATTHEW EVANS outperform 5 M 1'120'000 Not Provided 31.01.2011
E*Trade Securities Korea KIM HYUNG-SIK buy 5 M 1'250'000 12 month 31.01.2011
LIG Investment Securities KIM YOUNG-JOON buy 5 M 1'250'000 12 month 31.01.2011
Deutsche Bank BAE SEUNG-CHUL buy 5 M 1'200'000 12 month 30.01.2011
Korea Investment & Securities HAN SEUNG-HOON buy 5 M 1'230'000 12 month 30.01.2011
JPMorgan JJ PARK neutral 3 M 950'000 12 month 30.01.2011
Macquarie DANIEL KIM outperform 5 M 1'300'000 12 month 29.01.2011
RBS DO HOON LEE buy 5 M 1'200'000 12 month 28.01.2011
Morgan Stanley KEON HAN Overwt/Attractive 5 M 1'190'000 12 month 28.01.2011
Goldman Sachs MICHAEL BANG buy/attractive 5 M 1'100'000 12 month 28.01.2011
Citi HENRY H KIM buy 5 M 1'200'000 Not Provided 28.01.2011
Daiwa Securities Capital Markets Co. JAE H LEE outperform 5 M 1'200'000 Not Provided 28.01.2011
Taurus Investment Securities Co Ltd YOO-JIN KIM buy 5 M 1'100'000 Not Provided 18.01.2011
BNP Paribas Securities (Asia) PETER YU buy 5 M 1'060'000 12 month 12.01.2011
Dongbu Securities Co Ltd LEE MIN-HEE buy 5 M 1'200'000 12 month 10.01.2011
Shinyoung Securities Co., Ltd. SEUNG-WOO LEE buy 5 M 1'180'000 12 month 10.01.2011
Solomon Investment & Securities IM HONG-BIN buy 5 M 1'250'000 6 month 10.01.2011
Hana Daetoo Securities LEE KA-KEUN buy 5 M 1'040'000 12 month 04.01.2011
KIWOOM Securities Co Ltd KIM SUNG-IN buy 5 M 1'200'000 6 month 03.01.2011
Meritz Securities Co., Ltd LEE SUN-TAE buy 5 M 1'250'000 6 month 14.12.2010
Daishin Securities Co., Ltd. KANG JEONG-WON JEFF buy 5 M 1'100'000 Not Provided 07.12.2010
SK Securities Co Ltd HWANG YOU SIK buy 5 M 1'050'000 6 month 29.11.2010
HSBC NAM PARK overweight 5 M 1'139'000 Not Provided 08.10.2010
Ji Asia STEVE MYERS buy 5 N 897'000 12 month 28.09.2010
Q.M.S Advisors | tel: +41 (0)78 922 08 77 | e-mail: info@qmsadv.com |
3. 08.02.2011
POSCO
POSCO manufactures various types of steel products. The Company produces hot Price/Volume
rolled steel, cold rolled steel, stainless steel, and other forms of steel. The
600000 1.0 M
products are mainly used for automobile, construction, and shipbuilding .9 M
industries. 500000 .8 M
400000 .7 M
.6 M
300000 .5 M
Valuation Analysis .4 M
Latest Fiscal Year: 12/2010 200000 .3 M
LTM as of: 12/yy 100000 .2 M
.1 M
52-Week High (10.03.2010) 567'000.00
0 .0 M
52-Week Low (20.05.2010) 431'000.00 f-10 m-10 a-10 m-10 j-10 j-10 a-10 s-10 o-10 n-10 d-10 j-11 f-11
Daily Volume 578'845.00
Current Price (2/dd/yy) 482500 Market Data
52-Week High % Change -14.90% Dividend Yield 1.29
52-Week Low % Change 11.95% Beta 1.03
% 52 Week Price Range High/Low 30.15% Equity Float 64.72
Shares Out 30.09.2010 87.2 Short Int -
Market Capitalization 42'067'650.00 1 Yr Total Return -4.55%
Total Debt 6'123'583.00 YTD Return -0.92%
Preferred Stock 0.0 Adjusted BETA 1.032
Minority Interest 0.0 Analyst Recs 40
Cash and Equivalents 6'743'750.00 Consensus Rating 5.000
Enterprise Value 46'575'740.00 Average Daily Trading Volume
Relative Stock Price Performance Average Volume 5 Day 328'206
005490 KS EQUITY YTD Change - Average Volume 30 Day 305'435
005490 KS EQUITY YTD % CHANGE - Average Volume 3 Month 301'416
Fiscal Year Ended LTM-4Q LTM FY+1 FY+2 FQ+1 FQ+2
31.12.2006 31.12.2007 31.12.2008 31.12.2009 31.12.2010 12/yy 12/yy 12/11 Y 12/12 Y 03/11 Q1 06/11 Q2
Total Revenue 20'043'408 22'206'686 30'642'410 26'953'945 32'582'037 26'953'945 32'588'298 38'111'587 38'807'501 8'987'907 9'501'997
TEV/Revenue 1.14x 1.92x 1.00x 1.74x - 5.51x 3.86x 1.20x 1.16x 5.07x 4.81x
EBITDA 5'448'997.4 6'028'563.5 8'448'098.8 5'207'546.3 - ######### ######### ######### ######### ######### #########
TEV/EBITDA 4.21x 7.06x 3.61x 9.02x - 9.03x 0.00x 5.96x 5.51x 5.91x -
Net Income 3'206'604.8 3'679'431.5 4'446'933.0 3'172'263.5 4'202'790.9 ######### ######### ######### ######### ######### #########
P/E 7.58x 11.87x 6.45x 14.93x - 14.95x 0.00x 9.05x 8.38x 9.26x -
Profitability S&P Issuer Ratings
EBITDA 5'207'547.00 Long-Term Rating Date 20.02.2007
EBIT 5'047'046.00 Long-Term Rating A
Operating Margin 15.49% Long-Term Outlook STABLE
Pretax Margin 13.29% Short-Term Rating Date -
Return on Assets 8.24% Short-Term Rating -
Return on Common Equity 10.80% Credit Ratios
Return on Capital 9.79% EBITDA/Interest Exp. 18.05
Asset Turnover 0.70% (EBITDA-Capex)/Interest Exp. 3.21
Margin Analysis Net Debt/EBITDA -0.12
Gross Margin 16.2% Total Debt/EBITDA 1.18
EBITDA Margin 19.3% Reference
EBIT Margin 15.5% Total Debt/Equity 19.8%
Net Income Margin 12.9% Total Debt/Capital 16.5%
Structure Asset Turnover 0.70
Current Ratio 4.81 Net Fixed Asset Turnover 1.73
Quick Ratio 3.51 Accounts receivable turnover-days 40.03
Debt to Assets 15.31% Inventory Days 76.09
Tot Debt to Common Equity 19.78% Accounts Payable Turnover Day 17.61
Accounts Receivable Turnover 9.12 Cash Conversion Cycle 98.51
Inventory Turnover 4.80
Price/ Cash Flow Sales/Revenue/Turnover
1.20 35'000'000.0
30'000'000.0
1.00
25'000'000.0
0.80
20'000'000.0
0.60 15'000'000.0
0.40 10'000'000.0
5'000'000.0
0.20
0.0
0.00 1999 2000 2001 2002 2003 2004 2005 2006 2007 2008 2009 2010
Q.M.S Advisors | tel: +41 (0)78 922 08 77 | e-mail: info@qmsadv.com |
4. 08.02.2011
POSCO
Holdings By: All
Holder Name Portfolio Name Source Amt Held % Out Latest Chg File Dt Inst Type
BANK OF NEW YORK n/a Co File 16'080'142 18.44 (434'614) 30.09.2010 Investment Advisor
POSCO n/a Co File 10'153'957 11.65 - 30.09.2010 Corporation
NATIONAL PENSION SER n/a Co File 4'432'053 5.08 4'441 30.09.2010 Investment Advisor
MIRAE ASSET INVESTME n/a 20F 2'817'800 3.23 - 31.12.2009 Investment Advisor
SK TELECOM CO LTD n/a Co File 2'481'400 2.85 90 30.09.2010 Corporation
EMPLOYEE STOCK OWNER n/a Co File 2'332'170 2.67 (338'478) 30.09.2010 n/a
POHANG UNIV OF SCIEN n/a 20F 2'000'000 2.29 - 31.12.2009 Other
CAPITAL WORLD INVEST Multiple Portfolios MF-AGG 1'368'680 1.57 - 30.09.2010 Investment Advisor
MITSUBISHI CORP n/a Co File 1'012'169 1.16 - 31.03.2010 Corporation
VANGUARD GROUP INC Multiple Portfolios MF-AGG 747'628 0.86 17'328 31.12.2010 Investment Advisor
MAPS INVESTMENT MANA Multiple Portfolios MF-AGG 585'357 0.67 168'215 30.09.2010 Mutual Fund Manager
BLACKROCK FUND ADVIS Multiple Portfolios MF-AGG 515'280 0.59 (16'860) 04.02.2011 Investment Advisor
FIDELITY INTERNATION Multiple Portfolios MF-AGG 450'889 0.52 24'289 31.07.2010 Investment Advisor
SAMSUNG INVESTMENT T Multiple Portfolios MF-AGG 438'962 0.5 (65'070) 30.09.2010 Investment Advisor
KOREA INVESTMENT TRU Multiple Portfolios MF-AGG 345'552 0.4 15'505 30.09.2010 Investment Advisor
SCHRODER INVESTMENT Multiple Portfolios MF-AGG 345'397 0.4 104'462 30.09.2010 Investment Advisor
GRANTHAM MAYO VAN OT Multiple Portfolios MF-AGG 313'186 0.36 - 31.05.2010 Investment Advisor
T ROWE PRICE ASSOCIA Multiple Portfolios MF-AGG 296'638 0.34 44'534 31.12.2010 Investment Advisor
BLACKROCK ASSET MANA Multiple Portfolios MF-AGG 264'242 0.3 (14'047) 31.12.2010 Investment Advisor
SHINYOUNG INVESTMENT Multiple Portfolios MF-AGG 225'503 0.26 (36'771) 30.09.2010 Mutual Fund Manager
Firm Name Analyst Recommendation Weighting Change Target Price Date Date
JPMorgan JINMOOK KIM overweight 5 M 560'000 6 month 01.02.2011
E*Trade Securities Korea CHO GANG-UN buy 5 M 630'000 Not Provided 25.01.2011
Samsung Securities KIM CHRIS buy 5 M 700'000 Not Provided 19.01.2011
LIG Investment Securities BYUN JONG-MAN buy 5 M 620'000 12 month 19.01.2011
Macquarie CHRISTINA LEE outperform 5 M 610'000 12 month 18.01.2011
Daishin Securities Co., Ltd. MOON JEONG-UP buy 5 M 580'000 6 month 14.01.2011
NH Investment & Securities KIM MI-HYUN buy 5 M 584'000 6 month 14.01.2011
Hyundai Securities KIM HYUN-TAE buy 5 M 570'000 Not Provided 14.01.2011
Eugene Investment & Securities Co., LtdGYUNG-JUNG KIM buy 5 M 590'000 12 month 14.01.2011
Shinhan Investment Corp PARK BYUNGCHIL buy 5 M 600'000 Not Provided 14.01.2011
Tong Yang Investment Bank KEE-HYUN PARK buy 5 M 600'000 12 month 14.01.2011
Woori Investment & Securities LEE CHANG-MOK buy 5 N 600'000 12 month 14.01.2011
Credit Suisse SINN MIN-SEOK outperform 5 M 675'000 Not Provided 14.01.2011
UBS SON YONG-SUK buy 5 M 640'000 12 month 14.01.2011
KTB Securities HA JONG-HYUK JAMES buy 5 M 600'000 12 month 14.01.2011
Hanwha Securities Co., Ltd KIM KANG-OH buy 5 M 630'000 6 month 14.01.2011
KB Investment & Securities Co., Ltd LEE JONG-HYUNG buy 5 M 600'000 12 month 14.01.2011
HI Investment Securities CHUNG JI-YUN buy 5 M 570'000 Not Provided 14.01.2011
Kyobo Securities UM JIN-SEOK buy 5 M 630'000 6 month 14.01.2011
KIWOOM Securities Co Ltd KIM JONG-JAE buy 5 M 640'000 6 month 14.01.2011
Hana Daetoo Securities KIM JUNG-WOOK buy 5 M 670'000 12 month 14.01.2011
CLSA Asia Pacific Markets GEOFF BOYD outperform 5 M 560'100 Not Provided 14.01.2011
RBS JEANNETTE SIM buy 5 M 565'000 12 month 13.01.2011
Deutsche Bank CHANWOOK PARK buy 5 M 600'000 12 month 13.01.2011
Morgan Stanley CHARLES C SPENCER Overwt/Attractive 5 M 650'000 12 month 13.01.2011
Korea Investment & Securities MOON SUN CHOI buy 5 M 600'000 12 month 13.01.2011
SK Securities Co Ltd LEE WON JAE buy 5 M 540'000 6 month 13.01.2011
Goldman Sachs RAJEEV R DAS Buy/Neutral 5 M 576'000 12 month 13.01.2011
Citi PARK SUNG-MEE buy 5 M 600'000 Not Provided 13.01.2011
HSBC DANIEL KANG overweight 5 M 600'000 Not Provided 13.01.2011
Daiwa Securities Capital Markets Co. CHUNG SUNG-YOP outperform 5 M 530'000 Not Provided 13.01.2011
Daewoo Securities JEON SEUNG-HUN buy 5 M 620'000 12 month 10.01.2011
Meritz Securities Co., Ltd SHIN YOON-SHIK buy 5 M 600'000 6 month 05.01.2011
BNP Paribas Securities (Asia) JAE RHEE buy 5 M 610'000 12 month 04.01.2011
Solomon Investment & Securities BANG MIN-JIN buy 5 N 663'000 6 month 04.01.2011
Nomura CINDY PARK buy 5 M 670'000 Not Provided 10.12.2010
DBS Vickers LEE EUN YOUNG buy 5 M 600'000 12 month 13.10.2010
Dongbu Securities Co Ltd KIM JI-HWAN buy 5 M 646'000 12 month 07.10.2010
Ji Asia SAM THAWLEY buy 5 N 622'000 12 month 20.08.2010
Q.M.S Advisors | tel: +41 (0)78 922 08 77 | e-mail: info@qmsadv.com |
5. 08.02.2011
Hyundai Motor Co
Hyundai Motor Company manufactures, sells, and exports passenger cars, trucks, Price/Volume
and commercial vehicles. The Company also sells various auto parts and operates
250000 3.0 M
auto repair service centers throughout South Korea. Hyundai Motor provides
financial services through its subsidiaries. 200000 2.5 M
2.0 M
150000
1.5 M
Valuation Analysis 100000
Latest Fiscal Year: 12/2010 1.0 M
LTM as of: 12/yy 50000 .5 M
52-Week High (14.01.2011) 203'000.00
0 .0 M
52-Week Low (15.03.2010) 107'000.00 f-10 m-10 a-10 m-10 j-10 j-10 a-10 s-10 o-10 n-10 d-10 j-11 f-11
Daily Volume 874'886.00
Current Price (2/dd/yy) 181000 Market Data
52-Week High % Change -10.84% Dividend Yield 0.95
52-Week Low % Change 69.16% Beta 0.96
% 52 Week Price Range High/Low 81.25% Equity Float 138.61
Shares Out 30.09.2010 220.3 Short Int -
Market Capitalization 39'870'040.00 1 Yr Total Return 57.36%
Total Debt 2'117'939.00 YTD Return 4.32%
Preferred Stock 331'011.0 Adjusted BETA 0.956
Minority Interest 0.0 Analyst Recs 43
Cash and Equivalents 7'298'308.00 Consensus Rating 4.860
Enterprise Value 34'352'810.00 Average Daily Trading Volume
Relative Stock Price Performance Average Volume 5 Day 1'296'610
005380 KS EQUITY YTD Change - Average Volume 30 Day 1'035'014
005380 KS EQUITY YTD % CHANGE - Average Volume 3 Month 948'925
Fiscal Year Ended LTM-4Q LTM FY+1 FY+2 FQ+1 FQ+2
31.12.2006 31.12.2007 31.12.2008 31.12.2009 31.12.2010 12/yy 12/yy 12/11 Y 12/12 Y 03/11 Q1 06/11 Q2
Total Revenue 27'335'368 30'619'671 32'189'786 31'859'327 36'769'426 31'859'327 36'764'965 38'773'916 40'038'676 9'033'146 10'130'022
TEV/Revenue 0.43x 0.41x 0.20x 0.64x - 2.02x 1.95x 0.85x 0.79x 3.75x 3.31x
EBITDA 2'330'513 3'111'933 3'221'449 3'649'386 - 3'649'386 3'378'215 5'164'959 5'443'320 1'160'769 1'339'139
TEV/EBITDA 5.00x 4.07x 2.05x 5.60x - 5.60x 0.00x 6.65x 6.31x 6.88x -
Net Income 1'526'063.0 1'682'419.0 1'447'904.0 2'961'509.0 5'266'971.0 ######### ######### ######### ######### ######### #########
P/E 9.60x 11.54x 7.42x 11.11x - 11.11x 0.00x 8.54x 7.95x 8.99x -
Profitability S&P Issuer Ratings
EBITDA 3'649'386.00 Long-Term Rating Date 04.11.2010
EBIT 3'226'617.00 Long-Term Rating BBB
Operating Margin 8.78% Long-Term Outlook STABLE
Pretax Margin 11.87% Short-Term Rating Date -
Return on Assets 8.53% Short-Term Rating -
Return on Common Equity 14.07% Credit Ratios
Return on Capital 13.45% EBITDA/Interest Exp. 15.72
Asset Turnover 0.94% (EBITDA-Capex)/Interest Exp. 12.24
Margin Analysis Net Debt/EBITDA -1.42
Gross Margin 21.9% Total Debt/EBITDA 0.58
EBITDA Margin 11.5% Reference
EBIT Margin 8.8% Total Debt/Equity 9.8%
Net Income Margin 14.3% Total Debt/Capital 8.8%
Structure Asset Turnover 0.94
Current Ratio 1.32 Net Fixed Asset Turnover 3.27
Quick Ratio 1.06 Accounts receivable turnover-days 26.75
Debt to Assets 5.98% Inventory Days 23.42
Tot Debt to Common Equity 9.76% Accounts Payable Turnover Day 46.93
Accounts Receivable Turnover 13.65 Cash Conversion Cycle 3.23
Inventory Turnover 15.58
Price/ Cash Flow Sales/Revenue/Turnover
1.20 40'000'000.0
35'000'000.0
1.00
30'000'000.0
0.80 25'000'000.0
20'000'000.0
0.60
15'000'000.0
0.40 10'000'000.0
5'000'000.0
0.20
0.0
0.00 1999 2000 2001 2002 2003 2004 2005 2006 2007 2008 2009 2010
Q.M.S Advisors | tel: +41 (0)78 922 08 77 | e-mail: info@qmsadv.com |
6. 08.02.2011
Hyundai Motor Co
Holdings By: All
Holder Name Portfolio Name Source Amt Held % Out Latest Chg File Dt Inst Type
HYUNDAI MOBIS n/a EXCH 45'782'023 20.78 - 26.01.2011 Corporation
NATIONAL PENSION SER n/a Co File 13'103'446 5.95 - 31.12.2009 Investment Advisor
MIRAE ASSET INVESTME n/a EXCH 13'054'486 5.93 (2'548'444) 29.01.2010 Investment Advisor
MONG-KOO CHUNG n/a EXCH 11'408'754 5.18 (6'445) 26.01.2011 n/a
HYUNDAI MOTOR CO n/a EXCH 11'005'030 5 - 26.01.2011 Corporation
WADDELL & REED FINAN Multiple Portfolios MF-AGG 5'842'800 2.65 (3'289'300) 31.12.2010 Investment Advisor
VANGUARD GROUP INC Multiple Portfolios MF-AGG 5'310'375 2.41 783'650 31.12.2010 Investment Advisor
BLACKROCK FUND ADVIS Multiple Portfolios MF-AGG 3'121'179 1.42 (19'438) 04.02.2011 Investment Advisor
THORNBURG INVESTMENT Multiple Portfolios MF-AGG 2'820'953 1.28 - 31.12.2010 Investment Advisor
FIDELITY MANAGEMENT Multiple Portfolios MF-AGG 2'070'377 0.94 (63'897) 31.12.2010 Investment Advisor
FRANKLIN RESOURCES I Multiple Portfolios MF-AGG 2'051'999 0.93 (131'328) 31.12.2010 Investment Advisor
MAPS INVESTMENT MANA Multiple Portfolios MF-AGG 1'999'295 0.91 (2'434'061) 30.09.2010 Mutual Fund Manager
SAMSUNG INVESTMENT T Multiple Portfolios MF-AGG 1'966'790 0.89 (120'821) 30.09.2010 Investment Advisor
CAPITAL WORLD INVEST Multiple Portfolios MF-AGG 1'965'690 0.89 55'000 30.09.2010 Investment Advisor
WILLIAM BLAIR & COMP WILLIAM BLAIR & COMP 13F 1'961'924 0.89 (224'965) 30.09.2010 Investment Advisor
FIDELITY INTERNATION Multiple Portfolios MF-AGG 1'782'601 0.81 49'728 30.06.2010 Investment Advisor
SCHRODER INVESTMENT Multiple Portfolios MF-AGG 1'078'133 0.49 (18'705) 30.09.2010 Investment Advisor
ARTIO GLOBAL MANAGEM Multiple Portfolios MF-AGG 906'561 0.41 (530) 31.10.2010 Investment Advisor
GRANTHAM MAYO VAN OT Multiple Portfolios MF-AGG 900'817 0.41 - 31.05.2010 Investment Advisor
UBS HANA ASSET MANAG Multiple Portfolios MF-AGG 755'886 0.34 (195'677) 30.09.2010 Mutual Fund Manager
Firm Name Analyst Recommendation Weighting Change Target Price Date Date
Hyundai Securities CHAE HEE-GUEN buy 5 M 250'000 12 month 08.02.2011
Shinyoung Securities Co., Ltd. HWA-JIN PARK buy 5 M 275'000 12 month 07.02.2011
Hana Daetoo Securities SE-JOON MO buy 5 M 254'000 12 month 07.02.2011
CLSA Asia Pacific Markets GEOFF BOYD buy 5 U 222'000 Not Provided 07.02.2011
BNP Paribas Securities (Asia) JAMES HIE SUK YOON hold 3 M 195'000 12 month 01.02.2011
Daewoo Securities PARK YOUNG HO buy 5 M 270'000 12 month 31.01.2011
Golden Bridge Investment & Securities KIM SEUNG-HWAN buy 5 M 250'000 6 month 31.01.2011
Daishin Securities Co., Ltd. KIM BYUNG-KUK buy 5 M 240'000 6 month 28.01.2011
NH Investment & Securities LEE SANG-HYUN buy 5 M 250'000 6 month 28.01.2011
Samsung Securities YOON PIL-JOONG buy 5 M 260'000 12 month 28.01.2011
Eugene Investment & Securities Co., LtdPARK SANG-WON buy 5 M 225'000 12 month 28.01.2011
Shinhan Investment Corp LEE KI-JEONG buy 5 M 260'000 Not Provided 28.01.2011
Tong Yang Investment Bank AHN SANG JOON buy 5 M 250'000 12 month 28.01.2011
Woori Investment & Securities CHO SOO-HONG buy 5 M 250'000 12 month 28.01.2011
Credit Suisse HENRY KWON neutral 3 U 206'000 Not Provided 28.01.2011
Macquarie MICHAEL SOHN outperform 5 M 260'000 12 month 28.01.2011
KTB Securities NAM KYEONG MOON buy 5 M 230'000 12 month 28.01.2011
DBS Vickers JAY KIM buy 5 M 240'000 12 month 28.01.2011
Hanwha Securities Co., Ltd KANG SANG-MIN outperform 5 M 210'000 6 month 28.01.2011
KB Investment & Securities Co., Ltd SHIN CHUNG-KWAN buy 5 M 230'000 12 month 28.01.2011
Kyobo Securities SONG SANG-HOON buy 5 M 240'000 6 month 28.01.2011
Solomon Investment & Securities HYUNG-SIL LEE buy 5 M 260'000 6 month 28.01.2011
Mirae Asset Securities KIM GREGORY BYUNG-KWAN buy 5 M 225'000 12 month 28.01.2011
E*Trade Securities Korea LEE MYUNG-HOON buy 5 M 260'000 12 month 28.01.2011
Taurus Investment Securities Co Ltd SUN-HAENG KIM buy 5 M 246'000 6 month 28.01.2011
LIG Investment Securities IN-WOO PARK buy 5 M 270'000 12 month 28.01.2011
Deutsche Bank SANJEEV RANA buy 5 M 270'000 12 month 27.01.2011
Morgan Stanley PARK SANG-KYOO Overwt/Attractive 5 M 256'000 12 month 27.01.2011
JPMorgan PARK WAN SUN overweight 5 M 210'000 6 month 27.01.2011
HSBC ANGELA HONG overweight 5 M 240'000 Not Provided 27.01.2011
Daiwa Securities Capital Markets Co. CHUNG SUNG-YOP outperform 5 M 230'000 Not Provided 27.01.2011
HI Investment Securities CHOI DAE-SIK buy 5 M 250'000 Not Provided 27.01.2011
Korea Investment & Securities SUH SUNGMOON buy 5 M 250'000 12 month 17.01.2011
Citi ETHAN KIM buy 5 M 250'000 Not Provided 12.01.2011
SK Securities Co Ltd KIM YONG-SOO buy 5 M 225'000 6 month 13.12.2010
UBS CHANG YOUNG-WOO buy 5 M 240'000 12 month 13.12.2010
RBS SIMON PARK hold 3 M 177'000 12 month 09.12.2010
Nomura JUSTIN LEE buy 5 M 210'000 Not Provided 08.12.2010
Dongbu Securities Co Ltd YIM EUN-YOUNG buy 5 M 250'000 12 month 30.11.2010
Hanyang Securities YEON-WOO KIM buy 5 M 230'000 Not Provided 29.11.2010
Ji Asia STEPHEN USHER buy 5 N 190'000 12 month 27.09.2010
KIWOOM Securities Co Ltd LEE SEONG-JAE buy 5 M 170'000 6 month 23.04.2010
Bookook Securities Co Ltd AHN JONG-HOON buy 5 M 155'000 6 month 01.04.2010
Q.M.S Advisors | tel: +41 (0)78 922 08 77 | e-mail: info@qmsadv.com |
7. 08.02.2011
Hyundai Heavy Industries Co Ltd
Hyundai Heavy Industries Co., Ltd. builds ships for commercial, and military Price/Volume
purposes. The Company manufactures oil tankers, cargo and passenger vessels,
600000 1.2 M
and warships. Hyundai Heavy Industries also produces heavy industrial
machineries, electrical components for engines and power trains, and industrial 500000 1.0 M
vehicles, such as cranes and bulldozers. 400000 .8 M
300000 .6 M
Valuation Analysis
Latest Fiscal Year: 12/2010 200000 .4 M
LTM as of: 12/yy 100000 .2 M
52-Week High (28.01.2011) 513'000.00
0 .0 M
52-Week Low (25.05.2010) 199'500.00 f-10 m-10 a-10 m-10 j-10 j-10 a-10 s-10 o-10 n-10 d-10 j-11 f-11
Daily Volume 439'727.00
Current Price (2/dd/yy) 463000 Market Data
52-Week High % Change -9.75% Dividend Yield 2.02
52-Week Low % Change 132.08% Beta 1.34
% 52 Week Price Range High/Low 87.56% Equity Float 36.65
Shares Out 30.09.2010 76.0 Short Int -
Market Capitalization 35'188'000.00 1 Yr Total Return 126.67%
Total Debt 889'556.50 YTD Return 4.51%
Preferred Stock 0.0 Adjusted BETA 1.344
Minority Interest 0.0 Analyst Recs 37
Cash and Equivalents 741'594.30 Consensus Rating 4.892
Enterprise Value 37'647'010.00 Average Daily Trading Volume
Relative Stock Price Performance Average Volume 5 Day 230'205
009540 KS EQUITY YTD Change - Average Volume 30 Day 256'240
009540 KS EQUITY YTD % CHANGE - Average Volume 3 Month 291'677
Fiscal Year Ended LTM-4Q LTM FY+1 FY+2 FQ+1 FQ+2
31.12.2006 31.12.2007 31.12.2008 31.12.2009 31.12.2010 12/yy 12/yy 12/11 Y 12/12 Y 03/11 Q1 06/11 Q2
Total Revenue 12'554'744 15'533'014 19'957'080 21'142'198 22'405'200 21'142'197 22'405'224 25'300'261 26'749'929 6'179'001 6'302'901
TEV/Revenue 0.56x 1.55x 0.48x 0.50x - 2.05x 2.28x 1.42x 1.28x 5.88x 5.72x
EBITDA 1'257'629.0 2'142'637.0 2'596'964.0 2'666'205.0 - ######### ######### ######### ######### ######### #########
TEV/EBITDA 5.60x 11.25x 3.66x 4.00x - 4.02x 0.00x 9.28x 9.43x 9.42x -
Net Income 712'847.6 1'736'060.3 2'256'664.8 2'146'488.8 3'761'100.0 ######### ######### ######### ######### 895'027.0 900'316.6
P/E 11.40x 15.93x 5.34x 4.86x - 4.86x 0.00x 9.68x 9.79x 9.68x -
Profitability S&P Issuer Ratings
EBITDA 2'666'205.00 Long-Term Rating Date -
EBIT 3'439'400.00 Long-Term Rating -
Operating Margin 15.35% Long-Term Outlook -
Pretax Margin 12.53% Short-Term Rating Date -
Return on Assets 8.56% Short-Term Rating -
Return on Common Equity 27.87% Credit Ratios
Return on Capital 26.68% EBITDA/Interest Exp. 78.12
Asset Turnover 0.84% (EBITDA-Capex)/Interest Exp. 43.58
Margin Analysis Net Debt/EBITDA 0.06
Gross Margin 14.9% Total Debt/EBITDA 0.33
EBITDA Margin 12.6% Reference
EBIT Margin 15.4% Total Debt/Equity 9.1%
Net Income Margin 16.8% Total Debt/Capital 8.3%
Structure Asset Turnover 0.84
Current Ratio 0.82 Net Fixed Asset Turnover 2.95
Quick Ratio 0.44 Accounts receivable turnover-days 81.77
Debt to Assets 3.58% Inventory Days 42.51
Tot Debt to Common Equity 9.07% Accounts Payable Turnover Day 38.90
Accounts Receivable Turnover 4.46 Cash Conversion Cycle 85.37
Inventory Turnover 8.59
Price/ Cash Flow Sales/Revenue/Turnover
1.20 25'000'000.0
1.00 20'000'000.0
0.80
15'000'000.0
0.60
10'000'000.0
0.40
5'000'000.0
0.20
0.0
0.00 1999 2000 2001 2002 2003 2004 2005 2006 2007 2008 2009 2010
Q.M.S Advisors | tel: +41 (0)78 922 08 77 | e-mail: info@qmsadv.com |
8. 08.02.2011
Hyundai Heavy Industries Co Ltd
Holdings By: All
Holder Name Portfolio Name Source Amt Held % Out Latest Chg File Dt Inst Type
HYUNDAI HEAVY INDUST n/a EXCH 14'711'560 19.36 - 24.01.2011 Corporation
MONG-JOON CHUNG n/a EXCH 8'210'005 10.8 - 08.10.2010 n/a
HYUNDAI MIPO DOCKYAR n/a EXCH 6'063'000 7.98 - 08.10.2010 Corporation
KCC CORP n/a EXCH 5'109'063 6.72 (1'081'347) 16.12.2010 Corporation
MIRAE ASSET INVESTME n/a EXCH 3'611'127 4.75 - 27.02.2009 Investment Advisor
NATIONAL PENSION SER n/a EXCH 3'241'863 4.27 (770'750) 22.05.2009 Investment Advisor
ASAN FOUNDATION n/a EXCH 1'920'000 2.53 - 08.09.2010 n/a
MAPS INVESTMENT MANA Multiple Portfolios MF-AGG 1'779'673 2.34 355'843 30.09.2010 Mutual Fund Manager
VANGUARD GROUP INC Multiple Portfolios MF-AGG 1'209'828 1.59 80'577 31.12.2010 Investment Advisor
BLACKROCK FUND ADVIS Multiple Portfolios MF-AGG 711'843 0.94 (3'094) 04.02.2011 Investment Advisor
SAMSUNG INVESTMENT T Multiple Portfolios MF-AGG 448'859 0.59 105'449 30.09.2010 Investment Advisor
GRANTHAM MAYO VAN OT Multiple Portfolios MF-AGG 360'751 0.47 - 31.05.2010 Investment Advisor
FIDELITY INTERNATION Multiple Portfolios MF-AGG 289'818 0.38 5'851 30.04.2010 Investment Advisor
KOREA INVESTMENT TRU Multiple Portfolios MF-AGG 281'074 0.37 130'884 30.09.2010 Investment Advisor
INVESCO LTD Multiple Portfolios MF-AGG 215'567 0.28 - 07.02.2011 Investment Advisor
UBS HANA ASSET MANAG Multiple Portfolios MF-AGG 191'765 0.25 176'137 30.09.2010 Mutual Fund Manager
FIDELITY MANAGEMENT Multiple Portfolios MF-AGG 170'264 0.22 39'580 31.12.2010 Investment Advisor
SHINYOUNG INVESTMENT Multiple Portfolios MF-AGG 167'135 0.22 (3'378) 30.09.2010 Mutual Fund Manager
KYOBO AXA INVESTMENT Multiple Portfolios MF-AGG 162'740 0.21 (41'692) 30.09.2010 Mutual Fund Manager
BLACKROCK ASSET MANA Multiple Portfolios MF-AGG 160'306 0.21 (8'148) 31.12.2010 Investment Advisor
Firm Name Analyst Recommendation Weighting Change Target Price Date Date
UBS SON YONG-SUK suspended coverage #N/A N/A M #N/A N/A Not Provided 31.01.2011
NH Investment & Securities OK HYO-WON buy 5 M 650'000 6 month 28.01.2011
Hyundai Securities LEE SANG-HWA buy 5 M 620'000 Not Provided 28.01.2011
Samsung Securities HAN YOUNG-SOO buy 5 M 620'000 12 month 28.01.2011
Shinhan Investment Corp JOEY LEE buy 5 M 580'000 Not Provided 28.01.2011
Tong Yang Investment Bank LEE JAE-WON buy 5 M 600'000 12 month 28.01.2011
Credit Suisse HENRY KWON outperform 5 U 600'000 Not Provided 28.01.2011
JPMorgan JINMOOK KIM overweight 5 M 600'000 12 month 28.01.2011
Macquarie LEE JUWON outperform 5 M 630'000 12 month 28.01.2011
KTB Securities LEE BONG-JIN buy 5 M 570'000 12 month 28.01.2011
Hanwha Securities Co., Ltd DONG-IK JEONG buy 5 M 610'000 Not Provided 28.01.2011
BNP Paribas Securities (Asia) JAMES HIE SUK YOON buy 5 M 580'000 12 month 28.01.2011
KB Investment & Securities Co., Ltd YOO JAE-HUN buy 5 M 550'000 12 month 28.01.2011
HI Investment Securities HUR SEONG-DUK buy 5 M 620'000 6 month 28.01.2011
LIG Investment Securities CHOI GWANG-SHIK buy 5 M 700'000 12 month 28.01.2011
Deutsche Bank SANJEEV RANA buy 5 M 620'000 12 month 27.01.2011
Morgan Stanley PARK SANG-KYOO Overwt/Attractive 5 M 468'000 12 month 27.01.2011
Goldman Sachs ERIC NISHIMURA Buy/Neutral 5 M 555'000 12 month 27.01.2011
Daiwa Securities Capital Markets Co. CHUNG SUNG-YOP buy 5 M 600'000 Not Provided 27.01.2011
Hana Daetoo Securities KIM HYUN buy 5 M 580'000 12 month 25.01.2011
Citi ETHAN KIM buy 5 M 615'000 Not Provided 24.01.2011
Solomon Investment & Securities JUN YONG-BUM buy 5 M 574'000 6 month 24.01.2011
Woori Investment & Securities SONG JAE-HAK MARTIN buy 5 M 580'000 12 month 20.01.2011
HSBC PAUL CHOI overweight 5 M 600'000 Not Provided 18.01.2011
Dongbu Securities Co Ltd KIM HONG-GYUN buy 5 M 620'000 12 month 13.01.2011
Daewoo Securities SUNG KI-JONG buy 5 M 600'000 12 month 12.01.2011
Daishin Securities Co., Ltd. JEON JAE-CHEON buy 5 M 580'000 6 month 11.01.2011
Shinyoung Securities Co., Ltd. UM KYUNG-A buy 5 M 640'000 Not Provided 11.01.2011
Mirae Asset Securities LEE SOKJE buy 5 M 540'000 12 month 06.01.2011
RBS LEE JAE-KYU buy 5 M 500'000 12 month 03.01.2011
Ji Asia TONY MOYER buy 5 N 532'000 12 month 26.11.2010
Korea Investment & Securities YANG JEONG-DONG buy 5 M 450'000 12 month 22.11.2010
KIWOOM Securities Co Ltd CHOI WON-KYUNG buy 5 M 470'000 6 month 22.11.2010
CLSA Asia Pacific Markets MARK M YOON underperform 1 M 210'000 Not Provided 29.10.2010
DnBNOR Markets THOR ANDRE LUNDER buy 5 M 300'000 Not Provided 10.08.2010
SK Securities Co Ltd LEE JI-HOON strong buy 5 M 360'000 6 month 14.06.2010
Eugene Investment & Securities Co., LtdKIM SOO-JIN buy 5 M 323'000 12 month 26.04.2010
Q.M.S Advisors | tel: +41 (0)78 922 08 77 | e-mail: info@qmsadv.com |