Survey Report on Current Hard Drug Users in Nepal -2069
•
1 like•1,426 views

Survey Report on Current Hard Drug Users in Nepal -2069

Recommended
More Related Content
What's hot
What's hot (20)
Similar to Survey Report on Current Hard Drug Users in Nepal -2069
Similar to Survey Report on Current Hard Drug Users in Nepal -2069 (20)
More from Niraj Bartaula
More from Niraj Bartaula (20)
Recently uploaded
Recently uploaded (20)
Survey Report on Current Hard Drug Users in Nepal -2069
- 1. – 2 – Survey Report on Current Hard Drug Users in Nepal - 2069 Prepared by: Government of Nepal Central Bureau of Statistics Government of Nepal Ministry of Home Affairs
- 2. – 5 – Survey Report on Current Hard Drug Users in Nepal - 2069 Prepared by: Government of Nepal Central Bureau of Statistics Government of Nepal Ministry of Home Affairs
- 3. – 6 – Survey Report on Current Hard Drug Users in Nepal - 2069 Published by : Ministry of Home Affairs Drug Control Programme Bijulibazar, Kathmandu Tel : 4780807 Fax : 4784627 Email : dcpmoha@gmail.com web site : www.moha.gov.np C Ministry of Home Affairs Drug Control Programme Bijulibazar, Kathmandu
- 4. – 7 –
- 5. – 8 –
- 6. – 9 – Contents Chapter 1: Introduction 1 1.1 Background 1 1.2 Survey Objective 2 Chapter 2: Methodology 3 2.1 Study Area 3 2.2. Hard Drug Users defined in the survey 5 2.3. Data Source and Sample Size 6 2.4. Reference Period of the Survey 8 2.5 Limitation of the survey 8 Chapter 3: Demographic Characteristics 9 3.1 Estimated Number of current hard drug users: 9 3.2 Age patterns of drug users: 10 3.3 Age at first drug intake: 11 3.4 Marital Status: 12 3.5. Living arrangement of drug users: 12 3.6 Currently attending school/campus: 13 3.7 Educational status of drug users: 13 3.8 Occupational Status of drug users: 14 3.9 Hard drug users using household facilities: 14 Chapter 4: Drug Use and Treatment Behavior 16 4.1 Type of drug used: 16 4.2 Most common combination of drug categories by current hard drug users: 17 4.3 Most Common drugs by age groups: 18 4.4 Number of years drug intake: 18 4.5 Frequency of drug taken per day: 19 4.6 Amount spends for a single dose of drug: 20 4.7 Source of drug: 20
- 7. – 10 – 4.8 Mode of drug intake: 21 4.9 Source of getting Injection: 22 4.10 Reasons of drug intake: 22 4.11 Voice of drug users: 23 4.12 Perception of drug users to control drug use in the country: 24 4.13 Ever tried to stop drug taking habit: 24 Chapter 4: Summary 26 Summary Table of Findings 27 Annexes 31 List of Rehabilitation centers visited 35 Main Questionnaire 37 Listing Form 39
- 8. – 1 – Chapter 1: Introduction 1.1 Background With around 27 million people, Nepal is sandwiched between two most populous countries of the world, India to the east, south and west, and China to the north. It is still in transition even after the onset of multi-party democracy in 1990 with facing domestic social, economic, and political issues that is hindering development. Such circumstances are likely to contribute to build a potential area for illicit drug business in Nepal. Drug abuse is a worldwide problem that affects millions of people, and Nepal is no exception. Over the last years, growing drug use has been of increasing concern to the society in Nepal. It is mainly the young boys and girls who are engaging in drug use for a variety of reasons and many young Nepalese have already died from drug use. Drug use poses serious challenges as it affects foremost the health and life of the drug user, the social well-being of the family and community. Drugs such as cannabis and alcohol were traditionally used in Nepal for centuries. Use of these drugs as part of the cultural norms did not create major social problems during that period. However, the types of drug used have been shifted since the last few decades from cannabis to synthetic opiates and chemical substances. Also, the mode of drug uses has changed from smoking/ingesting to injecting and that has
- 9. – 2 – become one of the major causes of HIV infection too. So, drug abuse has become multi-dimensional problem in Nepal and drug control, a challenge for the government. Ministry of Home Affairs (MoHA) and other Non Governmental Organizations has been working rigorously to overcome this situation. Upon the request of the Ministry of Home Affairs, Central Bureau of Statistics (CBS) had conducted a survey on hard drug users (HDU) in Nepal in 2063. The main objective of the survey was to estimate the size and characteristics of HDU in Nepal. During that period, the size of HDU was estimated at 46,309. To measure the level, pattern and trends in HDU during the last six years period, CBS in collaboration with MoHA, has successfully conducted the listing of all the drug users who were under treatment within the reference period in all Rehab Centers in Nepal. The first phase of the survey especially focused on establishing the Benchmark data for estimation of the HDU in Nepal. In the second phase, CBS has successfully conducted national wide “Current Hard Drug Users survey 2013” started from August 2012 and continued till the March of 2013. 1.2 Survey Objective The primary objective of the survey was to estimate the total number of hard drug users in Nepal and hence to identify pattern and extent of drug use across the country, such as: age, sex, education, age at first drug intake, frequency/duration of drug use, mode of drug use, expenses made on drug and the perception of drug users towards the Government etc.
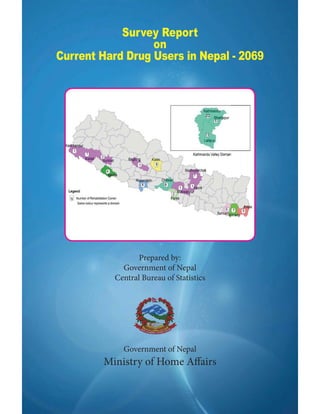
- 10. – 3 – Chapter 2: Methodology 2.1 Study Area Study area comprises 18 districts including 26 municipalities spread over all five development regions of the country. These areas were selected as the domains of study since they are considered as drug affected areas. Table 1: The survey area covering 26 municipalities of the five development regions, 2069 Development Region District Municipality Eastern Jhapa Damak, Mechi, Bhadrapur Morang Biratnagar Sunsari Dharan,Itahari, Inaruwa Central Parsa Birgunj Makwanpur Hetauda Chitwan Bharatpur Lalitpur Lalitpur Sub- metropolitan City
- 11. – 4 – Central Bhaktapur Bhaktapur, Maddhepur Thimi Kathmandu Kathmandu Metropolitan City Kavre Sindhupalchwok Banepa, Dhulikhel, Panauti Western Kaski Lekhanath, Pokhara SMC Rupandehi Baglung Sidarthanagar , Butwal Mid-western Banke Surkhet Nepalgunj Birendranagar Far-western Kanchanpur Bhimdattapanta Municipality Kailali Dhangadhi, Tikapur Total 18 districts 26 Municipalities
- 12. – 5 – +DUG 'UXJ 8VHUV GH¿QHG LQ WKH VXUYH The practice of consuming intoxicants by human beings is prevalent among almost all communities of the world. In Nepal, consumption of some intoxicants such as marijuana (ganja), bhang, alcohol was in practice since a long time. During that time, consumption of these substances was limited to certain sections of the population mainly among holy persons (Jogis) and aged persons; and few consumed these substances on certain festivals like Shivaratri, Holi for pleasure.Suchsubstanceuserswereveryfewatthattime.Thus consumption of intoxicants in old days was not a big social and economic problem in Nepal. However, since last few decades, types and mode of drugs intake have been changed. Beside marijuana, bhang, people started to intake opiates and chemical drugs like Heroin, Nitrazepam, Buprenorphine, etc. Also the mode of drug administration changes from smoking or ingesting to injecting which becomes one of the major causes of HIV infection in Nepal. In this survey, hard drugs include all form of synthetic opiates and chemical substances that are treated as illicit drugs by law (e.g. Cocaine, Heroin, LSD, Morphine, Buprenorphine, Propoxyphene etc.). Also, those who inhale adhesive substances like dendrite are also considered as drug users. Those who consume only marijuana and alcohol are not within the scope of the survey. However, for the survey purpose, a person consuming marijuana or alcohol with at least one of the other hard drugs such as Cocaine, Heroine, LSD or medical drugs etc is treated as drug user.
- 13. – 6 – 2.3. Data Source and Sample Size Usual survey methodology (general household/population survey) is not recommended to estimate the prevalence of hard-to-reach hidden population such as hard drug users, commercial sex workers, homeless people etc. for some reasons. Sampling frame is not usually available and also very difficult or impossible to construct. Due to the low prevalence rate as compared to the total population it may require larger sample size and relatively more resources. More importantly, respondents may not be willing to respond because of the sensitivity of the topic itself. Such biases usually result in an underestimation of the population size under study. Hence an alternative approach of estimation technique has to be used to get the most reliable picture of the real situation. For this, we have selected the Multiplier Method of indirect estimation technique that was also used in the previous survey 2063. The multiplier method has two elements in common: the benchmark and the multiplier. The benchmark (B) is the data source that captures the number of hard drug users who are under treatment in the rehabilitation centers in the reference year. The multiplier (M) is an estimate of the proportion of current hard drug users who have experienced the event recorded by the benchmark, i.e. the proportion of such drug users who have been in treatment in the rehabilitation centers in the reference period. This information is obtained independently of the benchmark data. The inverse of that proportion is the multiplier (M), which is an indirect estimate of the proportion
- 14. – 7 – of the total population of the hard drug users represented in the benchmark data. The total number is calculated by multiplying the benchmark by the multiplier (B x M). Hence, N = B x M = B x (1/p) where, N is the total number of hard drug users, p is the proportion of the hard drug users who have visited the rehabilitation centers in the reference period. Data source: For the benchmark data, complete listing of all hard drug users under treatment, excluding marijuana users only or alcohol users only, in all rehabilitation centers operated in Nepal within the reference period were collected. For the multiplier data, current hard drug users were sampled and interviewed from each of the selected spots within the selected areas. With the help of the outreach workers of the rehabilitation centers, it was possible to reach the current hard drug users in the spot and interviewed. Sample size: In each of the selected area, sample size for the interview with current hard drug users were fixed at 105 respondents. This number is derived with following assumptions. Estimated proportion of drug users visiting rehabilitation centers = 7.5%
- 15. – 8 – Margin of error in estimation = 5% and Level of confidence = 95% The total achieved sample size was 1365. 2.4. Reference Period of the Survey The reference period of the survey was Baishakh 1, 2068 to Jeshtha32, 2069. 2.5 Limitation of the survey It is assumed that hard drugs are supplied or available mostly in urban areas and so, urban areas and the vicinity are affected most. This is an exhaustive study which included only 4% women interviews out of 1365 interviews. This is more likely due to the higher level of stigma associated with drug use by women. For some reasons, in some cases gender comparison may not be meaningful as the survey was largely dominated by male drug users. Based on the limited data available for women respondents, the number of women drug users is calculated by looking at the composition of male and female in their respective drug users groups, sex ratio of drug users in previous survey, and current sex ratio.
- 16. – 9 – Chapter 3: Demographic Characteristics This chapter comprises of the main findings of the survey, which includes the estimation of the number of current hard drug users by sex for Nepal. The chapter also looks into drug use pattern and extent of drug use in the country among different demographic groups. 3.1 Estimated Number of current hard drug users: Data from 2063 and 2069 Current Hard Drug Users (CHDU) Survey both carried out by the CBS with collaboration of the Ministry of Home Affairs are shown here to visualize the trend in the number of hard drug users in Nepal during last 6 years periods. HDU number has dramatically increased in Nepal between these two survey periods. The results of this survey showed that there are altogether 91,534 current drug users in 2069 which is nearly a double of 46,309 in 2063. It is increased by about 98% over the course of 6 years. The annual growth rate is 11.36%. As expected from previous survey, an overwhelming majority of drug users are males. That is 85,204 (93.1%) accounted to male and 6,330 (6.9%) accounted to female as shown in the below Table. The highest number of the drug users are found in Kathmandu valley (36,998) followed by Sunsari: 7,407; Kaski: 6917; Morang: 6415; Jhapa: 6008; Rupandehi: 5997; Chitawan: 4515 ,Banke: 4050, and Parsa: 2130 The other rest areas constitute 11,097 drug users.
- 17. – 10 – Rehabilitation Center visit rate in the reference year is 7.6 percent. Table 2: Estimated number of current hard drug users, 2069 3.2 Age patterns of drug users: Among the drug users, a very large majority of which happened to be young users. About 70,390 drug users are below the age of 30. The youth 20-24 years accounted for the highest proportion of the current drug users in Nepal, followed by 25-29 years age group. The proportionate distribution comparing with the previous survey is more or less the same.
- 18. – 11 – Figure 1: Percentage age distribution of current drug users $JH DW ¿UVW GUXJ LQWDNH Data reveals that most of the drug users started drug use from the very beginning. Overwhelming majority (95.0%) of the drug users took drug first time in their life before they reach5 25 years. More than three fourth (81.2%) drug users have experience of first time drug intake before they reach 20 years. More than 32 % of drug users they took drug first time in their early age of 15. Figure 2: Percentage distribution of age at first drug intake
- 19. – 12 – 3.4 Marital Status: Nearly two third drug users (65.1%) are unmarried and is followed by currently married (29%). Figure 3: Percentage distribution of marital status of drug users 3.5. Living arrangement of drug users: A more than half drug user (55.5%) are living with their both parents and is followed by living with mother only (20.1%) and step father or mother (11.6%). It is worth noting from the survey that almost very few proportions (0.4%) are living with father only. There is a significant different in numbers between those who are living with mother only (20.1%) and father only (0.4%). It clearly indication that the chance to be involved in drug is very few if her/she is living with father only than those who are living with mother only. Among the interviewed hard drug users, 5.3% reported that there are other members in their families who are also in hard drug use.
- 20. – 13 – Figure 4: Percentage distribution of living arrangement of drug users 3.6 Currently attending school/campus: Among the total drug users, 22% are currently attending schools/campus which is higher than in 2063 (14%) Figure5: Percentage distribution of drug users currently attending school/campus 3.7 Educational status of drug users: Majority (41.9%) of the drug users have some secondary level of education 6-10. Those who have SLC to certificate level of education accounted to 34.2%.
- 21. – 14 – Figure 6: Percentage distribution of educational status of drug users 3.8 Occupational Status of drug users: 29% drug users have no occupation at all. Those who are involved in study only accounted to 21% and majority (50%) have involved in some works. There is no significant different in pattern of drug users in terms of occupational status as compare with the pervious survey, 2063. Figure 7: Percentage distribution of drug users with occupational status 3.9 Hard drug users using household facilities: Respondents were asked about the availability of household facility like Car, Motorcycle, Washing Machine, Micro
- 22. – 15 – oven, Television, Computer, Refrigerator, Telephone, Radio and Internet. Overwhelming majority of drug users (84.5%), they do have TV in their households. More than 70% drug users; they have access to Radio and Telephone. Nearly 30% have access to facility like Computer, Refrigerator and Motorcycle. 21.9% have internet at home. Facility like Car, Washing Machine and Micro Oven are very limited to households. Figure 8: Percentage distribution of household facilities
- 23. – 16 – Chapter 4: Drug Use and Treatment Behavior This chapter deals with drug use pattern and its characteristics along with the treatment behavior. The consequence of drug use is crucial to the society at large so the perception expectations of drug users from the Government and the society itself are also discussed here. 4.1 Type of drug used: Respondents were also asked about the different types of drug they ever intake. Cannabis and Opiates drugs are the most commonly used drugs (90.5% and 93.5% respectively). Of these, 87% drug users prefer Cannabis Ganja whereas 68%, 64% and 55% drug users prefer Herion, Pain Medicine and Cough Syrup respectively. Tranquilizers like diagepam, nitrazepam, dormin accounted to 83.5%. Similarly, inhalants users are 12.7%, Hallucinogens users are 8.7% and small proportion (5.2%) have also experience of Stimulant. Figure 9: Percentage distribution of drug users using different type of drug Note: Percentage are based on multiple responses This survey also reported that more than three fourth (83.2%) hard drug users are poly users i.e. who uses more than one type of drugs.
- 24. – 17 – 4.2 Most common combination of drug categories by current hard drug users: There are more than 83% poly drug users in Nepal. The following table presents the most common combination of drug categories used among the current drug users. The most common combination of drugs tried was Traquilizers (diazepam, nitrazepam, dormin and alprazolam etc) and Ganja (74.1%), followed by Ganja and Heroin (59.9%); Heroin and Tranquilizers (56.6), and Pain Medicine (like Morphine, buprenorphine, propoxyphene) and Tranquilizer (54.4%). This result is obtained from multiple response category so here 74.1 % refers that of the total drug user, 74.1 % uses at least Traquiliziers and Ganja. It is also noted that most of Tranquilizers users used more combination of drug categories compared to other types of drug users. Cannabis, Tranquilizers and Heroin are consumed almost exclusively in Nepal. Table 3: Combination of drug categories by current hard drug users
- 25. – 18 – 4.3 Most Common drugs by age groups: The top three drugs used are Opiate, Tranquilizers and Cannabis. These drug uses are the highest in age group 20- 24 years with 32.6%, 33.9% and 33.6% respectively. On the whole drug users, level of use for Tranquilizer is highest in aged between 20 and 24 years, at 33.9 percent, and those aged between 25 and 29 years, at 22.9 percent. Among the drug users aged between 15 and 19 years, the most commonly used drugs are again Opiates, Tranquilizers and Cannabis, at 19, 20 and 20 percent respectively. Likewise these three drugs are equally popular, about 23 percent to each, amongst age group 25-29 years. For the youngest age group less than 15 of age, cannabis is the most popular and then thereafter Opiates and Tranquilizers. The rest of the drugs, which are very few in use, are not presented here. Figure 10: Percentage distribution of common drugs vs age groups 4.4 Number of years drug intake: The average years that has been spend in taking drug is 5.2 years. Total number of years that have been spending by the current drug users in taking drugs ranges from less than one
- 26. – 19 – year to 20 years. Those who spend up to five years accounted to 67.6%, 6-8 years 16%, 9-11 years 8.6%, and 12 years and above 9.8%. Figure 11: Percentage distribution of Number of Years drug taken 4.5 Frequency of drug taken per day: Majority of drug users (38.4%) are taking drug at least twice a day. Those who take drug more than two times a day accounted to 32.9%. Similarly, drug taking only once or less a day accounted to 28.8%. Figure 12: Percentage distribution of drug taken per day
- 27. – 20 – 4.6 Amount spends for a single dose of drug: An average amount expense by the drug users for a single dose is NRs. 160. Nearly 85 % of drug users spend NRs 100 to NRs 200 per dose of drug. Those who spend NRs 51 to NRs 100 per dose of drug is accounted to 24.2%. Drug users spending more than NRs 200 are also in significant number (10.1%). The amount spent for a single dose of hard drug is somehow symmetrically distributed with average value being NRs. 160. The cost per dose has been spending by the current hard drug users ranges from NRs 5 to NRs 600. Figure 13: Percentage distribution of Amount spend (in NRs) for a single dose 4.7 Source of drug: Users are getting drugs from more than one source. Majority of them (70.1%) reported that they are getting drugs through drug user friends. Followed by this, 30.7% reported mobile drug seller and 28.4% medical store. A large chunk of drug users (30.2%) mentioned the category “others” means they are from boarder districts and are getting drug through Indian boarder sides.
- 28. – 21 – Figure 14: Percentage distribution of drug users using different sources Note: Percentage are based on multiple responses 4.8 Mode of drug intake: Among the total drug users, 57% (52,174) are IDUs and among them 13% shared needles with someone else. There is a remarkable decreased in the percentage of drug users who shared needles comparing with the previous survey in 2063(29%). Figure 15: Percentage distribution of injecting drug users
- 29. – 22 – 4.9 Source of getting Injection: More than half of drug users they get the injection from institute like drop-in centers. 37% of them buy injection themselves. Very few get it from friends and others. Figure 16: Percentage distribution of source of getting Injection 4.10 Reasons of drug intake: It is noteworthy that more common reasons for initiation of drug use could be seen as pull factor because of perceived positive outcomes of drug use. For instance, majority of drug users reported reasons like curiosity or experimentation, for fun or peer pressure for initiation of drug use. In contrast, perhaps surprisingly, only small minorities reported reasons like family problem, study problem and others. Peer pressure is the major cause reported for drug intake (78.7%). Curiosity accounted to 58.5% and family problem 19.9%. Note that multiple responses were given by the respondents for reasons behind drug intake.
- 30. – 23 – Figure 17: Percentage distribution of drug users with different reasons of drug intake Note: Percentage is based on multiple responses. 4.11 Voice of drug users: Respondents were asked: what government can do to enhance their life? Multiple responses were given by them. Majority of them (40.1%) reported that the government should provide employment opportunity for the drug users. Following this 30.1% reported free treatment facility and 18.4% reported positive attitude of the society. Figure 18: Percentage distribution of respondent’s demand from Government Note: Percentage is based on multiple responses
- 31. – 24 – 4.12 Perception of drug users to control drug use in the country: Respondents were also asked: what government can do to control the drug use in the country? Multiple responses accumulates that 35.5% reported that government should control the Indian boarder strictly for the import of drug in the country. Following this 19.7% reported to control of mobile drug seller, 16.6% reported awareness campaigning. Few of them suggested that the Government should monitor the medical store and follow the law. Figure 19: Percentage distribution of the perceptions of respondent to control drug use 4.13 Ever tried to stop drug taking habit: Of the total interviewed drug users, 81.8% have tried to stop drug taking habit at least once in their life span of time. Three forth of them have tried to escape from drug by self courage whereas 40% of them have tried for treatment at least once in Rehab Centre. The mean number of times that has been trying by the current drug users in stopping drug habit is 3. Without conducive environment in the society,
- 32. – 25 – stopping drug habit is very hard which lead again them into the vicious circle of the drug world. Figure 20: Percentage distribution of different means for stopping drug habit Note: Percentage are based on multiple responses
- 33. – 26 – Chapter 4: Summary Over the last six years, current hard drug users have significantly increased from 46,310 (2063) to 91,534(2069) in Nepal, a very large majority of which happen to be young people. Most of the drug users started drug use very early before they reach 20. Only 50% of drug users have some works. Opiates, cannabis and tranquilizers are the most popular drug in Nepal. An average cost for a single does of drug is NRs 160 which was NRs 150 in 2063. Injecting is again the main mode of drug administration. Peer pressure and curiosity are the main pulling factor for initiation of first time drug use. Majority of the drug users have demand for getting employment opportunity and free treatment center from the Government to enhance their life and thereby quitting the drug taking habit. To overcome the problem of drug use in Nepal suggested by users is to give the prime attention to Indian boarder where trafficking routes are active and drug mobility is highest. The consequence of drug use is critical for both drug users and society at large so a collective effort is the need of today.
- 34. – 27 – Summary Table of Findings Current Hard Drug Users Survey, Nepal 2069 Major Findings Value Number of Current Hard Drug Users (Note: Marijuana users only or alcohol user Total Male Female 91534 85204 6330 only are excluded here) Average Annual Rate of Change(2063-069) Total 11.36 Percent Age of Drug User Mean 25.07 Years Minimum 13 Years Maximum 50 years $JH DW ¿UVW GUXJ intake Mean 17.2 years Minimum 10 Years Maximum 45 Years Marital Status Never Married 65.1 Percent Currently Married 29.1 Percent Widow/Widower 0.4 Percent Divorced/Separated 5.4 Percent Educational Status Illiterate/informal education 6.3 Percent
- 35. – 28 – Primary 1-5 15.9 Percent Secondary 6-10 41.9 Percent SLC/Certificate 34.2 Percent Bachelor above 1.7 Percent Occupational Status With Some Work 50.1 Percent Student Only 21.2 Percent No Occupation 28.7 Percent Household Facilities Television 84.5 Percent (Multiple Responses) Telephone 79.4 Percent Radio 75.3 Percent Refrigerator 34.7 Percent Motorcycle 32.2 Percent Computer 29.6 Percent Internet 21.9 percent Micro- oven 6.4 Percent Washing Machine 5.0 percent Car 2.8 Percent 0DMRU ¿QGLQJV Value Type of drug use Cannabis Users 90.5 Percent (Multiple Responses) Opiates Users 93.5 percent Tranquilizers 83.5 Percent Inhalants 12.7 Percent Hallucinogens 8.7 Percent Stimulant 5.2 Percent Others 1.2 Percent Number of Years drug intake 0-2 Years 31.3 Percent
- 36. – 29 – 3-5 Years 34.3 Percent 6-8 Years 16.0 Percent 9-11 years 8.6 Percent 12 above Years 9.8 Percent Frequency of drug taken per day Once or less 28.8 Percent Twice 38.4 Percent Thrice 22.6 Percent Above three times 10.3 Percent Amount Spent for single dose of drug Less than NRs. 50 4.3 Percent NRs. 51-100 24.2 Percent NRs. 101-150 26.2 Percent NRs. 151-200 35.1 Percent NRs. 201-250 8.7 Percent NRs. 251-300 0.2 percent Above NRs. 300 1.2 Percent Source of drug Drug User Friends 70.1 Percent (Multiple Responses) Mobile Drug Seller 30.7 Percent Medical Store 28.4 percent Others 30.2 Percent Mode of drug intake Injection 56.6 Percent Oral 43.4 Percent Reasons of drug intake Peer Pressure 78.7 Percent (Multiple Responses) Curiosity 58.5 Percent
- 37. – 30 – Family Problem 19.9 percent Other Problem 13.8 Percent Study Problem 4.2 percent 0DMRU ¿QGLQJV Value Voice of Drug users Employment Opportunity 40.1 Percent (Multiple Responses) Free treatment 30.1 Percent Positive attitude of the society 18.4 Percent Skilled training opportunity 4.6 Percent Not to allow drug in the country 3.1 Percent Perception of drug user for the control of drug use Control the Indian boarder side 35.5 Percent (Multiple Responses) Control mobile drug seller 19.7 Percent Awareness Program 16.6 Percent Follow the law 13.6 Percent Monitoring the medical store 12.2 Percent Monitoring the paint shop 1.0 Percent
- 38. – 31 – Annexes List of Rehabilitation centers visited S.N. Name 1 Happy Nepal Female Centre,Jhapa 2 Sunrise Community Service Centre,Jhapa 3 Naya Aasa Pratisthan, Jhapa 4 Lifeline Help Group, Jhapa 5 Happy Nepal Punarsthapana Kendra, Jhapa 6 Jeeban Bachau Sewa Kendra, Morang 7 Canmas Punarsthapana Kendra,Morang 8 Richmond Fellowship Nepal,Morang 9 Samudaik Punarsthapana Kendra, Morang 10 Navajyoti Punarsthapana Kendra, Morang 11 New Life Fellowship, Morang 12 Inlise Ten Life Prop Nepal, Morang 13 Mukti Kendra, Sunsari 14 Sajjibani Sudhar Kendra, Sunsari 15 Jagaran Aarogya Samuha, Sunsari 16 Aastha Foundation, Sunsari 17 New Horizon Center, Sunsari 18 KYC Punarjeevan Kendra, Sunsari 19 Vidyarthi Jagaran Manch,Parsa 20 Paribartan Nepal, Parsa 21 Youth Vision Nepal, Mankwanpur 22 Yekta Nepal, Chitwan 23 Sunaulo Bihani, Chitwan 24 Sports and Care Punarsthapana Kendra, Chitwan
- 39. – 32 – 25 Shrada Nepal,Chitwan 26 Miracal Foundation, Chitwan 27 Punarsthapanako Yatra,Chitwan 28 Wisdom Rehabitation Center, Rupandehi 29 Lumbini Lagu Aaushad, Rupandehi 30 United Nepal Foundation Lumbini, Rupandehi 31 Youth Vision Bhairawa, Rupandehi 32 Tewa Samuha 2066,Rupandehi 33 Namuna Lagupadartha Paramarsha Upachar Tatha Punarsthapana Kendra,Rupandehi 34 Prerana Punarsthapana kendra, Banke 35 Nawakiran Punarsthapana Kendra, Banke 36 Paribartan Samuha Punarsthapana Kendra, Banke 37 Mukti Punarsthapana Kendra, Banke 38 Sans Punarsthapana Kendra, Surkhet 39 Bhairab Yuba, Surkhet 40 Richmond Fellowship Nepal, Kailali 41 Punarjeeban Kendra Nepal, Kanchanpur 42 Punah Yekta Nepal Punarsthapana Kendra, Sindhupalchok 43 Hip Foundation Nepal Punarsthpana Kendra,Karve 44 Suruwat Lagu Aausadh Punarsthapana Kendra,Bhaktapur 45 Naya BihaniSudhar Kendra, Bhaktapur 46 Punar Chetana Aabhiyan Nepal, Bhaktapur 47 Aafno Nepal Sudhar Kendra, Bhaktapur 48 Bhaktapur Upachar Tatha Punarsthapana Kendra, Bhaktapur 49 New Vision Nepal, Kaski 50 Naulo Ghumti Nepal, Kaski
- 40. – 33 – 51 Save the Life Richmond Fellowship, Kaski 52 Gateway Foundation Nepal, Kaski 53 Navajeevan Mahila Punarsthapana Kendra, Kaski 54 Richmond Fellowship, Kaski 55 Freedom Center, Lalitpur 56 Bounce Bayak Nepal, Lalitpur 57 Clean Vision Upachar Tatha Punarsthapana Kendra, Lalitpur 58 Sunaulo Dhoka Upachar Tatha Punarsthapana Kendra, Lalitpur 59 Aabhas Samuha, Lalitpur 60 Bikalpa Foundation Nepal, Lalitpur 61 Prasaya Samudayak Punarsthapana Kendra, Lalitpur 62 Durbeshan Roktham Sewa Kendra, Lalitpur 63 Sangati Brihatar Sewa Kendra, Lalitpur 64 Prarambha Tatha Punarsthapana Kendra, Lalitpur 65 Aarambha Nepal, Lalitpur 66 Nirnaya Lagu Aausadh Tatha Madhyapan Upachar Kendra, Lalitpur 67 Maya Nepal Lagu Aausadh Tatha Punarsthapana Kendra, Lalitpur 68 Youth Vision Drug Treatment and Rehabilitation Center,Kathmandu 69 Aasara Sudhar Kedra, Kathmandu 70 Aalkapuri Punarsthapana Tatha Aawasiya Upachar Kendra, Kathmandu 71 Sahara Nepal, Kathmandu 72 Clean Nepal, Kathmandu 73 Upakar Nepal Sudhar Kendra, Kathmandu 74 The Recovering Group, Kathmandu
- 41. – 34 – 75 Hamro Mitrata,Kathmandu 76 Nawadaya, Kathmandu 77 Nawa Upakar Nepal Sudhar Kendra, Kathmandu 78 Jeebanko Sidhhanta, Kathmandu 79 Nawakiran Punarsthapana Kendra, Kathmandu 80 Tranformation Nepal,Kathmandu 81 Hope Foundation, Kathmandu 82 Dibyajyoti Lagu Padartha Roktham Tatha Punarsthapana Kendra, Kathmandu 83 Sovar Rekovery, Kathmandu 84 Richmond Fellowship Nepal, Kathmandu 85 Narkonan Nepal, Kathmandu 86 Nayajeevan Punarsthapana Kendra, Kathmandu 87 Aasha Bhawan, Kathmandu 88 Pratham Paila, Kathmandu 89 Punarjeevan Yuba Samuha, Kathmandu 90 Navajeevan Punarsthapana Kendra, Baglung
- 42. – 35 – Main Questionnaire g]kfn ;/sf/ /fli6««o of]hgf cfof]usf] ;lrjfno s]Gb|Lo tYofÍ ljefu nfu' cf}ifw k|of]ustf{ ;j]{If0f @)^( -nfu' cf}ifwf k|of]uul//x]sfx?sf] nflu_ s= kl/rofTds ljj/0f != pQ/bftfsf] gfd y/ M– ====================================================================================================== @= 7]ufgf M– @=!= lhNnf M– ========================== @=@ uf=lj=;=÷g=kf= M– ===================== #= pd]/ M– ================== jif{ $= lnË M– != k'?if @= dlxnf %= hft÷hflt M– ============================ ^= k]zf÷Joj;fo M– ============================== = wd{ M– != lxGb' @= af}4 #= d'l:nd $= lqmlZrog %= cGo -v'nfpg]_================= *= j}jflxs l:ytL M– != cljjflxt @= xfn ljjflxt #= ljwjf÷ljw'/ $= 5'l§Psf]
- 43. – 36 – %= kf/kfr's] (= tkfO{n] plQ0f{ u/]sf] dflyNnf] z}lIfs tx s'g xf] ============================== -n]vk9 ug{ ghfg]sf] eP ) cyjf cgf}krfl/s lzIf dfq ePdf (( n]vL kfl/jfl/s ljj/0fdf hfg] _ !)= tkfO{ xfn :s'n÷SofDk; uO{/xg' ePsf] 5 != 5 @= 5}g v= kfl/jfl/s ljj/0f != tkfO{sf] kl/jf/ s:tf] lsl;dsf] xf] != Psn @= ;+o'Qm @= tkfO{ kl/jf/sf] Ps dfq 5f]/f÷5f]/L xf] != xf] @= xf]O{g #= tkfO{ sf] ;Fu a:g'ePsf] 5 != afa' cfdf @= cfdf #= a'af $= a'af / ;f}t]lg cfdf %= cfdf / ;f}t]lg a'jf ^= Ldfg÷Ldlt = cGo gft]bf/ *= cGo -v'nfpg]_ ============== $= tkfO{sf] kl/jf/df lgDg ;fdfgx? s] s] 5g qm=;+= ;fdfgsf] ljj/0f 5 ÷ 5}g ! /]l8of] != 5 @= 5}g @ 6]lnlehg != 5 @= 5}g # /]lk|mh/]6/ != 5 @= 5}g $ 6]lnkmf]g != 5 @= 5}g % sDKo6/ != 5 @= 5}g ^ dfOqmf] cf]eg != 5 @= 5}g jfl;8= d]lzg != 5 @= 5}g * sf/ != 5 @= 5}g ( df]6/;fOsn != 5 @= 5}g
- 44. – 37 – %= tkfO{sf] kl/jf/df Internet ;'ljwf 5 ! 5 @ 5}g u= nfu' cf}ifwsf] k|of]u ;DaGwL ljj/0f != tkfO{n] s'g s'g nfu' cf}ifw k|of]u ug'{ x'G5 -ax'pQ/ ;Dej_ Cannabis 11 Bhang 12 Charas 13 Ganja 14 Sulfa Opiates 21 Opium 22 Heroin (brown sugar, smack etc) 23 Cough syrup (corex, phensedyl etc.) 24 Pain medicines (propoxyphene darvon, proxyvon, buprenorphine tidigesic, pethidine, morphine, pentazocine , fortwin etc) Tranquilizers 31 (diazepam valium, calmpose, nitrazepam nitravet, dormin, nitrosun alprazolam alprax) Inhalants 41 (dendrite, paint thinner, varnish, petrol etc) Hallucinogens 51 (LSD, acid, Ketamine, etc) Stimulants 61 (Cocaine, amphetamines etc) Others (please specify) ………………………………..........
- 45. – 38 – @= tkfO{n] nfu' cf}ifw s;/L k|fKt ug'{ x'G5 -ax'pQ/ ;Dej_ != nfu' cf}ifw k|of]u ug]{ ;fyLefO{sf] dfWodaf6 @= 8'nGt] ljqm]tfaf6 #=cf}ifwL k;naf6 $= cGo-v'nfpg]_ ================== #= tkfO{n] nfu' cf}ifw lng ;'O{sf] k|of]u ug'{x'G5 != u5'{ @= ulb{g -k|Zg g+= df hfg'xf];_ $= tkfO{n] hDdf hDdL slt jif{ ;'O{sf] k|of]u u/L nfu' cf}ifw lng'eof] ============jif{ %= cS;/ ;'O{ sFxf af6 k|fKt ug'{x'G5 != cfkm} lsGg] @= ;+3 ;+:yf af6 pknAw u/fpg] #= ;fyLefO{ ;Fu lng] $= cGo -v'nfpg]_ ========================= ^= ;fyLefO{ aLr ;'O{ ;f6f;f6 ug'{x'G5 != ub{5f} @= ub}{gf} = nfu' cf}ifw lbgdf ;/b/ slt k6s k|of]u ug'{x'G5 =========k6s *= tkfO{n] k|of]u ug]{ u/]sf] nfu' cf}ifw Ps k6s k|of]u ug{ ;/b/ slt k};f vr{ ug'{x'G5 ?= =============== (= tkfO{n] Ps} lsl;dsf] jf Ps eGbf a9L lsl;dsf] nfu' cf}ifw k|of] u ug'{x'G5 != Ps lsl;dsf] dfq @= Ps eGbf a9L !)= klxnf] k6s nfu' cf}ifw ;]jg ubf{ tkfOsf] pd]/ slt lyof] ========jif{ !!= tkfO{n] lgoldt ?kdf nfu' cf}ifw ;]jg ug{ yfn]sf] slt jif{ eof] =========jif{ !@= tkfO{n] nfu' cf}ifw k|of]u ug'{sf] sf/0f s] s] x'g -ax'pQ/ ;Dej_ != sf}t'xntf÷pT;'stf @= ;fyLefO{sf] nxnx}df
- 46. – 39 – #= k9fOsf] af]em af6 xNsf x'g $= kfl/jfl/s ;d:ofaf6 %= cGo -v'nfpg]_============== !#= tkfO{sf] kl/jf/df nfu' cf}ifw k|of]u ug]{ c? klg sf]xL 5g != 5g @= 5}gg !$= tkfO{ ;+nUg nfu' cf}ifw ;]jg ug]{ ;dxdf slt hgf x'g'x'G5 hDdf ========== k'?if============== dlxnf =========== 3= pkrf/ ;DaGwL ljj/0f != s] tkfO{n] nfu' cf}ifw k|of]u ug{ 5f]8g] k|of; ug'{ePsf] lyof] != lyof] @= lyPg @= olb lyof] eg] s:tf] k|of; ug'{ePsf] lyof] != k'g{:yfkg s]Gb| @=c:ktfn÷8fS6/ #=cfˆg} cfTdann] 5f]8g] k|of; u/]sf] $=cGo -v'nfpg]_ ========================= #= slt k6s k|of; ug'{ePsf] lyof] k6s =========== $= ljut a}zfv !, @)^* b]lv h]i7 #@, @)^( ;Dd s'g} k'g{:yfkg s] Gb|df pkrf/ u/fpg' ePsf] lyof] != lyof] @= lyPg -olb lyPg eg] k|Zg g+= df hfg'xf]; . %= olb lyof] eg] slt k6s tkfO{n] k'g{:yfkg s]Gb|df pkrf/ u/fpg' eof] k6s ===================
- 47. – 40 – ^= pkrf/sf] nflu sxfF hfg'ePsf] lyof] k'g{:yfkg s]Gbsf] gfd 7]ufgf = nfu' cf}ifwsf] k|of]u sd u/fpg tkfOsf] ljrf/df ;/sf/n] s:tf] sbd rfNg' kg]{ h:tf] nfU5 -a9Ldf # j6f pQ/ lbg'xf];_ ================================================ =============================================== ============================================= *= tkfO{sf] ljrf/df nfu' cf}ifw k|of]ustf{sf] hLjg ;'wf/sf] nflu ;/ sf/n] s] ug'{ knf{ -a9Ldf # j6f pQ/ lbg'xf]; . _ ============================================ =========================================== =============================================
- 48. – 41 – Listing Form g]kfn ;/sf/ /fli6«o of]hgf cfof]usf] ;lrjfno s]Gb||Lo tYofÍ ljefu Nffu' cf}ifw k|of]ustf{ ;j]{If0f — @)^( Nffu' cf}ifw pkrf/ tyf k'g:yf{kgf s]Gb|df pkrf/ ;]jf lnPsf jf lnO/x]sf AolQmx?sf] ;rL -;Gbe{ cjlwM @)^*÷)!÷)! b]lv @)^(÷)@÷#@_ k'g:yf{kgf s]Gbsf] gfdM================================================================ :yfkgfM================================================================= pkrf/ ;]jfsf] IfdtfM======================================================================= lhNnfM==================================================================== g=kf=÷uf=lj=;=M================================================================================================= j8f g+=M================================================================== ;Dks{ AolQmM================================================================================================ ;Dks{ g+M======================================================= u0fssf] gfdM=============================================================================================== ;Gbe{ cjlwdf ;]jf lnPsf hDdf AolQm ;+VofM============================================ xfn ;]jf lnO/x]sf hDdf AolQm ;+VofM======================================================================= s|= ;+= gfd pd]/ lnË 7]ufgf -lhNnf, g=kf=÷uf=lj=;=, j8f g+=_ egf{ ePsf] ldlt -;fn ÷dlxgf÷ ut]_ l8:rfh{ePsf] jf 5f]8]sf] ldlt -;fn ÷dlxgf÷ ut]_ -pkrf//t ePdf Æ–æ n]Vg]_ o;df ;Íng ul/Psf ljj/0fx? tYofÍ P]g, @)!% adf]lhd uf]Ko /flvg]5 . oL ljj/0fx? tYofÍLo k|of]hgsfnflu JolStut uf]kgLotf sfodu/L ;fdlxs?kdf dfq k|of]u ul/g]5 .
- 49. – 42 – Acronyms CHDU - Current Hard Drug Users CBS - Central Bureau of Statistics HIV - Human Immune Virus HDU - Hard Drug Users IDUs - Injecting Drug Users LSD - Lysergic Acid Diethylamide MoHA - Ministry of Home Affairs NRs - Nepali Rupees SLC - School Leaving Certificate TV - Television Rehab Center - Rehabilitation Center
- 50. – 43 –
- 51. – 44 – Make health your 'new high' in life, not drugs