SlideShare a Scribd company logo
1 of 278
Download to read offline
Technical Assistance Consultant’s Final Report
This consultant’s report does not necessarily reflect the views of ADB or the Government concerned, and
ADB and the Government cannot be held liable for its contents. (For project preparatory technical
assistance: All the views expressed herein may not be incorporated into the proposed project’s design.
Project Number: 43295
December 2011
Socialist Republic of Viet Nam: Climate Change
Impact and Adaptation Study in the Mekong Delta
(Cofinanced by the Climate Change Fund and the Government of
Australia)
Prepared by Peter Mackay and Michael Russell
Sinclair Knight Merz (SKM)
Melbourne, Australia
For Vietnam Institute of Meteorology, Hydrology and Environment (IMHEN), the Ca Mau
Peoples Committee and the Kien Giang Peoples Committee
Ca Mau Peoples
Committee
Institute of Meteorology,
Hydrology and
Environment
Climate Change Impact
and
Adaptation Study
in
The Mekong Delta – Part A
Final Report
Kien Giang Peoples
Committee
Climate Change
Vulnerability & Risk
Assessment Study for
Ca Mau and Kien Giang
Provinces, Vietnam
Ca Mau
Peoples
Committee
Kien Giang
Peoples
Committee
Institute of Meteorology,
Hydrology and Environment
Climate Change Impact and Adaptation Study
in The Mekong Delta – Part A
Final Report
Climate Change Vulnerability & Risk Assessment
Study for Ca Mau and Kien Giang Provinces,
Vietnam
December 2011
Climate Change Impact and Adaptation Study in Mekong Delta – Part A
PAGE i
FOREWORD
Climate Change Impact and Adaptation Study in Mekong Delta – Part A
PAGE i
CONTENTS
ABBREVIATIONS AND ACRONYMS ........................................................................................................... VII
KEY TERMS.................................................................................................................................................IX
EXECUTIVE SUMMARY ................................................................................................................................X
1. INTRODUCTION ..................................................................................................................................1
1.1 PURPOSE OF THIS STUDY .........................................................................................................................1
1.2 THE REGIONAL CONTEXT.........................................................................................................................1
1.2.1 The Mekong Delta ........................................................................................................................3
1.2.2 Socio-Economic Context ...............................................................................................................4
1.2.3 Sectoral Growth and Diversification.............................................................................................4
1.2.4 The Agriculture Sector ..................................................................................................................6
1.2.5 Industry Sector..............................................................................................................................7
1.2.6 Energy Sector................................................................................................................................8
1.2.7 Urban Settlements........................................................................................................................9
1.2.8 Transport ......................................................................................................................................9
2. CVRA APPROACH AND METHODOLOGY............................................................................................11
2.1 CONCEPTUAL FRAMEWORK ...................................................................................................................11
2.2 EVALUATING VULNERABILITIES ...............................................................................................................13
2.2.1 Key Sectors .................................................................................................................................14
2.2.2 Vulnerability Indicators ..............................................................................................................15
2.2.3 Analysing Adaptive Capacity ......................................................................................................18
2.2.4 Control Measures .......................................................................................................................19
2.2.5 Vulnerability Profiles ..................................................................................................................20
2.2.6 Mapping Vulnerability................................................................................................................21
2.2.7 The Adaptation Assessment Process ..........................................................................................22
2.3 IDENTIFYING AND ANALYSING FUTURE RISK ..............................................................................................24
3. CLIMATE CHANGE.............................................................................................................................28
3.1 CLIMATE IN THE MEKONG DELTA............................................................................................................28
3.1.1 Observed Changes......................................................................................................................28
3.2 GLOBAL CLIMATE CHANGE ....................................................................................................................34
3.2.1 Climate Change and Emission Scenarios ....................................................................................34
3.3 CLIMATE MODELS AND DOWNSCALING....................................................................................................35
3.3.1 Modelling used in the Project.....................................................................................................36
3.4 FUTURE CLIMATE CHANGE SCENARIOS (2030 AND 2050) ..........................................................................40
3.4.1 Temperature...............................................................................................................................40
3.4.2 Rainfall .......................................................................................................................................41
3.4.3 Sea Level Rise..............................................................................................................................43
3.4.4 Wind Speed.................................................................................................................................44
3.4.5 Other Climatic Factors................................................................................................................44
3.4.6 Model Discrepancies...................................................................................................................45
3.5 CLIMATE CHANGE IMPACT ASSESSMENTS ..................................................................................................45
3.5.1 Hydrology and water resources..................................................................................................45
3.5.2 Coastal impacts ..........................................................................................................................46
4. CA MAU PROVINCE...........................................................................................................................47
4.1 POPULATION AND PEOPLE .....................................................................................................................47
4.1.1 Socially Vulnerable Groups.........................................................................................................51
4.1.2 Poverty Incidence .......................................................................................................................52
4.1.3 Unemployment...........................................................................................................................53
4.1.4 Health.........................................................................................................................................53
Climate Change Impact and Adaptation Study in Mekong Delta – Part A
PAGE ii
4.1.5 Education....................................................................................................................................55
4.2 PROVINCIAL DEVELOPMENT CONTEXT......................................................................................................56
4.3 LANDUSE ...........................................................................................................................................57
4.4 AGRICULTURE .....................................................................................................................................59
4.4.1 Cropping and Livestock...............................................................................................................59
4.4.2 Aquaculture................................................................................................................................60
4.4.3 Fisheries......................................................................................................................................61
4.4.4 Water resources .........................................................................................................................62
4.4.5 Natural areas, biodiversity and forests ......................................................................................62
4.5 INDUSTRY...........................................................................................................................................63
4.5.1 Seafood Processing.....................................................................................................................63
4.5.2 Ship Building...............................................................................................................................64
4.5.3 Other Industrial Sectors..............................................................................................................65
4.5.4 Tourism.......................................................................................................................................66
4.6 ENERGY .............................................................................................................................................67
4.6.1 Ca Mau Gas-Power-Fertilizer Complex.......................................................................................67
4.6.2 Electricity Transmission and Distribution System.......................................................................69
4.6.3 Other Energy Sources .................................................................................................................72
4.7 TRANSPORT SYSTEM.............................................................................................................................73
4.7.1 Roads..........................................................................................................................................76
4.7.2 Airports.......................................................................................................................................76
4.8 URBAN SETTLEMENTS...........................................................................................................................77
4.8.1 Urban Utilities.............................................................................................................................78
5. KIEN GIANG PROVINCE .....................................................................................................................81
5.1 POPULATION AND PEOPLE .....................................................................................................................81
5.1.1 Socially Vulnerable Groups.........................................................................................................86
5.2 PROVINCIAL DEVELOPMENT CONTEXT......................................................................................................90
5.3 LANDUSE ...........................................................................................................................................92
5.4 AGRICULTURE .....................................................................................................................................92
5.4.1 Cropping and Livestock...............................................................................................................94
5.4.2 Aquaculture and Fisheries ..........................................................................................................95
5.4.3 Fisheries......................................................................................................................................96
5.4.4 Water resources .........................................................................................................................98
5.4.5 Natural areas, biodiversity and forests ......................................................................................99
5.5 INDUSTRY.........................................................................................................................................100
5.5.1 Construction Materials Manufacturing....................................................................................101
5.5.2 Seafood Processing...................................................................................................................103
5.5.3 Tourism.....................................................................................................................................104
5.5.4 Other Industries........................................................................................................................104
5.6 ENERGY ...........................................................................................................................................106
5.6.1 Future Plans..............................................................................................................................108
5.7 TRANSPORT ......................................................................................................................................110
5.7.1 Roads and Ports........................................................................................................................111
5.8 URBAN SETTLEMENTS.........................................................................................................................111
5.8.1 Urban Utilities...........................................................................................................................111
5.8.2 Urban Drainage, Sewage Disposal and Solid Waste ................................................................112
6. EFFECTS ON NATURAL SYSTEMS .....................................................................................................114
6.1 THE EFFECTS OF SEA LEVEL RISE ...........................................................................................................114
6.2 THE EFFECTS OF FLOODING AND INUNDATION.........................................................................................114
6.3 THE EFFECTS OF DROUGHT..................................................................................................................123
6.4 EFFECTS OF SALINITY AND SALINE INTRUSION..........................................................................................123
6.5 EFFECTS OF TYPHOONS AND STORM SURGE ............................................................................................128
6.5.1 Exposure to Typhoons...............................................................................................................128
Climate Change Impact and Adaptation Study in Mekong Delta – Part A
PAGE iii
6.5.2 Typhoon Simulations ................................................................................................................130
6.5.3 Storm Surge..............................................................................................................................131
6.6 COASTAL SEDIMENTATION AND EROSION ...............................................................................................132
6.6.2 Effects on Coastal Conditions ...................................................................................................134
6.6.3 Other Effects.............................................................................................................................137
6.7 SYNTHESIS OF THE CLIMATE CHANGE IMPACTS ON NATURAL SYSTEMS.........................................................138
7. VULNERABILITY, RISK AND HOTSPOT ANALYSIS..............................................................................140
7.1 VULNERABILITY..................................................................................................................................140
7.1.1 Population Vulnerability...........................................................................................................141
7.1.2 Poverty Vulnerability ................................................................................................................145
7.1.3 Agriculture and Livelihoods Vulnerability.................................................................................149
7.1.4 Industry and Energy Vulnerability ............................................................................................159
7.1.5 Urban Settlements and Transport Vulnerability.......................................................................166
7.2 RISKS...............................................................................................................................................175
7.2.1 Population; Hotspots................................................................................................................176
7.2.2 Poverty; Hotspots .....................................................................................................................177
7.2.3 Agriculture and Livelihoods; Hotspots......................................................................................178
7.2.4 Industry and Energy Impacts, Hotspots....................................................................................180
7.2.5 Urban Settlements and Transport; Hotspots............................................................................181
7.2.6 Summary of District and Sectoral Hotspots..............................................................................182
7.3 SYNTHESIS OF REGIONAL VULNERABILITIES .............................................................................................184
8. INSTITUTIONAL CAPACITY...............................................................................................................187
8.1 NATIONAL INSTITUTIONS.....................................................................................................................187
8.1.1 Agriculture and Natural Resource Management .....................................................................187
8.1.2 Infrastructure Planning.............................................................................................................188
8.2 NATIONAL PLANS AND PROJECTIONS .....................................................................................................189
8.2.1 The National Target Program...................................................................................................189
8.2.2 Sectoral Plans ...........................................................................................................................190
8.2.3 Disaster management ..............................................................................................................194
8.3 PROVINCIAL DEPARTMENTS .................................................................................................................196
8.3.2 Urban Settlements and Transport ............................................................................................197
8.3.3 Industry and energy sector.......................................................................................................198
8.4 DISTRICT LEVEL .................................................................................................................................200
8.4.1 Agriculture and Livelihood........................................................................................................200
8.4.2 Urban Settlements and Transport ............................................................................................201
8.5 SURVEY RESULTS ...............................................................................................................................201
8.6 LOCAL LEVEL.....................................................................................................................................203
8.7 SUMMARY OF INSTITUTIONAL CAPACITY IN THE AREA OF CLIMATE CHANGE ADAPTATION ..................................204
8.7.1 Measures of Capacity ...............................................................................................................205
9. KEY FINDINGS & RECOMMENDATIONS...........................................................................................207
9.1 CLIMATE CHANGE PROJECTIONS ...........................................................................................................207
9.1.1 Climate parameters..................................................................................................................207
9.1.2 Sea Level Rise & Inundation......................................................................................................207
9.2 VULNERABILITY TO CLIMATE CHANGE ....................................................................................................207
9.2.1 Sea Level Rise & Storm Surge ...................................................................................................208
9.2.2 Increased Damage to Coastal Areas.........................................................................................208
9.2.3 Risks to Population and People ................................................................................................208
9.2.4 Risks to Agriculture and Livelihoods.........................................................................................209
9.2.5 Risks to Urban Settlements & Transport ..................................................................................210
9.2.6 Risks to Industry and Energy.....................................................................................................212
9.2.7 Uncertainties & Unexpected Events .........................................................................................213
9.3 FUTURE CHALLENGES .........................................................................................................................214
Climate Change Impact and Adaptation Study in Mekong Delta – Part A
PAGE iv
9.4 SUGGESTED ADAPTATION THEMES........................................................................................................214
10. REFERENCES ...............................................................................................................................217
11. APPENDICES ...............................................................................................................................221
APPENDIX 1. SUGGESTED VULNERABILITY INDICATORS AS RECOMMENDED BY INTERNATIONAL EXPERTS. .........................221
APPENDIX 2. SUMMARY CLIMATE VULNERABILITY ASSESSMENT – INDUSTRY ASSETS ...................................................224
APPENDIX 3. SUMMARY CLIMATE VULNERABILITY ASSESSMENT – ENERGY ASSETS......................................................225
APPENDIX 4. EXTREME PRECIPITATION EVENT ANALYSIS BASED ON GCM DAILY DATA...................................................227
APPENDIX 5. DETAILS OF MEETINGS WITH PROVINCE OFFICIALS ..............................................................................231
APPENDIX 6. DETAILS OF WORKSHOP PARTICIPANTS .............................................................................................237
APPENDIX 7. OTHER ADAPTATION PROJECTS IN THE DELTA.....................................................................................239
APPENDIX 8. TA AND CONSULTANT TORS...........................................................................................................242
Climate Change Impact and Adaptation Study in Mekong Delta – Part A
v | P a g e
ACKNOWLEDGEMENTS
The Asian Development Bank (ADB) engaged Sinclair Knight Merz (SKM), in association with the
Center for Environmental Research (CENRE) under the Vietnam Institute of Meteorology, Hydrology
and Environment (IMHEN), Acclimatise and University of Newcastle, Australia to undertake ‘Part A’
of the AusAID funded Climate Change Impact and Adaptation Study in the Mekong Delta (TA
7377 – VIE).
This report presents information from Ca Mau and Kien Giang provinces together with modelling and
GIS outputs from IMHEN. Provincial and district authorities supplied intensive survey data and made
staff available for interviews. The Kien Giang PPC and the Ca Mau PPC and district departments
contributed to the inception and mid project workshops. The department of DARD in Ca Mau and the
Departments of DARD and DONRE in Kien Giang allocated contact persons who organized data and
accompanied team members on trips to visit key locations/projects relating to the subject of the
working paper.
The report was compiled by Peter Mackay and Michael Russell and relies heavily on working papers
produced by the international assessment experts. The report represents a considerable effort from a
dedicated team:
Peter Mackay Team Leader SKM
Duong Hong Son Deputy Team Leader IMHEN
Michael Russell CC Assessment Specialist (Agriculture & Natural Resources) ;
Data Coordinator; Atlas Editor
SKM
Hoang Minh Tuyen CC Assessment Specialist (Agriculture & Natural Resources) IMHEN
Hoang Duc Cuong Climate Change Prediction Modeller IMHEN
Dam Duy Hung Climate Change Prediction Modeller IMHEN
Anthony Kiem Climate Change Prediction Modeller University of Newcastle
Hoang Van Dai GIS Expert IMHEN
Ian Hamilton CC Assessment Specialist (Transport & Urban Planning) SKM
Dinh Thai Hung CC Assessment Specialist (Transport & Urban Planning) IMHEN
Frank Pool CC Assessment Specialist (Energy & Industry) SKM
Tran Thi Dieu Hang CC Assessment Specialist (Energy & Industry) IMHEN
Ronny Venegas Carbonell CC Assessment Specialist (Socio-Economic Issues) SKM
Ngo Thi Van Anh CC Assessment Specialist (Socio-Economic Issues) IMHEN
Nguyen Thi Hang Nga Secretary IMHEN
Le Ha Phuong Interpreter/Translator IMHEN
Lucinda Phelps Assistant Coordinator SKM
Sonya Sampson SKM Project Manager SKM
Aman Mehta SKM Project Director SKM
Nguyet Mai Administrator IMHEN
Cover Photo; M. Russell.
Climate Change Impact and Adaptation Study in Mekong Delta – Part A
vi | P a g e
DISCLAIMER
This report was prepared by agents on behalf of Vietnam Institute of Meteorology, Hydrology and
Environment (IMHEN), The Ca Mau Peoples Committee and The Kien Giang Peoples Committee
through The Asian Development Bank. Although all effort is made to ensure that the information,
opinions and analysis contained in this document are based on sources believed to be reliable - no
representation, expressed or implied, is made guaranteeing accuracy, completeness or correctness.
The boundaries, colours, denominations, and other information shown on any map in this work do not
imply any judgment on the part of the Authors concerning the legal status of any territory or the
endorsement or acceptance of such boundaries.
Neither Australian Aid; Asian Development Bank; IMHEN; Ca Mau PPC; Kien Giang PPC nor any
agency thereof; their employees; contractors; subcontractors or their employees; assumes any legal
liability or responsibility for the consequences of any third party’s use of the information, opinions
and analysis contained in this report.
Cite as
IMHEN, Ca Mau Peoples Committee, and Kien Giang Peoples Committee (2011). Climate Change
Impact and Adaptation Study in The Mekong Delta – Part A Final Report: Climate Change
Vulnerability and Risk Assessment Study for Ca Mau and Kien Giang Provinces, Vietnam. Institute
of Meteorology, Hydrology and Environment (IMHEN), Hanoi, Vietnam.
Climate Change Impact and Adaptation Study in Mekong Delta – Part A
vii | P a g e
Abbreviations and Acronyms
ADB Asian Development Bank
AusAID Australian Agency for International Development
CCFSC Central Committee for Flood and Storm Control
CENRE Center for Environmental Research (Under IMHEN)
CRU Climate Research Unit
CSIRO Commonwealth Scientific & Industrial Research Organisation (Australia)
DARD Department of Agriculture and Rural Development
DDMFSC Department of Dyke Management and Flood and Storm Control
DOIT Department of Industry and Trade
DONRE Department of Natural Resources and Environment
DoPI Department of Planning and Investment
DOST Department of Science and Technology
DOT Department of Transport
DWRM Department of Water Resource Management
ENSO El Nino-Southern Oscillation
FAO Food and Agriculture Organization
FICEN Fisheries Information Centre
FMMP The MRC’s Flood Management and Mitigation Program
GIS Geographic Information System
GIZ Deutsche Gesellschaft für Internationale Zusammenarbeit
IMHEN Institute of Meteorology, Hydrology and Environment
IPCC Intergovernmental Panel on Climate Change
IRRI International Rice Research Institute
JICA Japanese International Cooperation Agency
MARD Ministry of Agriculture and Rural Development (Viet Nam)
MoC Ministry of Construction
MoF Ministry of Finance
MoFI Ministry of Fisheries
MoIT Ministry of Industry and Trade
MoND Ministry of National Defence
MoNRE Ministry of Natural Resources and Environment
MoST Ministry of Science and Technology
MoT Ministry of Transportation
MPI Ministry of Planning and Investment
MRC Mekong River Commission
MRCS Mekong River Commission Secretariat
MRD Mekong River Delta
NAPA National Adaptation Program of Action.
NCAR National Centre for Atmospheric Research
NCEP National Centre for Environmental Prediction
NTP National Target Program
NWRC National Water Resources Council
PPC People’s Party Committee
Climate Change Impact and Adaptation Study in Mekong Delta – Part A
viii | P a g e
ROMS Regional Oceanographic Modelling System
SKM Sinclair Knight Merz
SLR Sea Level Rise
TA Technical Assistance
UNDP United Nations Development Program
UNIDO United Nations Industrial Development Organisation
VNMC Vietnam National Mekong Committee
VRSAP Vietnam River System and Plains model
WMO World Meteorological Organization
Climate Change Impact and Adaptation Study in Mekong Delta – Part A
ix | P a g e
Key Terms
Adaptation Actions taken in response to actual or projected climate change and impacts that lead to a
reduction in risks or a realization of benefits. A distinction can be made between a planned or
anticipatory approach to adaptation (i.e. risk treatments) and an approach that relies on unplanned
or reactive adjustments.
Adaptive
capacity
The capacity of an organization or system to moderate the risks of climate change or to realise
benefits, through changes in its characteristics or behaviour. Adaptive capacity can be an inherent
property or it could have been developed as a result of previous policy, planning or design decisions
of the organisation.
Climate
change
Climate change refers to a change of climate that is attributed directly or indirectly to human
activity that alters the composition of the global atmosphere and that is in addition to natural
climate variability observed over comparable time periods (United Nations Framework Convention
on Climate Change).
Climate
scenario
A coherent, plausible but often simplified description of a possible future climate (simply, average
weather). A climate scenario should not be viewed as a prediction of the future climate. Rather, it
provides a means of understanding the potential impacts of climate change, and identifying the
potential risks and opportunities created by an uncertain future climate.
Climatic
vulnerability
Climatic vulnerability is defined by the IPCC as “the degree to which a system is susceptible to, and
unable to cope with, adverse effects of climate change, including climate variability and extremes.
Vulnerability is a function of the character, magnitude, and rate of climate change and variation to
which a system is exposed, its sensitivity, and its adaptive capacity”.
Hazard A physically defined source of potential harm, or a situation with a potential for causing harm, in
terms of human injury; damage to health, property, the environment, and other things of value; or
some combination of these.
Mitigation A human intervention to actively reduce the production of greenhouse gas emissions (reducing
energy consumption in transport, construction, at home, at work, etc.), or to remove the
greenhouse gases from the atmosphere (sequestration).
Resilience A measure of the current ability of a community to resist, absorb, and recover from the effects of
hazards, by quickly preserving or restoring its essential basic structures, functions and identity.
Risk Risk is defined in general terms as the product of the frequency (or likelihood) of a particular event
and the consequence of that event, be it in terms of lives lost, financial cost and/or environmental
impact.
Sensitivity Refers to the degree to which a system is affected, either adversely or beneficially, by climate
related variables including means, extremes and variability.
Exposure Defines the likelihood of a community being affected by a hazard. This is determined by GIS
modelling and mapping of the predicted extent of hazards.
Vulnerability Vulnerability is a function of risk and response capacity. It is a combination of the physical
parameter of the hazards and its consequences such as personal injuries, degradation of buildings
and infrastructure and functional perturbations. It may vary depending on non physical factors such
as emergency preparation, education and recovery capacity.
Climate Change Impact and Adaptation Study in Mekong Delta – Part A
x | P a g e
EXECUTIVE SUMMARY
Overview
The Asian Development Bank (ADB) engaged Sinclair Knight Merz (SKM), in association with
Center for Environmental Research (CENRE) under the Vietnam Institute of Meteorology, Hydrology
and Environment (IMHEN), Acclimatise and University of Newcastle, Australia to undertake ‘Part A’
of the Climate Change Impact and Adaptation Study in the Mekong Delta (TA 7377 – VIE).
This Report is one of two products that represent the culmination of Part A of the Climate Change
Prediction and Impact Assessment study. This report ‘Climate Change Vulnerability & Risk
Assessment Study for Ca Mau and Kien Giang Provinces, Vietnam’ presents three key outputs: an
identification of future climate conditions in the Mekong Delta region; an assessment of the effects of
future climate scenarios on natural, social, and economic systems in the Mekong Delta region; and a
baseline analysis of existing climate change capacity within the Government. It provides practical
measures that provincial and district administrations can take to inform and strengthen their programs.
Importantly, it addresses factors which may constrain or limit collaborative action between
communities, leaders, experts and development partners and identifies themes and strategies for
follow up work to be completed in Part B of the Project.
Part B of the Climate Change Impact and Adaptation Study will commence in early 2012, and will
focus on the identification of appropriate climate change adaptation measures for target provinces and
targeted regional sectors; and the development of pilot projects for up-scaling and replication of
Technical Assistance (TA) outcomes and support to collaborative mechanisms for information sharing
and coordinated action on climate change.
A fundamental principle of the project is the implementation of a participatory approach involving
national and provincial government representatives. With this in mind, a second ‘knowledge product’,
an atlas outlining the key findings of the project at a province level and for each district was also
produced. It is expected that the atlas which contains maps of the projected impacts of climate change
and of present and projected vulnerability will be an important tool for policy makers at national,
provincial and district level.
Target Provinces
Ca Mau and Kien Giang are the two most southern provinces of Vietnam. The economies of both
provinces are primarily based on agriculture, aquaculture, fishing and primary industries. Twenty
four districts from the two provinces were considered in the scope of this assessment.
Stakeholder consultations and field surveys were conducted in all districts, including:
Ca Mau City, Cai Nuoc, Dam Doi, Nam Can, Ngoc Hien, Phu Tan, Thoi Binh, Tran Van Thoi and U
Minh districts in Ca Mau province; and
Rach Gia City, Ha Tien, An Bien, An Minh, Chau Thanh, Giang Thanh, Giong Rieng, Go Quao, Hon
Dat, Kien Luong, Tan Hiep, U Minh Thuong, Vinh Thuan and the island districts of Kien Hai and Phu
Quoc in Kien Giang province.
Tasks and objectives
The methodologies and key activities of the Technical Assistance brief for the project (Appendix 8).
Part A of the project was expected to cover outputs 1 and 2. Outputs 3 and 4 will be completed in part
B and while output 5 is commenced in Part A it will be completed in more detail in Part B. The
relevant outputs and extent to which this study has achieved the expected outputs is described below.
Output 1: identification of future climate conditions in the Mekong Delta region
Climate Change Impact and Adaptation Study in Mekong Delta – Part A
xi | P a g e
Modelling future climate change scenarios in 2030 and 2050, building on work already carried out by
the Ministry of Natural Resources and Environment (MONRE) and donors, and using Global
circulation models, regional downscaled models, and local and international climate data as
appropriate. Modelling activities will be undertaken initially at the regional level with more detailed
modelling carried out for the regional target sectors and provinces. Modelling will investigate threats
related to; rising sea level, rainfall patterns (including drought frequency), temperature patterns,
salinity patterns, and storm surge.
This objective was successfully achieved, and the study produced comprehensive climate scenario
modelling for the whole Mekong Delta region using the most up to date climate scenario information
that is available for Vietnam. The report outlines detailed climate projection data for both Ca Mau and
Kien Giang. However a number of knowledge gaps and limitations of the various modelling
applications have been noted.
Output 2: assessment of the effects of future climate scenarios on natural, social, and economic
systems in the Mekong Delta region.
a. Carry out an impact risk assessment at Mekong Delta regional level using an approach based on
GIS (geographic information system) to identify the effects of future climate change scenarios on;
hydro-meteorological characteristics (e.g., flooding, sea levels and tides, salinity, river flows),
natural systems (e.g., biodiversity, water resources and quality, soils.), social systems (e.g.,
population, poverty, gender, public health, urban settlements), economic systems (e.g., industry, gross
domestic product, agricultural production), and important development sectors (including, but not
limited to, the identified target sectors).
b. Identify regional hotspots of climate change sensitivity, including vulnerable infrastructure items in
the target sectors.
c. Integrated assessment modelling will then be carried out for target provinces and sectors to
provide a more detailed assessment of climate change effects.
This objective was substantially achieved, but instead of moving from a Mekong Delta scale down to
province scale, the assessment started at the province scale. However, while the assessment was only
applied to the two target provinces, the observations, key findings and conclusions can be
extrapolated to apply to other provinces in the Delta. The study successfully used the outputs from a
hydrological / hydrodynamic model and a coastal model in MapInfo GIS to assess the effects of future
climate scenarios. The outputs from the modelling covered the entire region but due to time and data
constraints, detailed analysis of projected effects was restricted to Ca Mau and Kien Giang. The
evaluation did however consider the interconnections within the whole region, including inter
linkages of people, transport, trade, and water.
The outputs from the GIS were successfully used to determine the current and projected extent of the
effects on hydro-meteorological and natural systems, but again analysis was restricted to Ca Mau and
Kien Giang rather than at a regional level. In order to identify the effects on the social, economic and
development systems the study used three separate components; the results from the GIS exposure
modelling, observations and findings from the sectoral consultations, and district survey data to
determine the relative levels of risk for particular threat sources. The chosen methodology allowed for
the identification of hotspot districts in each target sector. Due to the data intensive nature of the
adopted risk assessment method, rather than applying a preliminary coarse regional assessment as
described in b, the study commenced with a detailed vulnerability assessment for the target provinces
and sectors only.
Output 5: incorporate institutional strengthening activities for Government decision makers and
technical staff, as well as awareness raising activities for the community.
Climate Change Impact and Adaptation Study in Mekong Delta – Part A
xii | P a g e
Activities for output 5 will be commenced under part A. An analysis of existing climate change
capacity within the Government will be carried out as the baseline to develop a tailored capacity
building program for provincial and sector authorities (PART B)
This output was only partially achieved. No formal climate change capacity assessment of national
government decision makers was carried out. However the international specialists did carry out
informal assessment of province and district capacity during the initial district surveys to varying
degrees. The status of future plans was examined and the extent to which climate change adaptation is
incorporated was analysed as a basis to assess existing capacity. It is recommended that a formal
institutional capacity assessment be carried out in Part B.
Project Outcomes
Output 1: Climate Change Projection Modelling.
Based on the review of relevant literature relating to climate change impacts and adaptation and the
preliminary analysis of secondary data for the Mekong Delta region undertaken during the project it
was evident that there were significant knowledge gaps and limitations surrounding the quantification
of climate change impacts in Vietnam, especially for the Mekong Delta region. In 2010 IMHEN
produced climate change scenarios for a select range of climate change development scenarios: Low
emissions scenario (B1); Intermediate emissions scenario of the medium scenario group (B2); and the
intermediate scenario of the high emission scenario group (A2 and A1Fi). This data has significantly
improved the climate change and sea level projections for Vietnam, and provides sea level scenarios
for 25 cm, 50 cm, 75 cm and 100 cm.
The study utilised statistically downscaled data for temperature and rainfall, together with the
regionally downscaled scenarios for sea level rise produced by IMHEN 2010 and the latest
hydrological river flow scenarios developed for the Mekong mainstream above Kratie by the Mekong
River Commission. The scenarios developed by the MRC were based on PRECIS, and have been used
in a number of reports prepared by IMHEN relating to climate change impacts in the Mekong River
upstream of Vietnam. As of mid-March 2011, the official Digital Elevation Model for the Mekong
Delta was released and a copy was made available for use by the project.
Extreme precipitation change projections were also derived for Ca Mau City and Rach Gia City by
CLIMsystems. Projections for changes in multiple day and one day extreme rainfall events were
explored for 2030 and 2050 (A2 and B2) by applying ensemble pattern scaling to the daily
precipitation output of 12 GCMs
The approach and methodology employed to produce the climate change scenarios and climate
change impact assessments is illustrated in Figure 1. The components that were used to produce the
final outputs of an outline of the threats are described below.
Two modelling efforts were used to determine the potential impacts of anthropogenic climate change
in the region.
1. Hydrological/ Hydrodynamic modelling was conducted by IMHEN using the outputs from the
regional climate modelling, historical climate data and the DEM to determine the potential impacts
on; flooding caused by increased streamflow, salinity and saline intrusion, drought, and water
resource demand and supply. Hydrological modelling was performed using the Integrated Quality and
Quantity Model (IQQM) to simulate the flow of water through the Mekong Delta river systems,
making allowance for control structures such as dams and irrigation abstractions. Hydrodynamic
modelling performed using the ISIS software enabled representation of the complex interactions
caused by tidal influences, flow reversals between wet and dry seasons, and overbank flow in the
flood season. Salinity intrusion modelling was also performed using ISIS.
Hydrological and hydrodynamic modelling was conducted under baseline (1980-1999 and for the
2000 flood event), 2030 (2020-2039) and 2050 (2040-2059) time horizons with flood inundation
Climate Change Impact and Adaptation Study in Mekong Delta – Part A
xiii | P a g e
projections produced for both A2 and B2 emission scenarios and salinity intrusion projections
projected for B2.
Figure 1- Schematic outlining this project’s climate change scenario and impact assessment methodology.
Note that sea level rise was taken into account in the hydrological and hydrodynamic
modelling but storm surges, typhoon impacts, and wind and ocean wave processes were
not. While existing flood and salinity control/protection infrastructure was incorporated
planned infrastructure was not included.
2. Coastal modelling performed by Dr Nhan at the Institute of Coastal and Offshore Engineering was
used to simulate the combined processes of hydrodynamics, wind induced waves, mud transport, sand
transport, erosion/deposition, storm surge, and typhoons in the near shoreline coastal zone of Kien
Giang and western Ca Mau provinces. This modelling utilizes the MIKE 21/3 Coupled Model Flow
Model and used as its input the hydrological modelling outputs, particularly the streamflow and river
flood inundation modelling results.
Analysis of the projected changes to the key input variables to coastal modelling revealed
minimal differences between 2030 and 2050 or A2 and B2 so only 2050 and only under
the B2 scenario was modelled in detail. Rather than the standard baseline of 1980-1999
this modelling used 2000-2009 as a baseline.
The comprehensive climate scenario modelling work used in this study utilizes the most up to date
climate scenario information that is available for Vietnam. However there are a number of knowledge
gaps and limitations of the various modelling applications in Vietnam. These include:
The application of the MAGICC/SCENGEN 5.3 model in the development of climate change
scenarios, which produces low-resolution grid maps (300 by 300 km) and makes it difficult to
accurately reflect the local specificities of climate change in Vietnam;
SIMCLIM modelling
 Outputs: Extreme rainfall
vents
Climate Change Impact and Adaptation Study in Mekong Delta – Part A
xiv | P a g e
There is currently a lack of in-depth analysis to distinguish and assess impacts induced by climate
change from other natural phenomena (e.g. El Nino/Southern Oscillation etc);
The current hydro-meteorological observation network is insufficient and inadequately distributed
across climate zones and therefore unable to meet the demands for climate monitoring and/or early
disaster warning.
The knowledge gaps were significant barriers to overcome in achieving the stated
objectives of this project (and some were only partially conquered), in particular the
limited availability of observed historical data and regionally-specific climate change
scenario information for means and extremes at the provincial level.
Sea Level Rise Projections
The different climate scenarios show little difference for the time periods that this study is concerned
with. Sea level is projected to rise by approximately 15 cm by 2030 and by approximately 30 cm in
2050. By the end of the 21st century, the sea level from Ca Mau to Kien Giang could rise up to 72 cm
(low scenario), 82 cm (medium scenario) and 105 cm (high scenario) compared with 1980-1999.
The hydrological modelling indicated that a 15 cm or 30 cm sea level rise would not result in an
appreciable increase in land area of the target provinces that would be "permanently inundated"
primarily as a result of the protection afforded by the current system of sea-dykes and flood protection
infrastructure. The exception is Ngoc Hien in Ca Mau province - which is already affected by
inundation in periods of high seasonal tides.
The most important effects of sea level rise relate to the corresponding changes in flooding and
drainage, its relative effect on salinity and importance for low lying areas in terms of enhancing
coastal erosion, proneness to inundation and increases storm surge/storm tide vulnerability. Any
change in the mean sea level, combined with the effects of storm surge associated with large storms or
cyclones are likely to have dramatic consequences, especially for Ngoc Hien and for the island
districts of Kien Hai and Phu Quoc.
Rainfall Projections
The most recent IMHEN projections for the end of the 21st century under both A2 and B2 emissions
scenarios are that:
By the end of 21st century, rainfall is expected to increase by about 3 to 4% in both Kien Giang and
Ca Mau compared to the baseline.
Rainfall tends to increase in rainy months (by up to 25% by the end of the century) and decrease in
dry months (can be from 30 to 35%).
In other words the dry seasons will get drier and rainfall in the rainy season will be more intense (i.e.
larger volumes in shorter periods). This will exacerbate flooding and drought conditions.
Extreme events
The CLIMsystems modelling projected that for both provinces the 10 and 100 yr extreme rainfall
events will be ~6% larger for 2030 (both scenarios) and 10% (B2) and 11% (A2) larger for 2050.
However, it should be noted that these values represent increases of only 13 mm and 22 mm in a 150
mm+ event for Ca Mau and only 15 mm and 32 mm during a 150- 300 mm event for Rach Gia.
Temperature Projections
The general trend of maximum and minimum temperature over the past 50 years has been an increase
with the minimum temperature increasing faster than the maximum temperature. Projected future
trends are:
 Increased seasonal air temperature ranging from 0.7°C warmer by 2030 to 1.4°C warmer by 2050
for Ca Mau, and 0.5°C to 0.9°C warmer for Kien Giang by 2050;
Climate Change Impact and Adaptation Study in Mekong Delta – Part A
xv | P a g e
 By the end of 21st century, the annual temperature would increase by about 1.5 to 2.0°C in Ca
Mau and Kien Giang. The increase of Ca Mau is higher than in Kien Giang.
 The maximum temperature increases by less than the minimum temperature. By the end of 21st
century, the maximum temperature may be higher than current record about from 2 to 2.5°C
compared with an increase of 3.5 to 4.0°C for the minimum temperature.
Other Climate Change Projections:
 Relative humidity decreases in the dry months and increase in rainy months in both provinces.
However, the annual relative humidity tends to decrease slightly.
 Average wind speed increases in winter, spring and autumn months in both provinces, but
decreases in the summer months. Annual average wind speed increases in most areas of Ca Mau
and does not have a clear trend in Kien Giang.
Some of the results that have emerged from the downscaling are confusing and will
require further detailed investigation to clarify:
 The A2 temperature results are very close to the B2 results, even out to 2050, which is
contrary to IPCC (2007).
 The A2 scenario temperatures are sometimes not as warm as B2, which is also
contrary to IPCC (2007).
 The change in temperature out to 2050 is sometimes not as large as the change to
2030 which is inconsistent with the known physics of climate change;
 The spatial pattern of warming is difficult to interpret, which requires further
investigation.
 The projected rainfall change under A2 is sometimes less than the change under B2
(this is for both the seasonal and monthly projections).
 There is a lack of significant differences in wind speed between the 2030 and 2050
scenarios and further investigation is required to determine whether this is a real
result.
Salinity Projections
Changes in hydrological conditions in the canal and river systems of the two provinces are projected
to occur due to the changes in the dynamics of flow between the higher sea level and the flows in the
Bassac branch of the Mekong River. As a result the intrusion of saline water into the canal system is
projected to change in the future. Salinity is found to be highest in late April and early May with
recorded values of salinity in the study area reaching as much as 29.4 ‰ (parts per thousand).
Figure 2 summarise the findings from IMHEN modelling for the current and future extent of salinity
in the region in 2050 for the A2 scenarios. Most notable is that all the districts in Ca Mau, and the
majority of districts in Kien Giang (with the exception of the island districts of Phu Quoc and Kien
Hai) are already affected by salinity. In the northern part of Kien Giang salinity is projected to
decrease in extent while in the south it is projected to increase in extent. The models predict an
increase in area of high salinity (>0.28 ‰) for both scenarios.
Storm Surge Projections
During a storm event, the combined effect of low pressure and high winds result in higher than
normal water levels. For both the East and West coastlines, storm surge will occur on the ocean facing
coastlines that are exposed to waves from the northeast and southwest monsoons.
It is clear from the climate simulations that extreme weather events pose a significant threat to both
provinces. Typhoons (defined as tropical depressions of sufficient intensity to produce gale force
Climate Change Impact and Adaptation Study in Mekong Delta – Part A
xvi | P a g e
winds) are not only dangerous because they produces destructive winds but also because they are
associated with torrential rains (often leading to floods), storm surge and wild sea conditions.
Figure 2 - Current and projected (2050 A2) maximum extent of salinity in the two provinces.
An analysis of Typhoon trends by IMHEN showed that while the frequency in the East Sea increased
slightly, the frequency of typhoon landings in Vietnam has no clear trend. However, Typhoon
landings have moved toward the South and the frequency of very strong storms (> level 12) has
increased. The analysis also showed that the typhoon season is ending later. This indicates that areas
that have not typically suffered from storms (such as the south eastern portion of the country and
HCMC) may increasingly be vulnerable. However, cyclones are a complex phenomenon and their
formation is very difficult to predict.
As part of the coastal modelling, the observations from Typhoon Linda in 1997 were used to simulate
the potential effects of typhoons and storm surge on the coastlines of Ca Mau and Kien Giang under
different sea level rise scenarios. The simulations show that the water surface elevation for a large
scale typhoon event could be as high as 2 m in elevation, and in combined with 4-5 m waves could
result in severe damage to coastal protection dykes, and fishing villages in estuaries and canal mouths
along the entire coast.
Output 2: assessment of the effects of future climate scenarios on natural, social, and economic
systems in the Mekong Delta region
Impacts on hydro-meteorological characteristics
The outputs from the hydrological / hydrodynamic and coastal models were imported into MapInfo
GIS for further spatial analysis to determine the spatial extent of the projected impacts. While the
model outputs covered the western portion of the Mekong Delta, detailed analysis presented in the
report covers only the target provinces. Analysis of the model outputs indicates that a number of
projected climate changes will have notable impacts.
Both the projected changes to rainfall patterns and increase in sea level will combine to alter the
extent of impacts of extreme flood events. With the projected increase in total annual precipitation,
Climate Change Impact and Adaptation Study in Mekong Delta – Part A
xvii | P a g e
and the projected changes to the hydrology of the Bassac River, flood danger is expected to increase
in all districts (except Phu Quoc and Kien Hai which are island districts) by 20 to 50% between now
and 2030 and 2050 respectively. Higher sea levels will reduce the ability of flood waters to escape to
the sea and will thus lead to more widespread and deeper inundation during extreme flood events.
The difference in the projected extent and depth of extreme event flooding (based on the 2000 flood)
for baseline sea level and climate conditions compared to the projected extent for sea level and
climate conditions for 2050 are illustrated in Figure 3. Most of Kien Giang is only just above sea level
and for twelve out of fourteen districts, the projected threat of flooding is considered to be moderate
to severe. Extreme threat of flooding from an extreme event is projected to be lower in Ca Mau with
only five out of nine districts with vulnerability to flooding considered to be moderate to severe.
Districts experiencing the greatest increases in area inundated include: An Minh – 55% increase; Vinh
Thuan – 53% increase; Ca Mau – 51% increase; and An Bien – 43% increase.
Figure 3 - Current and projected (2050 A2) extent and depth of extreme event flooding (based on the 2000
flood).
In the majority of the districts, flood protection is not adequate. Upgrading of flood protection is
urgently needed for all the districts, especially for the major settlements and industrial areas. Flood
protection upgrading is also needed along the Bassac River which is outside the study area but
influences flooding in Kien Giang and to a lesser extent in Ca Mau.
Increases in sea level, and the associated reduction in sediment transport and changes in deposition
patterns will lead to general and wide scale deterioration in coastal conditions, including lower levels
of sedimentation on the east coast and an increase in coastal erosion on the west coast. In addition,
the area of Ca Mau exposed to storm surge is projected to increase from 9% to 15%, while the area of
Kien Giang that is exposed is also projected to increase. Ngoc Hien district in Ca Mau is most likely
to be adversely effected as are the island districts of Phu Quoc and Kien Hai in Kien Giang, especially
Kien Hai with between 6 and 13% of their land area inundated. The combined effect of sea level rise
and increased storm surge will have detrimental effects on the fringing strip of mangroves that
Climate Change Impact and Adaptation Study in Mekong Delta – Part A
xviii | P a g e
currently help protect the coastline and provide valuable livelihood opportunities. In addition to this it
is likely that there will be a deterioration of beaches on Phu Quoc and other low set islands in the
Kien Hai Island group. These could become greater problems should climate changes result in
‘unexpected’ changes in oceanic circulation patterns, local currents, wind direction and wave
dynamics
Climate Change Impacts on Natural Systems
For each sector expert opinion was used to make an assessment of the existence and adequacy of in
2030 and 2050. Table 1 below summarises the projected impacts of climate change on natural systems
in each district of the two target provinces. In the Table the impact of each hazard on the
infrastructure is rated according to the combination of exposure to the hazard and the extent of
existing measures that are in place to reduce the impacts.
Table 1 - Summary of climate change impacts on natural systems in each district.
District
Hazard
Erosion &
Sedimentation
Flooding &
Drought
Saline
Intrusion
Storm
Surge
CaMauProvince
Ca Mau • ••• ••• •
Cai Nuoc •• •••• ••• •
Dam Doi •• •• ••• ••
Nam Can •• ••• ••• ••
Ngoc Hien •••• •• ••• ••••
Phu Tan •• ••• ••• ••
Thoi Binh • •• ••• •
Tran Van Thoi •• ••• ••• ••
U Minh •• •• ••• ••
KienGiangProvince
Rach Gia •• ••• ••• ••
Ha Tien •• ••• ••• ••
An Bien •• ••• ••• ••
An Minh •• •• ••• ••
Chau Thanh •• •••• ••• ••
Giang Thanh •• •••• •• •
Giong Rieng • •••• •• •
Go Quao • •••• ••• •
Hon Dat •• •••• ••• ••
Kien Hai •• • • ••••
Kien Luong •• •••• ••• ••
Phu Quoc •• • • ••
Tan Hiep • •••• ••• •
U Minh Thuong •• ••• ••• •
Vinh Thuan •• ••• ••• •
• Adequate, now and in the near future
(around 10 years)
••• Improvements are desirable in view of
economic development (medium term)
•• Adequate, but adaptation needed in
view of climate change (long term)
•••• Rehabilitation or upgrading urgently needed
As illustrated in the Table above, whilst the exposure to salinity is widespread and considered to be
major for just about all of the mainland districts, where control measures are largely in place the
impacts are generally only moderate. This is the same for the nature and extent of coastal erosion.
Whilst all of the coastal districts are exposed to coastal erosion, for most districts the impacts were
assessed as intermediate and/or partly controlled. However Ngoc Hien was assessed as major and
largely uncontrolled as it is the only coastal district not protected by the sea-dyke system.
Climate Change Impact and Adaptation Study in Mekong Delta – Part A
xix | P a g e
In terms of magnitude and extent, river flooding and inundation clearly represent the greatest threats
to both provinces and especially to Kien Giang where twelve of the fifteen districts were assessed as
having major exposure with little control mechanisms in place. In particular, the districts of Chau
Thanh, Giang Thanh, Giong Rieng, Go Quao, Hon Dat, Kien Luong and Tan Hiep were considered to
be highly vulnerable and threatened by flooding and inundation.
Impact Risk Assessment of social and economic systems in important development sectors.
The study approach to impact risk assessment emphasises the need to understand localised ‘current
vulnerability and risk’ as the best basis for predicting future vulnerabilities and risks, as regional
downscaling of long-term climate forecasts need to be supplemented by assessments of who within
geographically vulnerable regions are the most socially and physically vulnerable.
Several conceptual frameworks have been proposed that incorporate these concepts to describe the
general processes that lead to vulnerable people and places. This study has adopted the following
definitions:
Hazard refers specifically to physical manifestations of climatic variability or change, such as
droughts, floods, storms, episodes of heavy rainfall, long-term changes in the mean values of climatic
variables, and potential future shifts in climatic regimes;
Exposure refers to the types of assets at risk. They can include property, infrastructure, natural
resources, and the services those natural resources can provide (protection of health, provision of food
or water, etc.);
Sensitivity is the degree to which a system (natural, human, or built) is likely to be affected by
change, such as climate‐related environmental change;
Risk is a measure of the consequence (severity or sensitivity) and likelihood (probability) of potential
impact; and
Adaptive capacity is the ability of a community or system to mitigate, cope with, or accommodate
change
Resilience is the opposite of vulnerability, and building resilience is the primary goal of adaptation
planning. Resilience is a community’s ability to absorb disturbance while retaining its basic structure
and function.
Hence, the most vulnerable people, communities, districts or systems are those that are most exposed
to climate hazards or impacts, and who are the most sensitive to those effects, and who have the
lowest capacity to respond to the changing conditions.
In this context, the study developed a Comparative Vulnerability Assessment (CVRA) conceptual
framework that identified key geographic areas and sectors that are particularly vulnerable to the
combined effects of climate change and sea level rise, and particularly the impacts of flooding,
inundation, salinity, and storm surge. The CVRA incorporates a range of vulnerability indicators that
cover the important aspects of the social, economic and development systems that lead to climate
change vulnerability. The indicators incorporate measures of, exposure, sensitivity, and adaptive
capacity. The method also incorporates weighting factors that are based on expert opinions that
estimate the current status of existing protection measures and assess their suitability to provide
protection from projected changes to the extent of climate change impacts.
The method uses the results from the exposure modelling together with the key observations and
findings from the sectoral consultations and surveys to determine the relative levels of risk for a
particular threat source - expressed as a function of ‘likelihood’ and ‘consequence’ to highlight the
major risks at the district and provincial levels.
Due to the data intensive nature of the adopted CVRA method, rather than applying a
preliminary coarse regional assessment, the study focused on a detailed vulnerability
assessment for the target provinces and sectors only.
Climate Change Impact and Adaptation Study in Mekong Delta – Part A
xx | P a g e
The study focused on developing a range of comparative baseline indicators at the ‘district’ level for
each sector in order to provide a more detailed picture of the nature and extent of human settlements
and infrastructure that are likely to be most vulnerable to future climate change, and to develop
‘vulnerability profiles’ for each district that explicitly illustrate the ’comparative vulnerability’ of each
area under present conditions and for 2030 and 2050.
This CVRA (Comparative Vulnerability Risk Assessment) framework is a useful approach
to presenting quantitative estimates of the risks that climate change poses, at both the
regional and the local level. However, it is important to understand the limitations of this
approach, namely that the quantitative estimates are reliant on the quality of information
available. In addition the CVRA is unavoidably uncertain as it does not take account of
changes in non-climatic factors. These include future adaptation measures that will
influence both the baseline exposure and their sensitivity to climate effects.
Comparative Vulnerability Risk Assessment Findings
Risk
The risk assessment presented in Table 2 indicates the extent of the risks that are posed by the three
major climate change threats to the 25 districts in the two target provinces. The island districts of Phu
Quoc and Kien Giang have little risk from inundation or salinity. While five districts in Ca Mau and
two mainland district in Kien Giang are currently at low risk from inundation, all mainland districts
are projected to be at moderate risk from inundation by 2050. All mainland districts are currently at
moderate risk from salinity and are projected to remain at moderate risk out to 2050. Ngoc Hien and
Table 2- Risks posed to each district from climate change impacts for baseline, 2030 and 2050.
Inundation Salinity Storm Surge
District 2010 2030 2050 2010 2030 2050 2010 2030 2050
Ca Mau 3 8 9 10 10 10 0 0 0
Cai Nuoc 8 9 9 10 10 10 0 0 0
Dam Doi 3 8 8 10 10 10 4 4 4
Nam Can 8 8 8 10 10 10 4 4 6
Ngoc Hien 3 8 3 10 10 10 8 10 10
Phu Tan 8 8 8 10 10 10 4 4 4
Thoi Binh 3 3 8 10 10 10 0 0 0
Tran Van Thoi 8 8 9 10 10 10 4 4 4
U Minh 3 3 8 10 10 10 4 4 4
Rach Gia 9 9 9 10 10 10 4 4 4
Ha Tien 8 8 9 10 10 10 4 6 6
An Bien 8 8 9 10 10 10 4 4 4
An Minh 3 8 8 10 10 10 4 4 4
Chau Thanh 9 9 9 10 10 10 4 4 4
Giang Thanh 9 9 9 10 10 10 0 0 0
Giong Rieng 9 9 9 5 5 5 0 0 0
Go Quao 8 9 9 5 10 10 0 0 0
Hon Dat 9 9 9 10 5 5 4 4 4
Kien Hai 0 0 0 0 0 0 6 6 6
Kien Luong 9 9 9 10 10 10 4 4 4
Phu Quoc 3 3 3 0 0 0 4 4 4
Tan Hiep 9 9 9 10 5 5 0 0 0
U Minh Thuong 3 8 8 10 10 10 0 0 0
Vinh Thuan 3 8 8 10 10 10 0 0 0
>20 Extreme; requires urgent
attention.
5 - 12 Medium; existing controls sufficient in the short
term, will require attention in the medium term.
12 - 20 High; requiring attention in
the near term.
<5 Low; existing controls will be sufficient.
Climate Change Impact and Adaptation Study in Mekong Delta – Part A
xxi | P a g e
Kien Hai are currently at moderate risk from storm surge but are projected to remain at moderate risk
out to 2050. Nam Can and Ha Tien are projected to be at moderate risk from storm surge by 2050.
Sectoral Vulnerability
Population and Poverty
The provinces of Kien Giang and Ca Mau are home to approximately 2.92 million people and have
some of the highest population densities in the country. The main pressures driving socio-economic
vulnerability in the region are demographic trends, population growth, pressure on land and water use,
limited space (available land) and industrial development.
Whilst poverty is important in terms of resilience and adaptive capacity, the relatively low levels of
poverty in the region would indicate that it is not a principal driver of vulnerability. However, higher
incidences of poverty reduce adaptive capacity. It should be noted that there is also a strong
correlation between ethnicity and poverty in the study region.
Agriculture and Livelihoods
It is highly likely that economic development of both provinces will be adversely affected by climate
change, primarily due to the direct and indirect effects of climate change on primary industry.
Agriculture as an economic sector accounts for approximately 40% of the regional GDP, provides for
the livelihoods of more than 75 % of the people and is the major contributor to the economies of both
provinces. Any increase in the negative impacts on the agricultural systems from flooding, inundation,
salinity and coastal erosion and sedimentation will impact not only on the livelihoods of local people,
but also on the regional and national economies.
The most severe socio-economic vulnerabilities in this sector relate to the combined effects of
flooding, inundation and saline intrusion associated with sea level rise on agricultural lands and
aquaculture lands and the resulting impacts on livelihoods, GDP and primary industry.
Increased temperature may result in decreased rice yields due to heat stress and decreased flowering
potential. However, crop models incorporating CO2 fertilization predict increased yield if irrigation
requirements are met. The yields of sugar cane and maize are predicted to increase. Other fruit and
vegetable crops may have decreased yields due to impacts on flowering/fruiting and/or changes in
growth rates. For aquaculture, shrimp mortality may increase due to high water temperature, increase
in disease levels and increased mortality in larvae production systems.
Higher wet season rainfall may reduce rice yields through inundation damage, or localised flooding
damaging farm infrastructure. Aquaculture may experience a reduction in salinity leading to
decreased growth rates and disease or localised flooding damaging pond infrastructure. And fisheries
may see a reduction in estuarine or near shore salinity leading to dramatic changes in fish ecology and
reduction in catch. Lower dry season rainfall may result in increased salinity in canals leading to
reduced growth rates for aquaculture and reduced rice yields. A decreased capacity for irrigation will
affect not only rice but other crops.
A potential climate impact specific to the rice shrimp farming system is a reduced cropping window
through delays in planting the rice crop (because of need for rain to flush out salts) and reduced yields
due to end of season salinity damage. Irregular seasonal changes can cause poor water quality and
shrimp stress and disease.
Industry and Energy
The industrial sector will be most at risk from the effects of sea level rise and inundation. The
industries of both provinces are primarily based on the processing of agricultural, aquacultural and
ocean fishing products. Kien Giang has large natural resource based industries primarily cement
manufacturing from local limestone deposits and Ca Mau has fertiliser production and large existing
energy sector assets with new energy based developments underway. Both provinces have small
Climate Change Impact and Adaptation Study in Mekong Delta – Part A
xxii | P a g e
service industries based around tourism, ice making, ship building and agriculture and aquaculture
service industries.
The shrimp and fish processing plant sites are generally in the order of only 0.5 to 1.5 m above water
level. Some plants already come close to flooding in spring tides in the wet season, so they are
vulnerable to any sea level rise (SLR) climate change effects.
Many of the new industrial zones and shrimp and fish processing plant sites are also only around 0.5
to 1.5 m above water level and are vulnerable to sea level rise and inundation and will eventually
either need to be raised or defended or abandoned. In some cases it is clear that the industrial sites
would be defended in almost any realistic climate change impact scenario for their remaining lives.
This includes the Ca Mau fertilizer complex and the two medium-large cement plants and the new
brick making plant in Kien Luong district of Kien Giang province
The main climate change vulnerability of the provincial power transmission and distribution system,
and particularly the large number of low and medium voltage distribution level poles traversing low
lying rice paddies and aquaculture areas, is their vulnerability to extreme events, in particular high
winds and typhoons. There will also be increased corrosion vulnerability from inundation and salinity,
primarily on medium and low voltage distribution level poles. High voltage steel transmission towers
are well engineered to international standards and are not significantly vulnerability to climate change
Urban Settlements and Transportation
The urban settlement patterns in Ca Mau and Kien Giang are on the Mekong Delta are unique,
consisting of the two provincial centres of Rach Gia and Ca Mau and 41 other provincial towns and
district centres, connected by an extensive and complex system of waterways and roads. The main
drivers of vulnerability in relation to human settlements in the region are population growth and
urbanisation, and the associated pressure on land and water use, limited space (available land) and
migration.
The highest risks facing urban settlements in the region relate to the combined effects of sea level rise
and severe flood risk and storm surge associated with extreme events. However, the overall socio
economic resilience and adaptive capacity in the urban areas is considered to be relatively high,
primarily due to higher levels of income, wealth and support services and infrastructure in comparison
with rural populations.
Water transport is of crucial importance in both provinces as demonstrated by the disproportionately
high volume of goods shipped out of both provinces. Water transportation (rivers/canals) provides the
natural comparative advantage of the Province compared to other areas with only roads. Inland
waterways provide a cheap, all-weather and easily accessible network for all the population.
However, significant investments in the roads network have been made in the last 10 years in Ca Mau
and Kien Giang in an integrated system of national, provincial and district level roads that service the
main population centres. The region is also serviced by 3 domestic airports and there is a major border
crossing to Cambodia near Ha Tien.
The most important vulnerabilities for the transport sector relate to the combined effects of river based
flooding and coastal inundation associated with sea level rise. Whilst roads are usually considered to
be highly vulnerable to SLR and only modest inundations may cause significant damages to a
network, the actual designs of newly built or upgraded roads are based on flood records and local
conditions. National Roads are designed for 1 in 100 year floods and Provincial Roads for 1 in 50 year
floods offering a high level of resilience. Elevation Codes for roads in Ca Mau mean they will be
much higher than surrounding lands leading to potential difficulties for: access to frontage properties;
access to lower access points; transverse drainage under the road may be reduced; roads may flood
adjoining properties; and the incorporation of road drainage and other services along roads.
The move towards increased industrialisation will put more demands on both the land and water based
transportation systems to ensure there is an efficient system to support processing and marketing of
produce.
Climate Change Impact and Adaptation Study in Mekong Delta – Part A
xxiii | P a g e
Vulnerability hotspots
The vulnerability rankings for each of the district are based on a standard set of indicators so that the
vulnerability can be compared not only between districts, but also across sectors. A regional
vulnerability was calculated for each time period as the average value of the five sectors. The
geographical distribution of the regional vulnerability for baseline, 2030 and 2050 is shown in Figure
4. Currently, while the Study Area has high exposure the vulnerability to the potential impacts of
climate change are low to moderate. However the magnitude of exposure, sensitivity, vulnerability
and risk associated with these changes will change into the future, with a number of areas being
assessed as highly vulnerable by 2050.
Figure 4. - The regional vulnerability for baseline, 2030 A2 and 2050 A2.
Regional hotspots of climate change sensitivity
Hotspots are defined as geographical areas that inherently have the highest vulnerability to a climate
change hazard or combination of hazards. Because the CVRA process uses a ranking method and is
applied on a sector basis, the most vulnerable districts in each sector can be identified. The hotspot
districts for each sector are shown in Table 3. In Ca Mau province, Tran Van Thoi, Dam Doi and Ca
Mau City are vulnerable across multiple sectors. In Kien Giang, Chau Thanh is vulnerable in all
sectors and Rach Gia city and Kien Luong are vulnerable across multiple sectors.
Table 3 - Vulnerability hotspot districts in each sector.
Sector
Population Poverty Agriculture &
Livelihoods
Industry &
Energy
Urban Settlements &
Transport
Ca Mau
Province
Ca Mau Ngoc Hien U Minh Dam Doi Cai Nuoc
Tran Van Thoi Dam Doi Dam Doi Tran Van Thoi Tran Van Thoi
Tran Van Thoi Ca Mau Ca Mau
Kien
Giang
Province
Rach Gia Chau Thanh Hon Dat Chau Thanh Chau Thanh
Chau Thanh Rach Gia Hon Dat Kien Luong
Chau Thanh Rach Gia Ha Tien
Kien Luong Rach Gia
Giong Rieng
Go Quao
An Bien
An Minh
Climate Change Impact and Adaptation Study in Mekong Delta – Part A
xxiv | P a g e
Output 5: an analysis of existing climate change capacity within the Government
Capacity at the national, provincial and district level capacity was assessed through an analysis of the
current planning documents and the existing situation on the ground in combination with the results of
the project survey. The assessment for the provincial/district level, summarised in Table 4, indicates
that there is a considerable lack of institutional capacity at these levels of government. Capacity at the
local (commune) level was not specifically assessed and would be an important component in the
process of choosing sites for pilot projects. It is recommended that a formal assessment of adaptive
capacity be carried out as a first step in designing an institutional climate change adaptation capacity
building program.
Table 4 - Qualitative assessment of institutional capacity for nine key measures.
Capacity component Assessment
Engage with stakeholders and create
consensus
Key provincial development decisions are conceptualised at and
delegated from the national level
Awareness programs are often in place but poor understanding by the
public is stated as barrier.
Women and farmers unions are poorly represented in planning stages
Articulate the mandate of a new
institution or vision a trajectory
Prime minister proclamations generally contain appropriate visionary
components
Develop a strategy and translate into
a plan and budget
Strategies are poorly developed and plans lack concrete steps
Implement a programme or policy Lack of processes and checks in programme implementation
Monitor and evaluate results Very weekly developed
Effective and good leadership There is a distinct lack of tendency for individuals to take on decision
making roles
Effective and well functioning
institutions
Many institutions do not function well
Environment conducive to
knowledge sharing
Institutional environment actively suppresses knowledge sharing
Transparent and independent
accountability systems
Complete absence of transparency accountability system
Further research needs and gaps
Capacity at the national level was only assessed by expert judgement based on future development
plans and research output. While capacity at the local (commune) level was not specifically assessed
and would be an important component in the process of choosing sites for pilot projects. It is
recommended that a formal assessment of adaptive capacity be carried out as a first step in designing
an institutional climate change adaptation capacity building program.
There are a range of other issues that were beyond the scope of the study that require further
consideration, including:
How can the results of current future studies of this nature (and especially the meteorological and
climate modelling), be disseminated more effectively so that the information can be more readily
available to others? This is an extremely important point for the Government of Vietnam to address.
With a plethora of climate change studies being carried out by many different organizations in
Vietnam, and especially on the Mekong Delta, how can future adaptation projects be coordinated so
that work is not duplicated?
Internal migration from rural areas to provincial centres or to the large cities, and the question of
how climate change impact on this is a highly sensitive issue, which only the Government of Vietnam
can address.
How can existing networks and organizations be better used to improve cooperation on adaptation
activities and enhance resilience.
Climate Change Impact and Adaptation Study in Mekong Delta – Part A
1 | P a g e
1. Introduction
The Asian Development Bank (ADB) engaged Sinclair Knight Merz (SKM), in association with
Center for Environmental Research (CENRE) under the Vietnam Institute of Meteorology, Hydrology
and Environment (IMHEN), Acclimatise and University of Newcastle, Australia to undertake ‘Part A’
of the Climate Change Impact and Adaptation Study in the Mekong Delta (TA 7377 – VIE).
This Report, ‘Climate Change Vulnerability & Risk Assessment Study for Ca Mau and Kien Giang
Provinces, Vietnam’ represents the culmination of Part A of the Climate Change Prediction and
Impact Assessment study, and incorporates the most up-to-date projections of future climate
conditions in the Mekong Delta region; and a detailed vulnerability and risk assessment (VRA) of the
potential effects of future climate scenarios on natural, social and economic systems in the Mekong
Delta region.
Part B of the Climate Change Impact and Adaptation Study will commence later this year, and will
focus on the identification of appropriate climate change adaptation measures for target provinces and
targeted regional sectors; and the development of pilot projects for up-scaling and replication of TA
outcomes and provide support to collaborative mechanisms for information sharing and coordinated
action on climate change.
1.1 Purpose of this Study
The purpose of this study was to identify potential future climate conditions in the Mekong Delta
region, and assess the effects of future climate scenarios on natural, social and economic systems in
the region, so as to inform and assist decision makers and development partners in the Mekong Delta
region to adapt to the future impacts of climate change and sea level rise.
The study focuses on assessing the potential impacts of climate change on the three target sectors in
Kien Giang and Ca Mau provinces, these being energy and industry, transport and urban planning,
and agriculture and forestry.
In this context, the study primarily targets provincial and district level decision makers in the Kien
Giang and Ca Mau provinces, as well as major development partners. It provides practical measures
that provincial and district administrations can take to inform and strengthen their programs.
Importantly, it addresses factors which may constrain or limit collaborative action between
communities, leaders, specialists and development partners. It suggests target provinces and targeted
regional sectors, which may be suitable for future development as pilot projects for up-scaling and
replication in Part B of the project. And finally the study has attempted to identify a range of sectoral
adaptation themes for the target sectors where non-structural adaptation options suitable for
addressing social and natural system vulnerability can be futher explored in Part B of the project.
1.2 The Regional Context
Vietnam is considered to be one of the countries likely to be most affected by global climate change.
Within Vietnam, the Mekong Delta region in the south of the country has been identified as being
particularly susceptible to the impacts of extreme climate events and climate variability. The focus of
this study is the Mekong Delta provinces of Ca Mau and Kien Giang. With a sea level rise of 75 cm,
Kien Giang and Ca Mau are two of the top four most affected provinces in terms of areas inundated in
Vietnam (according to the Sea Level Rise Report – IMHEN 2010b).
Climate Change Impact and Adaptation Study in Mekong Delta – Part A
2 | P a g e
Figure 5 - Map of the Study Area
Climate Change Impact and Adaptation Study in Mekong Delta – Part A
3 | P a g e
1.2.1 The Mekong Delta
The Mekong Delta region covers 12% of the area of Vietnam, and comprises the provinces of Long
An, Dong Thap, Tien Giang, An Gian, Vinh Long, Ben Tre, Tra Vinh, Soc Trang, Can Tho, Bac Lieu,
Kien Giang and Ca Mau and is home to one fifth of the national population (i.e. approximately 17
million people). Two-thirds of the Mekong delta is located in southern Vietnam and one third in
Cambodia. The Vietnamese portion of the Mekong Delta occupies 40,058 km2
, of which 24,000 km2
are now used for agriculture and aquaculture and 4,000 km2
for forestry.
The population density in the Vietnamese part of the Delta is relatively high (425 inhabitants/ km2
)
when compared to other regions of the country which averages around 250 inhabitants/km2
. With a
population growth rate of 0.6% the pressure on the available space is increasing, and is considered to
be one of the major drivers of change in the Delta along with economic development and climate
change.
Poverty remains an important challenge for the region. Despite a considerable decline in poverty since
1998, there are still around four million poor people living in the Vietnamese Mekong Delta
provinces. This is the highest number of poor people of any of Vietnam’s seven regions, and has the
highest percentage of ’near poor’ people who are vulnerable to falling back into poverty through
adverse impacts on household livelihoods and income from climate change. The Mekong Delta is
primarily a rural landscape, with approximately 85% of the population living in rural circumstances
and reliant on agriculture for their livelihoods.
The Vietnamese part of the Mekong Delta is one of the most productive and intensively cultivated
areas in Asia, and is considered to be a priority area for national economic development and food
security. Around two thirds of the Mekong delta (10,000 km2
) is used for agricultural production with
the rice dominant product. The delta is responsible for producing half of the country’s rice, 60 percent
of its fish-shrimp harvest, and 80 percent of its fruit crop.
Aquaculture, forestry and non-rice agricultural crops are also important in some areas. Both
freshwater and brackish water aquaculture have recently expanded in both area and economic
importance. Aquaculture exports from the delta grew by over 425 percent between 1998 and 2008,
and exceed USD 4 billion in value in 2009. The delta now contains 65 percent of the country’s area
under aquaculture.
Primary production accounted for 41 percent of value added to the delta GDP in 2007, with
agriculture, aquaculture, fisheries and forestry the largest primary sectors. Industry, construction and
service sectors have grown much faster and collectively account for 59 percent of the regional
economy. However much of the industry is either involved in processing primary products such as
rice, aquatic products, and sugar or provides agricultural support services such as fertiliser production
and machinery servicing.
Many changes have occurred in the Mekong Delta to support agricultural and aquacultural expansion
and intensification. Canals, dikes and roads have altered the natural dynamics of the floodplain.
Mangroves have been cleared and replaced with shrimp ponds, and canals and dams have opened up
brackish areas to rice farming. Continuing agricultural and aqua cultural expansion threatens more
loss of mangroves in the delta. Increasing use of groundwater is also of concern, increasing risks of
saltwater intrusion, as well as contributing to compaction of the sediment layers (WWF Vietnam).
Whilst rice and aquaculture are the primary livelihood pursuits, over the last 5-10 years there has also
been a rapid uptake of new economic activities, primarily due the Government’s economic
restructuring initiatives in the area. In recent years both shrimp cultivation and fruit production have
expanded rapidly, with government providing subsidised credit in support of these activities. Many of
those who can afford the inputs for these activities have profited. Intensive shrimp farming requires
high levels of investment to ensure that the ponds do not become polluted and to limit losses from
Climate Change Impact and Adaptation Study in Mekong Delta – Part A
4 | P a g e
shrimp disease. People who have managed to invest on a scale to do this properly and efficiently have,
in some cases, become very wealthy.
Another significant trend in the delta is that of increased mechanisation and land consolidation. In
comparison with other lower Mekong Basin countries, Vietnam’s Delta has both the highest levels of
chemical inputs and the largest number of tractors per capita. Currently, 90 percent of the rice land on
the delta is prepared by tractor, 80 percent is mechanically harvested and almost 100 percent of rice is
machine threshed.
1.2.2 Socio-Economic Context
Over the last 25 years, Vietnam’s economy changed dramatically from a planned economy to a
modern free market economy. Vietnam’s economy was among the fastest growing economies of Asia,
with the profound reforms under ‘Doi Moi’, which literally means ‘change and renewal’, contributing
to impressive increases in production and substantial declines in the incidence of poverty from 37 per
cent in 1998 to 29 per cent in 2002, and 13 per cent in 2008.
Under Doi Moi, the Government of Vietnam identified the Mekong Delta as a priority area for
economic development, and established targets to increase the production of food, commodities and
consumer goods in the Delta by 8 percent annually. According to figures from the General Statistics
Office in Hanoi, Vietnam’s economy grew 8.5 percent in 2007, the fastest pace since 1996. Industry
and construction accounted for 42 percent of Vietnam’s economy in the first quarter of 2008.
Agriculture, forestry and fisheries, which accounted for 14 percent of Vietnam’s economy in the first
quarter, grew at 2.9 percent, up from 2.6 percent in the same period in 2007. Per capita GDP increased
from US$ 200 in 1996 to over US$ 700 in 2006.
With its strong economic performance, Vietnam has become attractive as a country for foreign
investment with a cheap, well-educated labour force and large domestic market. Compounded Annual
Growth Rate (CAGR) was about 7.6 per cent in the period from 2000 to 2010 and as a result GDP per
capita increased from US$400 in 2000 to almost US$1,100 in 2010, buoyed by the continued
expansion of investment in infrastructure, labour-intensive manufacturing and service activities.
Triggered by the global financial crisis, GDP growth fell to about six per cent in 2008 and 4.5 percent
in 2009, the lowest level in almost a decade and a sharp drop from the 8.5 per cent in 2007. At the
same time, inflation rose to 25 per cent in 2008, the highest in the region which also includes Laos,
Thailand, and Cambodia. Projected real GDP growth (excluding inflation) for the period 2012-2020
targets about 7% per year.
However, the drop in GDP growth rate during the financial crisis was less than in neighbouring
countries as the Government began addressing the threat of an overheated domestic economy
decisively, starting in late 2007. In response to the first shock of the current crisis, the authorities
shifted emphasis from growth to stabilisation in March 2008. In late 2008, they shifted once more to
supporting economic activity through large interest rate reductions, injections of liquidity, and a fiscal
stimulus package.
1.2.3 Sectoral Growth and Diversification
The extraordinary economic growth in the Vietnam over the last 20 years has primarily been driven
by the economic structural transition from what was primarily a centrally-planned rurally-based
economy to a more dynamic and productive multi-sectoral market driven economy that promoted the
rapid development of the private sector.
Between 1986 and 2005, the structure of the Vietnamese economy transitioned from an economy
dominated by agricultural production to an economy dominated by industry and construction and
services. Figure 6 illustrates the long-term economic structural transition in Vietnam. The relative
contribution of agriculture to GDP has declined from 38.1% in 1986 to 20.7% in 2005, representing a
Climate Change Impact and Adaptation Study in Mekong Delta – Part A
5 | P a g e
17% reduction. Over the same period the proportional contribution from industry and energy and the
service sectors has risen by 11.9% and 5% respectively. The transition towards to an economy
dominated by industry and construction and services has lifted productivity and growth rates, and
suggests that industry will likely become the leading sector in the economy.
Figure 6 – Vietnam’s economic–sectoral structure transition 1986-2005. Source: Vietnam’s Economy
After 20 years of Renewal (1986-2005)
In the Mekong Delta, the share of GDP by sector has also shifted markedly from agriculture to the
industry and service sectors. In the late 1980s, agriculture comprised more than 40 per cent of GDP,
while service and industry contributed about 30 and 25 per cent to GDP, respectively. In 2007,
industry’s contribution to GDP rose to more than 40 per cent, while agriculture contributed only about
20 per cent.
The rapid expansion of the industrial sector in the Mekong Delta has been due to growth in
infrastructure, mining, oil production, construction and opening of trade policies. The importance of
these changes to the coastal economies of Ca Mau and Kien Giang cannot be emphasized sufficiently.
Today, the coastal economies of Ca Mau and Kien Giang’s multi-sectoral activities are strongly
interwoven with linkages in numerous value chains, and the economies of both provinces encompass
a range of maritime and terrestrial industries. The major sectors that contribute to the economy of the
two provinces are:
1986 2005
Agriculture
Industry &
Construction
Services
Use of the term Agriculture
In discussions of economic sectors Agriculture is used to refer to all products from the rural
economy; grains, fruit, animal husbandry, aquaculture, forestry and fisheries.
However, the term Agriculture is also used to refer to the combination of cropping and
aquaculture, and
Fisheries is used to describe both Aquaculture and capture fisheries, particularily when
describing the output of fish processing which occurs in the same factories
In the remainder of the study the following definitions will be used:
Agriculture – Crops (mainly rice), fruit, animal husbandry and aquaculture,
Aquaculture – Production of fish, prawns and other crustaceans in ponds or cages
Fisheries – catch of wild fish from the ocean or rivers and canals
Forestry – production of timber and timber products from natural or plantation forest.
Climate change impact and adaptation study in the mekong delta

More Related Content

Similar to Climate change impact and adaptation study in the mekong delta

Pow climateimpact dec2012
Pow climateimpact dec2012Pow climateimpact dec2012
Pow climateimpact dec2012EyesOnTheWorld
 
Impact of climate on the winter tourism industry in the US, a study by Protec...
Impact of climate on the winter tourism industry in the US, a study by Protec...Impact of climate on the winter tourism industry in the US, a study by Protec...
Impact of climate on the winter tourism industry in the US, a study by Protec...Kit Seeborg
 
Draft evalreport en_revisedaug29
Draft evalreport en_revisedaug29Draft evalreport en_revisedaug29
Draft evalreport en_revisedaug29Dr Lendy Spires
 
Impact of disasters unit - ii
Impact of disasters    unit  - iiImpact of disasters    unit  - ii
Impact of disasters unit - iiJayaKrishna126
 
1002748_Ritchie_ENG5041P_Final_Report_14-15
1002748_Ritchie_ENG5041P_Final_Report_14-151002748_Ritchie_ENG5041P_Final_Report_14-15
1002748_Ritchie_ENG5041P_Final_Report_14-15Scott Ritchie
 
EC - Env and Climate Guidelines - 2011 v2
EC - Env and Climate Guidelines - 2011 v2EC - Env and Climate Guidelines - 2011 v2
EC - Env and Climate Guidelines - 2011 v2Torsten Kowal
 
Risk, Vulnerability and Resilience in the Limpopo River Basin - A Synthesis_0
Risk, Vulnerability and Resilience in the Limpopo River Basin - A Synthesis_0Risk, Vulnerability and Resilience in the Limpopo River Basin - A Synthesis_0
Risk, Vulnerability and Resilience in the Limpopo River Basin - A Synthesis_0Amelia Midgley
 
Atlas de mortalidad y pérdidas económicas debido al clima OMM
Atlas de mortalidad y pérdidas económicas debido al clima OMMAtlas de mortalidad y pérdidas económicas debido al clima OMM
Atlas de mortalidad y pérdidas económicas debido al clima OMMhidrometeorologiaucv
 
Major hazard incidents
Major hazard incidentsMajor hazard incidents
Major hazard incidentsKaleem Farooq
 
Chinese Renewable Energy Status Report
Chinese Renewable Energy Status ReportChinese Renewable Energy Status Report
Chinese Renewable Energy Status ReportREN21
 
Energy Resources
Energy ResourcesEnergy Resources
Energy ResourcesGordon Best
 
Report-DAS and Mobile Transmission Power
Report-DAS and Mobile Transmission PowerReport-DAS and Mobile Transmission Power
Report-DAS and Mobile Transmission PowerNyoka de Wert
 
Thesis - Re-mapping Solar Energy
Thesis - Re-mapping Solar EnergyThesis - Re-mapping Solar Energy
Thesis - Re-mapping Solar EnergyDina Hassan
 
Emc Documentum Magellan Faq
Emc Documentum Magellan FaqEmc Documentum Magellan Faq
Emc Documentum Magellan FaqLiquidHub
 

Similar to Climate change impact and adaptation study in the mekong delta (20)

Revised-EIA-Report-of-MRT-Line-1.pdf
Revised-EIA-Report-of-MRT-Line-1.pdfRevised-EIA-Report-of-MRT-Line-1.pdf
Revised-EIA-Report-of-MRT-Line-1.pdf
 
Pow climateimpact dec2012
Pow climateimpact dec2012Pow climateimpact dec2012
Pow climateimpact dec2012
 
Impact of climate on the winter tourism industry in the US, a study by Protec...
Impact of climate on the winter tourism industry in the US, a study by Protec...Impact of climate on the winter tourism industry in the US, a study by Protec...
Impact of climate on the winter tourism industry in the US, a study by Protec...
 
Draft evalreport en_revisedaug29
Draft evalreport en_revisedaug29Draft evalreport en_revisedaug29
Draft evalreport en_revisedaug29
 
Impact of disasters unit - ii
Impact of disasters    unit  - iiImpact of disasters    unit  - ii
Impact of disasters unit - ii
 
1002748_Ritchie_ENG5041P_Final_Report_14-15
1002748_Ritchie_ENG5041P_Final_Report_14-151002748_Ritchie_ENG5041P_Final_Report_14-15
1002748_Ritchie_ENG5041P_Final_Report_14-15
 
Ports Australia
Ports Australia Ports Australia
Ports Australia
 
EC - Env and Climate Guidelines - 2011 v2
EC - Env and Climate Guidelines - 2011 v2EC - Env and Climate Guidelines - 2011 v2
EC - Env and Climate Guidelines - 2011 v2
 
Gfdrr drm and_cca_eca
Gfdrr drm and_cca_ecaGfdrr drm and_cca_eca
Gfdrr drm and_cca_eca
 
Gfdrr drm and_cca_eca
Gfdrr drm and_cca_ecaGfdrr drm and_cca_eca
Gfdrr drm and_cca_eca
 
Risk, Vulnerability and Resilience in the Limpopo River Basin - A Synthesis_0
Risk, Vulnerability and Resilience in the Limpopo River Basin - A Synthesis_0Risk, Vulnerability and Resilience in the Limpopo River Basin - A Synthesis_0
Risk, Vulnerability and Resilience in the Limpopo River Basin - A Synthesis_0
 
Atlas de mortalidad y pérdidas económicas debido al clima OMM
Atlas de mortalidad y pérdidas económicas debido al clima OMMAtlas de mortalidad y pérdidas económicas debido al clima OMM
Atlas de mortalidad y pérdidas económicas debido al clima OMM
 
Major hazard incidents
Major hazard incidentsMajor hazard incidents
Major hazard incidents
 
Chinese Renewable Energy Status Report
Chinese Renewable Energy Status ReportChinese Renewable Energy Status Report
Chinese Renewable Energy Status Report
 
Energy Resources
Energy ResourcesEnergy Resources
Energy Resources
 
QUOVADIS_NUM9_AMJ_2012
QUOVADIS_NUM9_AMJ_2012 QUOVADIS_NUM9_AMJ_2012
QUOVADIS_NUM9_AMJ_2012
 
Report-DAS and Mobile Transmission Power
Report-DAS and Mobile Transmission PowerReport-DAS and Mobile Transmission Power
Report-DAS and Mobile Transmission Power
 
Thesis - Re-mapping Solar Energy
Thesis - Re-mapping Solar EnergyThesis - Re-mapping Solar Energy
Thesis - Re-mapping Solar Energy
 
Emc Documentum Magellan Faq
Emc Documentum Magellan FaqEmc Documentum Magellan Faq
Emc Documentum Magellan Faq
 
Master thesis
Master thesisMaster thesis
Master thesis
 

More from ngocjos

Panama papers offshore assets of world leaders revealed by leak
Panama papers   offshore assets of world leaders revealed by leakPanama papers   offshore assets of world leaders revealed by leak
Panama papers offshore assets of world leaders revealed by leakngocjos
 
Streets of gold uk's most expensive addresses
Streets of gold   uk's most expensive addressesStreets of gold   uk's most expensive addresses
Streets of gold uk's most expensive addressesngocjos
 
Case studies in improving urban air quality
Case studies in improving urban air qualityCase studies in improving urban air quality
Case studies in improving urban air qualityngocjos
 
Global carbon-pricing-we-will-if-you-will book
Global carbon-pricing-we-will-if-you-will bookGlobal carbon-pricing-we-will-if-you-will book
Global carbon-pricing-we-will-if-you-will bookngocjos
 
[Zhao kejin and_gao_xin_pursuing_ the_ chinese_dream_institutional_changes_of...
[Zhao kejin and_gao_xin_pursuing_ the_ chinese_dream_institutional_changes_of...[Zhao kejin and_gao_xin_pursuing_ the_ chinese_dream_institutional_changes_of...
[Zhao kejin and_gao_xin_pursuing_ the_ chinese_dream_institutional_changes_of...ngocjos
 
Vitranss2 final seminar-en
Vitranss2 final seminar-enVitranss2 final seminar-en
Vitranss2 final seminar-enngocjos
 
Grhs.2013.case .study .hanoi_.viet_.nam_
Grhs.2013.case .study .hanoi_.viet_.nam_Grhs.2013.case .study .hanoi_.viet_.nam_
Grhs.2013.case .study .hanoi_.viet_.nam_ngocjos
 
Giz selection of nama for vietnam transport-sector
Giz selection of nama for vietnam transport-sectorGiz selection of nama for vietnam transport-sector
Giz selection of nama for vietnam transport-sectorngocjos
 
A timeline of relations between cuba and the us
A timeline of relations between cuba and the usA timeline of relations between cuba and the us
A timeline of relations between cuba and the usngocjos
 
Decoding china’s emerging “great power” strategy in asia
Decoding china’s emerging “great power” strategy in asiaDecoding china’s emerging “great power” strategy in asia
Decoding china’s emerging “great power” strategy in asiangocjos
 
Boston consulting group’s 2014 global wealth report
Boston consulting group’s 2014 global wealth reportBoston consulting group’s 2014 global wealth report
Boston consulting group’s 2014 global wealth reportngocjos
 
Vodafone law enforcement_disclosure_report_june 2014
Vodafone law enforcement_disclosure_report_june 2014Vodafone law enforcement_disclosure_report_june 2014
Vodafone law enforcement_disclosure_report_june 2014ngocjos
 
National security&accelerating risks of climate change may 2014
National security&accelerating risks of climate change may 2014National security&accelerating risks of climate change may 2014
National security&accelerating risks of climate change may 2014ngocjos
 
Mass for the city
Mass for the cityMass for the city
Mass for the cityngocjos
 
2005.04.04.cpp.project.management.adb
2005.04.04.cpp.project.management.adb2005.04.04.cpp.project.management.adb
2005.04.04.cpp.project.management.adbngocjos
 
Facts and figures on eu china trade
Facts and figures on eu china tradeFacts and figures on eu china trade
Facts and figures on eu china tradengocjos
 
Global Risks Report 2014
Global Risks Report 2014Global Risks Report 2014
Global Risks Report 2014ngocjos
 
Making saints
Making saintsMaking saints
Making saintsngocjos
 
Media and technology
Media and technology Media and technology
Media and technology ngocjos
 
English grammar book_-_pictures_for_writing
English grammar book_-_pictures_for_writingEnglish grammar book_-_pictures_for_writing
English grammar book_-_pictures_for_writingngocjos
 

More from ngocjos (20)

Panama papers offshore assets of world leaders revealed by leak
Panama papers   offshore assets of world leaders revealed by leakPanama papers   offshore assets of world leaders revealed by leak
Panama papers offshore assets of world leaders revealed by leak
 
Streets of gold uk's most expensive addresses
Streets of gold   uk's most expensive addressesStreets of gold   uk's most expensive addresses
Streets of gold uk's most expensive addresses
 
Case studies in improving urban air quality
Case studies in improving urban air qualityCase studies in improving urban air quality
Case studies in improving urban air quality
 
Global carbon-pricing-we-will-if-you-will book
Global carbon-pricing-we-will-if-you-will bookGlobal carbon-pricing-we-will-if-you-will book
Global carbon-pricing-we-will-if-you-will book
 
[Zhao kejin and_gao_xin_pursuing_ the_ chinese_dream_institutional_changes_of...
[Zhao kejin and_gao_xin_pursuing_ the_ chinese_dream_institutional_changes_of...[Zhao kejin and_gao_xin_pursuing_ the_ chinese_dream_institutional_changes_of...
[Zhao kejin and_gao_xin_pursuing_ the_ chinese_dream_institutional_changes_of...
 
Vitranss2 final seminar-en
Vitranss2 final seminar-enVitranss2 final seminar-en
Vitranss2 final seminar-en
 
Grhs.2013.case .study .hanoi_.viet_.nam_
Grhs.2013.case .study .hanoi_.viet_.nam_Grhs.2013.case .study .hanoi_.viet_.nam_
Grhs.2013.case .study .hanoi_.viet_.nam_
 
Giz selection of nama for vietnam transport-sector
Giz selection of nama for vietnam transport-sectorGiz selection of nama for vietnam transport-sector
Giz selection of nama for vietnam transport-sector
 
A timeline of relations between cuba and the us
A timeline of relations between cuba and the usA timeline of relations between cuba and the us
A timeline of relations between cuba and the us
 
Decoding china’s emerging “great power” strategy in asia
Decoding china’s emerging “great power” strategy in asiaDecoding china’s emerging “great power” strategy in asia
Decoding china’s emerging “great power” strategy in asia
 
Boston consulting group’s 2014 global wealth report
Boston consulting group’s 2014 global wealth reportBoston consulting group’s 2014 global wealth report
Boston consulting group’s 2014 global wealth report
 
Vodafone law enforcement_disclosure_report_june 2014
Vodafone law enforcement_disclosure_report_june 2014Vodafone law enforcement_disclosure_report_june 2014
Vodafone law enforcement_disclosure_report_june 2014
 
National security&accelerating risks of climate change may 2014
National security&accelerating risks of climate change may 2014National security&accelerating risks of climate change may 2014
National security&accelerating risks of climate change may 2014
 
Mass for the city
Mass for the cityMass for the city
Mass for the city
 
2005.04.04.cpp.project.management.adb
2005.04.04.cpp.project.management.adb2005.04.04.cpp.project.management.adb
2005.04.04.cpp.project.management.adb
 
Facts and figures on eu china trade
Facts and figures on eu china tradeFacts and figures on eu china trade
Facts and figures on eu china trade
 
Global Risks Report 2014
Global Risks Report 2014Global Risks Report 2014
Global Risks Report 2014
 
Making saints
Making saintsMaking saints
Making saints
 
Media and technology
Media and technology Media and technology
Media and technology
 
English grammar book_-_pictures_for_writing
English grammar book_-_pictures_for_writingEnglish grammar book_-_pictures_for_writing
English grammar book_-_pictures_for_writing
 

Recently uploaded

VIP Model Call Girls Hadapsar ( Pune ) Call ON 8005736733 Starting From 5K to...
VIP Model Call Girls Hadapsar ( Pune ) Call ON 8005736733 Starting From 5K to...VIP Model Call Girls Hadapsar ( Pune ) Call ON 8005736733 Starting From 5K to...
VIP Model Call Girls Hadapsar ( Pune ) Call ON 8005736733 Starting From 5K to...SUHANI PANDEY
 
Call Girls In Bloom Boutique | GK-1 ☎ 9990224454 High Class Delhi NCR 24 Hour...
Call Girls In Bloom Boutique | GK-1 ☎ 9990224454 High Class Delhi NCR 24 Hour...Call Girls In Bloom Boutique | GK-1 ☎ 9990224454 High Class Delhi NCR 24 Hour...
Call Girls In Bloom Boutique | GK-1 ☎ 9990224454 High Class Delhi NCR 24 Hour...rajputriyana310
 
CSR_Module5_Green Earth Initiative, Tree Planting Day
CSR_Module5_Green Earth Initiative, Tree Planting DayCSR_Module5_Green Earth Initiative, Tree Planting Day
CSR_Module5_Green Earth Initiative, Tree Planting DayGeorgeDiamandis11
 
Call Now ☎ Russian Call Girls Connaught Place @ 9899900591 # Russian Escorts ...
Call Now ☎ Russian Call Girls Connaught Place @ 9899900591 # Russian Escorts ...Call Now ☎ Russian Call Girls Connaught Place @ 9899900591 # Russian Escorts ...
Call Now ☎ Russian Call Girls Connaught Place @ 9899900591 # Russian Escorts ...kauryashika82
 
Call Girls Moshi Call Me 7737669865 Budget Friendly No Advance Booking
Call Girls Moshi Call Me 7737669865 Budget Friendly No Advance BookingCall Girls Moshi Call Me 7737669865 Budget Friendly No Advance Booking
Call Girls Moshi Call Me 7737669865 Budget Friendly No Advance Bookingroncy bisnoi
 
Training Of Trainers FAI Eng. Basel Tilapia Welfare.pdf
Training Of Trainers FAI Eng. Basel Tilapia Welfare.pdfTraining Of Trainers FAI Eng. Basel Tilapia Welfare.pdf
Training Of Trainers FAI Eng. Basel Tilapia Welfare.pdfBasel Ahmed
 
Call Girl Nagpur Roshni Call 7001035870 Meet With Nagpur Escorts
Call Girl Nagpur Roshni Call 7001035870 Meet With Nagpur EscortsCall Girl Nagpur Roshni Call 7001035870 Meet With Nagpur Escorts
Call Girl Nagpur Roshni Call 7001035870 Meet With Nagpur EscortsCall Girls in Nagpur High Profile
 
VIP Model Call Girls Wagholi ( Pune ) Call ON 8005736733 Starting From 5K to ...
VIP Model Call Girls Wagholi ( Pune ) Call ON 8005736733 Starting From 5K to ...VIP Model Call Girls Wagholi ( Pune ) Call ON 8005736733 Starting From 5K to ...
VIP Model Call Girls Wagholi ( Pune ) Call ON 8005736733 Starting From 5K to ...SUHANI PANDEY
 
Call Girls Talegaon Dabhade Call Me 7737669865 Budget Friendly No Advance Boo...
Call Girls Talegaon Dabhade Call Me 7737669865 Budget Friendly No Advance Boo...Call Girls Talegaon Dabhade Call Me 7737669865 Budget Friendly No Advance Boo...
Call Girls Talegaon Dabhade Call Me 7737669865 Budget Friendly No Advance Boo...roncy bisnoi
 
VIP Model Call Girls Bhosari ( Pune ) Call ON 8005736733 Starting From 5K to ...
VIP Model Call Girls Bhosari ( Pune ) Call ON 8005736733 Starting From 5K to ...VIP Model Call Girls Bhosari ( Pune ) Call ON 8005736733 Starting From 5K to ...
VIP Model Call Girls Bhosari ( Pune ) Call ON 8005736733 Starting From 5K to ...SUHANI PANDEY
 
Proposed Amendments to Chapter 15, Article X: Wetland Conservation Areas
Proposed Amendments to Chapter 15, Article X: Wetland Conservation AreasProposed Amendments to Chapter 15, Article X: Wetland Conservation Areas
Proposed Amendments to Chapter 15, Article X: Wetland Conservation Areas💥Victoria K. Colangelo
 
VIP Model Call Girls Chakan ( Pune ) Call ON 8005736733 Starting From 5K to 2...
VIP Model Call Girls Chakan ( Pune ) Call ON 8005736733 Starting From 5K to 2...VIP Model Call Girls Chakan ( Pune ) Call ON 8005736733 Starting From 5K to 2...
VIP Model Call Girls Chakan ( Pune ) Call ON 8005736733 Starting From 5K to 2...SUHANI PANDEY
 
BOOK Call Girls in (Dwarka) CALL | 8377087607 Delhi Escorts Services
BOOK Call Girls in (Dwarka) CALL | 8377087607 Delhi Escorts ServicesBOOK Call Girls in (Dwarka) CALL | 8377087607 Delhi Escorts Services
BOOK Call Girls in (Dwarka) CALL | 8377087607 Delhi Escorts Servicesdollysharma2066
 
Hot Call Girls |Delhi |Preet Vihar ☎ 9711199171 Book Your One night Stand
Hot Call Girls |Delhi |Preet Vihar ☎ 9711199171 Book Your One night StandHot Call Girls |Delhi |Preet Vihar ☎ 9711199171 Book Your One night Stand
Hot Call Girls |Delhi |Preet Vihar ☎ 9711199171 Book Your One night Standkumarajju5765
 
Alandi Road ( Call Girls ) Pune 6297143586 Hot Model With Sexy Bhabi Ready ...
Alandi Road ( Call Girls ) Pune  6297143586  Hot Model With Sexy Bhabi Ready ...Alandi Road ( Call Girls ) Pune  6297143586  Hot Model With Sexy Bhabi Ready ...
Alandi Road ( Call Girls ) Pune 6297143586 Hot Model With Sexy Bhabi Ready ...tanu pandey
 
VIP Model Call Girls Viman Nagar ( Pune ) Call ON 8005736733 Starting From 5K...
VIP Model Call Girls Viman Nagar ( Pune ) Call ON 8005736733 Starting From 5K...VIP Model Call Girls Viman Nagar ( Pune ) Call ON 8005736733 Starting From 5K...
VIP Model Call Girls Viman Nagar ( Pune ) Call ON 8005736733 Starting From 5K...SUHANI PANDEY
 
Get Premium Hoskote Call Girls (8005736733) 24x7 Rate 15999 with A/c Room Cas...
Get Premium Hoskote Call Girls (8005736733) 24x7 Rate 15999 with A/c Room Cas...Get Premium Hoskote Call Girls (8005736733) 24x7 Rate 15999 with A/c Room Cas...
Get Premium Hoskote Call Girls (8005736733) 24x7 Rate 15999 with A/c Room Cas...MOHANI PANDEY
 
Call On 6297143586 Pimpri Chinchwad Call Girls In All Pune 24/7 Provide Call...
Call On 6297143586  Pimpri Chinchwad Call Girls In All Pune 24/7 Provide Call...Call On 6297143586  Pimpri Chinchwad Call Girls In All Pune 24/7 Provide Call...
Call On 6297143586 Pimpri Chinchwad Call Girls In All Pune 24/7 Provide Call...tanu pandey
 
Types of Pollution Powerpoint presentation
Types of Pollution Powerpoint presentationTypes of Pollution Powerpoint presentation
Types of Pollution Powerpoint presentationmarygraceaque1
 

Recently uploaded (20)

VIP Model Call Girls Hadapsar ( Pune ) Call ON 8005736733 Starting From 5K to...
VIP Model Call Girls Hadapsar ( Pune ) Call ON 8005736733 Starting From 5K to...VIP Model Call Girls Hadapsar ( Pune ) Call ON 8005736733 Starting From 5K to...
VIP Model Call Girls Hadapsar ( Pune ) Call ON 8005736733 Starting From 5K to...
 
Call Girls In Bloom Boutique | GK-1 ☎ 9990224454 High Class Delhi NCR 24 Hour...
Call Girls In Bloom Boutique | GK-1 ☎ 9990224454 High Class Delhi NCR 24 Hour...Call Girls In Bloom Boutique | GK-1 ☎ 9990224454 High Class Delhi NCR 24 Hour...
Call Girls In Bloom Boutique | GK-1 ☎ 9990224454 High Class Delhi NCR 24 Hour...
 
CSR_Module5_Green Earth Initiative, Tree Planting Day
CSR_Module5_Green Earth Initiative, Tree Planting DayCSR_Module5_Green Earth Initiative, Tree Planting Day
CSR_Module5_Green Earth Initiative, Tree Planting Day
 
9953056974 ,Low Rate Call Girls In Adarsh Nagar Delhi 24hrs Available
9953056974 ,Low Rate Call Girls In Adarsh Nagar  Delhi 24hrs Available9953056974 ,Low Rate Call Girls In Adarsh Nagar  Delhi 24hrs Available
9953056974 ,Low Rate Call Girls In Adarsh Nagar Delhi 24hrs Available
 
Call Now ☎ Russian Call Girls Connaught Place @ 9899900591 # Russian Escorts ...
Call Now ☎ Russian Call Girls Connaught Place @ 9899900591 # Russian Escorts ...Call Now ☎ Russian Call Girls Connaught Place @ 9899900591 # Russian Escorts ...
Call Now ☎ Russian Call Girls Connaught Place @ 9899900591 # Russian Escorts ...
 
Call Girls Moshi Call Me 7737669865 Budget Friendly No Advance Booking
Call Girls Moshi Call Me 7737669865 Budget Friendly No Advance BookingCall Girls Moshi Call Me 7737669865 Budget Friendly No Advance Booking
Call Girls Moshi Call Me 7737669865 Budget Friendly No Advance Booking
 
Training Of Trainers FAI Eng. Basel Tilapia Welfare.pdf
Training Of Trainers FAI Eng. Basel Tilapia Welfare.pdfTraining Of Trainers FAI Eng. Basel Tilapia Welfare.pdf
Training Of Trainers FAI Eng. Basel Tilapia Welfare.pdf
 
Call Girl Nagpur Roshni Call 7001035870 Meet With Nagpur Escorts
Call Girl Nagpur Roshni Call 7001035870 Meet With Nagpur EscortsCall Girl Nagpur Roshni Call 7001035870 Meet With Nagpur Escorts
Call Girl Nagpur Roshni Call 7001035870 Meet With Nagpur Escorts
 
VIP Model Call Girls Wagholi ( Pune ) Call ON 8005736733 Starting From 5K to ...
VIP Model Call Girls Wagholi ( Pune ) Call ON 8005736733 Starting From 5K to ...VIP Model Call Girls Wagholi ( Pune ) Call ON 8005736733 Starting From 5K to ...
VIP Model Call Girls Wagholi ( Pune ) Call ON 8005736733 Starting From 5K to ...
 
Call Girls Talegaon Dabhade Call Me 7737669865 Budget Friendly No Advance Boo...
Call Girls Talegaon Dabhade Call Me 7737669865 Budget Friendly No Advance Boo...Call Girls Talegaon Dabhade Call Me 7737669865 Budget Friendly No Advance Boo...
Call Girls Talegaon Dabhade Call Me 7737669865 Budget Friendly No Advance Boo...
 
VIP Model Call Girls Bhosari ( Pune ) Call ON 8005736733 Starting From 5K to ...
VIP Model Call Girls Bhosari ( Pune ) Call ON 8005736733 Starting From 5K to ...VIP Model Call Girls Bhosari ( Pune ) Call ON 8005736733 Starting From 5K to ...
VIP Model Call Girls Bhosari ( Pune ) Call ON 8005736733 Starting From 5K to ...
 
Proposed Amendments to Chapter 15, Article X: Wetland Conservation Areas
Proposed Amendments to Chapter 15, Article X: Wetland Conservation AreasProposed Amendments to Chapter 15, Article X: Wetland Conservation Areas
Proposed Amendments to Chapter 15, Article X: Wetland Conservation Areas
 
VIP Model Call Girls Chakan ( Pune ) Call ON 8005736733 Starting From 5K to 2...
VIP Model Call Girls Chakan ( Pune ) Call ON 8005736733 Starting From 5K to 2...VIP Model Call Girls Chakan ( Pune ) Call ON 8005736733 Starting From 5K to 2...
VIP Model Call Girls Chakan ( Pune ) Call ON 8005736733 Starting From 5K to 2...
 
BOOK Call Girls in (Dwarka) CALL | 8377087607 Delhi Escorts Services
BOOK Call Girls in (Dwarka) CALL | 8377087607 Delhi Escorts ServicesBOOK Call Girls in (Dwarka) CALL | 8377087607 Delhi Escorts Services
BOOK Call Girls in (Dwarka) CALL | 8377087607 Delhi Escorts Services
 
Hot Call Girls |Delhi |Preet Vihar ☎ 9711199171 Book Your One night Stand
Hot Call Girls |Delhi |Preet Vihar ☎ 9711199171 Book Your One night StandHot Call Girls |Delhi |Preet Vihar ☎ 9711199171 Book Your One night Stand
Hot Call Girls |Delhi |Preet Vihar ☎ 9711199171 Book Your One night Stand
 
Alandi Road ( Call Girls ) Pune 6297143586 Hot Model With Sexy Bhabi Ready ...
Alandi Road ( Call Girls ) Pune  6297143586  Hot Model With Sexy Bhabi Ready ...Alandi Road ( Call Girls ) Pune  6297143586  Hot Model With Sexy Bhabi Ready ...
Alandi Road ( Call Girls ) Pune 6297143586 Hot Model With Sexy Bhabi Ready ...
 
VIP Model Call Girls Viman Nagar ( Pune ) Call ON 8005736733 Starting From 5K...
VIP Model Call Girls Viman Nagar ( Pune ) Call ON 8005736733 Starting From 5K...VIP Model Call Girls Viman Nagar ( Pune ) Call ON 8005736733 Starting From 5K...
VIP Model Call Girls Viman Nagar ( Pune ) Call ON 8005736733 Starting From 5K...
 
Get Premium Hoskote Call Girls (8005736733) 24x7 Rate 15999 with A/c Room Cas...
Get Premium Hoskote Call Girls (8005736733) 24x7 Rate 15999 with A/c Room Cas...Get Premium Hoskote Call Girls (8005736733) 24x7 Rate 15999 with A/c Room Cas...
Get Premium Hoskote Call Girls (8005736733) 24x7 Rate 15999 with A/c Room Cas...
 
Call On 6297143586 Pimpri Chinchwad Call Girls In All Pune 24/7 Provide Call...
Call On 6297143586  Pimpri Chinchwad Call Girls In All Pune 24/7 Provide Call...Call On 6297143586  Pimpri Chinchwad Call Girls In All Pune 24/7 Provide Call...
Call On 6297143586 Pimpri Chinchwad Call Girls In All Pune 24/7 Provide Call...
 
Types of Pollution Powerpoint presentation
Types of Pollution Powerpoint presentationTypes of Pollution Powerpoint presentation
Types of Pollution Powerpoint presentation
 

Climate change impact and adaptation study in the mekong delta

  • 1. Technical Assistance Consultant’s Final Report This consultant’s report does not necessarily reflect the views of ADB or the Government concerned, and ADB and the Government cannot be held liable for its contents. (For project preparatory technical assistance: All the views expressed herein may not be incorporated into the proposed project’s design. Project Number: 43295 December 2011 Socialist Republic of Viet Nam: Climate Change Impact and Adaptation Study in the Mekong Delta (Cofinanced by the Climate Change Fund and the Government of Australia) Prepared by Peter Mackay and Michael Russell Sinclair Knight Merz (SKM) Melbourne, Australia For Vietnam Institute of Meteorology, Hydrology and Environment (IMHEN), the Ca Mau Peoples Committee and the Kien Giang Peoples Committee
  • 2. Ca Mau Peoples Committee Institute of Meteorology, Hydrology and Environment Climate Change Impact and Adaptation Study in The Mekong Delta – Part A Final Report Kien Giang Peoples Committee Climate Change Vulnerability & Risk Assessment Study for Ca Mau and Kien Giang Provinces, Vietnam
  • 3. Ca Mau Peoples Committee Kien Giang Peoples Committee Institute of Meteorology, Hydrology and Environment Climate Change Impact and Adaptation Study in The Mekong Delta – Part A Final Report Climate Change Vulnerability & Risk Assessment Study for Ca Mau and Kien Giang Provinces, Vietnam December 2011
  • 4. Climate Change Impact and Adaptation Study in Mekong Delta – Part A PAGE i FOREWORD
  • 5. Climate Change Impact and Adaptation Study in Mekong Delta – Part A PAGE i CONTENTS ABBREVIATIONS AND ACRONYMS ........................................................................................................... VII KEY TERMS.................................................................................................................................................IX EXECUTIVE SUMMARY ................................................................................................................................X 1. INTRODUCTION ..................................................................................................................................1 1.1 PURPOSE OF THIS STUDY .........................................................................................................................1 1.2 THE REGIONAL CONTEXT.........................................................................................................................1 1.2.1 The Mekong Delta ........................................................................................................................3 1.2.2 Socio-Economic Context ...............................................................................................................4 1.2.3 Sectoral Growth and Diversification.............................................................................................4 1.2.4 The Agriculture Sector ..................................................................................................................6 1.2.5 Industry Sector..............................................................................................................................7 1.2.6 Energy Sector................................................................................................................................8 1.2.7 Urban Settlements........................................................................................................................9 1.2.8 Transport ......................................................................................................................................9 2. CVRA APPROACH AND METHODOLOGY............................................................................................11 2.1 CONCEPTUAL FRAMEWORK ...................................................................................................................11 2.2 EVALUATING VULNERABILITIES ...............................................................................................................13 2.2.1 Key Sectors .................................................................................................................................14 2.2.2 Vulnerability Indicators ..............................................................................................................15 2.2.3 Analysing Adaptive Capacity ......................................................................................................18 2.2.4 Control Measures .......................................................................................................................19 2.2.5 Vulnerability Profiles ..................................................................................................................20 2.2.6 Mapping Vulnerability................................................................................................................21 2.2.7 The Adaptation Assessment Process ..........................................................................................22 2.3 IDENTIFYING AND ANALYSING FUTURE RISK ..............................................................................................24 3. CLIMATE CHANGE.............................................................................................................................28 3.1 CLIMATE IN THE MEKONG DELTA............................................................................................................28 3.1.1 Observed Changes......................................................................................................................28 3.2 GLOBAL CLIMATE CHANGE ....................................................................................................................34 3.2.1 Climate Change and Emission Scenarios ....................................................................................34 3.3 CLIMATE MODELS AND DOWNSCALING....................................................................................................35 3.3.1 Modelling used in the Project.....................................................................................................36 3.4 FUTURE CLIMATE CHANGE SCENARIOS (2030 AND 2050) ..........................................................................40 3.4.1 Temperature...............................................................................................................................40 3.4.2 Rainfall .......................................................................................................................................41 3.4.3 Sea Level Rise..............................................................................................................................43 3.4.4 Wind Speed.................................................................................................................................44 3.4.5 Other Climatic Factors................................................................................................................44 3.4.6 Model Discrepancies...................................................................................................................45 3.5 CLIMATE CHANGE IMPACT ASSESSMENTS ..................................................................................................45 3.5.1 Hydrology and water resources..................................................................................................45 3.5.2 Coastal impacts ..........................................................................................................................46 4. CA MAU PROVINCE...........................................................................................................................47 4.1 POPULATION AND PEOPLE .....................................................................................................................47 4.1.1 Socially Vulnerable Groups.........................................................................................................51 4.1.2 Poverty Incidence .......................................................................................................................52 4.1.3 Unemployment...........................................................................................................................53 4.1.4 Health.........................................................................................................................................53
  • 6. Climate Change Impact and Adaptation Study in Mekong Delta – Part A PAGE ii 4.1.5 Education....................................................................................................................................55 4.2 PROVINCIAL DEVELOPMENT CONTEXT......................................................................................................56 4.3 LANDUSE ...........................................................................................................................................57 4.4 AGRICULTURE .....................................................................................................................................59 4.4.1 Cropping and Livestock...............................................................................................................59 4.4.2 Aquaculture................................................................................................................................60 4.4.3 Fisheries......................................................................................................................................61 4.4.4 Water resources .........................................................................................................................62 4.4.5 Natural areas, biodiversity and forests ......................................................................................62 4.5 INDUSTRY...........................................................................................................................................63 4.5.1 Seafood Processing.....................................................................................................................63 4.5.2 Ship Building...............................................................................................................................64 4.5.3 Other Industrial Sectors..............................................................................................................65 4.5.4 Tourism.......................................................................................................................................66 4.6 ENERGY .............................................................................................................................................67 4.6.1 Ca Mau Gas-Power-Fertilizer Complex.......................................................................................67 4.6.2 Electricity Transmission and Distribution System.......................................................................69 4.6.3 Other Energy Sources .................................................................................................................72 4.7 TRANSPORT SYSTEM.............................................................................................................................73 4.7.1 Roads..........................................................................................................................................76 4.7.2 Airports.......................................................................................................................................76 4.8 URBAN SETTLEMENTS...........................................................................................................................77 4.8.1 Urban Utilities.............................................................................................................................78 5. KIEN GIANG PROVINCE .....................................................................................................................81 5.1 POPULATION AND PEOPLE .....................................................................................................................81 5.1.1 Socially Vulnerable Groups.........................................................................................................86 5.2 PROVINCIAL DEVELOPMENT CONTEXT......................................................................................................90 5.3 LANDUSE ...........................................................................................................................................92 5.4 AGRICULTURE .....................................................................................................................................92 5.4.1 Cropping and Livestock...............................................................................................................94 5.4.2 Aquaculture and Fisheries ..........................................................................................................95 5.4.3 Fisheries......................................................................................................................................96 5.4.4 Water resources .........................................................................................................................98 5.4.5 Natural areas, biodiversity and forests ......................................................................................99 5.5 INDUSTRY.........................................................................................................................................100 5.5.1 Construction Materials Manufacturing....................................................................................101 5.5.2 Seafood Processing...................................................................................................................103 5.5.3 Tourism.....................................................................................................................................104 5.5.4 Other Industries........................................................................................................................104 5.6 ENERGY ...........................................................................................................................................106 5.6.1 Future Plans..............................................................................................................................108 5.7 TRANSPORT ......................................................................................................................................110 5.7.1 Roads and Ports........................................................................................................................111 5.8 URBAN SETTLEMENTS.........................................................................................................................111 5.8.1 Urban Utilities...........................................................................................................................111 5.8.2 Urban Drainage, Sewage Disposal and Solid Waste ................................................................112 6. EFFECTS ON NATURAL SYSTEMS .....................................................................................................114 6.1 THE EFFECTS OF SEA LEVEL RISE ...........................................................................................................114 6.2 THE EFFECTS OF FLOODING AND INUNDATION.........................................................................................114 6.3 THE EFFECTS OF DROUGHT..................................................................................................................123 6.4 EFFECTS OF SALINITY AND SALINE INTRUSION..........................................................................................123 6.5 EFFECTS OF TYPHOONS AND STORM SURGE ............................................................................................128 6.5.1 Exposure to Typhoons...............................................................................................................128
  • 7. Climate Change Impact and Adaptation Study in Mekong Delta – Part A PAGE iii 6.5.2 Typhoon Simulations ................................................................................................................130 6.5.3 Storm Surge..............................................................................................................................131 6.6 COASTAL SEDIMENTATION AND EROSION ...............................................................................................132 6.6.2 Effects on Coastal Conditions ...................................................................................................134 6.6.3 Other Effects.............................................................................................................................137 6.7 SYNTHESIS OF THE CLIMATE CHANGE IMPACTS ON NATURAL SYSTEMS.........................................................138 7. VULNERABILITY, RISK AND HOTSPOT ANALYSIS..............................................................................140 7.1 VULNERABILITY..................................................................................................................................140 7.1.1 Population Vulnerability...........................................................................................................141 7.1.2 Poverty Vulnerability ................................................................................................................145 7.1.3 Agriculture and Livelihoods Vulnerability.................................................................................149 7.1.4 Industry and Energy Vulnerability ............................................................................................159 7.1.5 Urban Settlements and Transport Vulnerability.......................................................................166 7.2 RISKS...............................................................................................................................................175 7.2.1 Population; Hotspots................................................................................................................176 7.2.2 Poverty; Hotspots .....................................................................................................................177 7.2.3 Agriculture and Livelihoods; Hotspots......................................................................................178 7.2.4 Industry and Energy Impacts, Hotspots....................................................................................180 7.2.5 Urban Settlements and Transport; Hotspots............................................................................181 7.2.6 Summary of District and Sectoral Hotspots..............................................................................182 7.3 SYNTHESIS OF REGIONAL VULNERABILITIES .............................................................................................184 8. INSTITUTIONAL CAPACITY...............................................................................................................187 8.1 NATIONAL INSTITUTIONS.....................................................................................................................187 8.1.1 Agriculture and Natural Resource Management .....................................................................187 8.1.2 Infrastructure Planning.............................................................................................................188 8.2 NATIONAL PLANS AND PROJECTIONS .....................................................................................................189 8.2.1 The National Target Program...................................................................................................189 8.2.2 Sectoral Plans ...........................................................................................................................190 8.2.3 Disaster management ..............................................................................................................194 8.3 PROVINCIAL DEPARTMENTS .................................................................................................................196 8.3.2 Urban Settlements and Transport ............................................................................................197 8.3.3 Industry and energy sector.......................................................................................................198 8.4 DISTRICT LEVEL .................................................................................................................................200 8.4.1 Agriculture and Livelihood........................................................................................................200 8.4.2 Urban Settlements and Transport ............................................................................................201 8.5 SURVEY RESULTS ...............................................................................................................................201 8.6 LOCAL LEVEL.....................................................................................................................................203 8.7 SUMMARY OF INSTITUTIONAL CAPACITY IN THE AREA OF CLIMATE CHANGE ADAPTATION ..................................204 8.7.1 Measures of Capacity ...............................................................................................................205 9. KEY FINDINGS & RECOMMENDATIONS...........................................................................................207 9.1 CLIMATE CHANGE PROJECTIONS ...........................................................................................................207 9.1.1 Climate parameters..................................................................................................................207 9.1.2 Sea Level Rise & Inundation......................................................................................................207 9.2 VULNERABILITY TO CLIMATE CHANGE ....................................................................................................207 9.2.1 Sea Level Rise & Storm Surge ...................................................................................................208 9.2.2 Increased Damage to Coastal Areas.........................................................................................208 9.2.3 Risks to Population and People ................................................................................................208 9.2.4 Risks to Agriculture and Livelihoods.........................................................................................209 9.2.5 Risks to Urban Settlements & Transport ..................................................................................210 9.2.6 Risks to Industry and Energy.....................................................................................................212 9.2.7 Uncertainties & Unexpected Events .........................................................................................213 9.3 FUTURE CHALLENGES .........................................................................................................................214
  • 8. Climate Change Impact and Adaptation Study in Mekong Delta – Part A PAGE iv 9.4 SUGGESTED ADAPTATION THEMES........................................................................................................214 10. REFERENCES ...............................................................................................................................217 11. APPENDICES ...............................................................................................................................221 APPENDIX 1. SUGGESTED VULNERABILITY INDICATORS AS RECOMMENDED BY INTERNATIONAL EXPERTS. .........................221 APPENDIX 2. SUMMARY CLIMATE VULNERABILITY ASSESSMENT – INDUSTRY ASSETS ...................................................224 APPENDIX 3. SUMMARY CLIMATE VULNERABILITY ASSESSMENT – ENERGY ASSETS......................................................225 APPENDIX 4. EXTREME PRECIPITATION EVENT ANALYSIS BASED ON GCM DAILY DATA...................................................227 APPENDIX 5. DETAILS OF MEETINGS WITH PROVINCE OFFICIALS ..............................................................................231 APPENDIX 6. DETAILS OF WORKSHOP PARTICIPANTS .............................................................................................237 APPENDIX 7. OTHER ADAPTATION PROJECTS IN THE DELTA.....................................................................................239 APPENDIX 8. TA AND CONSULTANT TORS...........................................................................................................242
  • 9. Climate Change Impact and Adaptation Study in Mekong Delta – Part A v | P a g e ACKNOWLEDGEMENTS The Asian Development Bank (ADB) engaged Sinclair Knight Merz (SKM), in association with the Center for Environmental Research (CENRE) under the Vietnam Institute of Meteorology, Hydrology and Environment (IMHEN), Acclimatise and University of Newcastle, Australia to undertake ‘Part A’ of the AusAID funded Climate Change Impact and Adaptation Study in the Mekong Delta (TA 7377 – VIE). This report presents information from Ca Mau and Kien Giang provinces together with modelling and GIS outputs from IMHEN. Provincial and district authorities supplied intensive survey data and made staff available for interviews. The Kien Giang PPC and the Ca Mau PPC and district departments contributed to the inception and mid project workshops. The department of DARD in Ca Mau and the Departments of DARD and DONRE in Kien Giang allocated contact persons who organized data and accompanied team members on trips to visit key locations/projects relating to the subject of the working paper. The report was compiled by Peter Mackay and Michael Russell and relies heavily on working papers produced by the international assessment experts. The report represents a considerable effort from a dedicated team: Peter Mackay Team Leader SKM Duong Hong Son Deputy Team Leader IMHEN Michael Russell CC Assessment Specialist (Agriculture & Natural Resources) ; Data Coordinator; Atlas Editor SKM Hoang Minh Tuyen CC Assessment Specialist (Agriculture & Natural Resources) IMHEN Hoang Duc Cuong Climate Change Prediction Modeller IMHEN Dam Duy Hung Climate Change Prediction Modeller IMHEN Anthony Kiem Climate Change Prediction Modeller University of Newcastle Hoang Van Dai GIS Expert IMHEN Ian Hamilton CC Assessment Specialist (Transport & Urban Planning) SKM Dinh Thai Hung CC Assessment Specialist (Transport & Urban Planning) IMHEN Frank Pool CC Assessment Specialist (Energy & Industry) SKM Tran Thi Dieu Hang CC Assessment Specialist (Energy & Industry) IMHEN Ronny Venegas Carbonell CC Assessment Specialist (Socio-Economic Issues) SKM Ngo Thi Van Anh CC Assessment Specialist (Socio-Economic Issues) IMHEN Nguyen Thi Hang Nga Secretary IMHEN Le Ha Phuong Interpreter/Translator IMHEN Lucinda Phelps Assistant Coordinator SKM Sonya Sampson SKM Project Manager SKM Aman Mehta SKM Project Director SKM Nguyet Mai Administrator IMHEN Cover Photo; M. Russell.
  • 10. Climate Change Impact and Adaptation Study in Mekong Delta – Part A vi | P a g e DISCLAIMER This report was prepared by agents on behalf of Vietnam Institute of Meteorology, Hydrology and Environment (IMHEN), The Ca Mau Peoples Committee and The Kien Giang Peoples Committee through The Asian Development Bank. Although all effort is made to ensure that the information, opinions and analysis contained in this document are based on sources believed to be reliable - no representation, expressed or implied, is made guaranteeing accuracy, completeness or correctness. The boundaries, colours, denominations, and other information shown on any map in this work do not imply any judgment on the part of the Authors concerning the legal status of any territory or the endorsement or acceptance of such boundaries. Neither Australian Aid; Asian Development Bank; IMHEN; Ca Mau PPC; Kien Giang PPC nor any agency thereof; their employees; contractors; subcontractors or their employees; assumes any legal liability or responsibility for the consequences of any third party’s use of the information, opinions and analysis contained in this report. Cite as IMHEN, Ca Mau Peoples Committee, and Kien Giang Peoples Committee (2011). Climate Change Impact and Adaptation Study in The Mekong Delta – Part A Final Report: Climate Change Vulnerability and Risk Assessment Study for Ca Mau and Kien Giang Provinces, Vietnam. Institute of Meteorology, Hydrology and Environment (IMHEN), Hanoi, Vietnam.
  • 11. Climate Change Impact and Adaptation Study in Mekong Delta – Part A vii | P a g e Abbreviations and Acronyms ADB Asian Development Bank AusAID Australian Agency for International Development CCFSC Central Committee for Flood and Storm Control CENRE Center for Environmental Research (Under IMHEN) CRU Climate Research Unit CSIRO Commonwealth Scientific & Industrial Research Organisation (Australia) DARD Department of Agriculture and Rural Development DDMFSC Department of Dyke Management and Flood and Storm Control DOIT Department of Industry and Trade DONRE Department of Natural Resources and Environment DoPI Department of Planning and Investment DOST Department of Science and Technology DOT Department of Transport DWRM Department of Water Resource Management ENSO El Nino-Southern Oscillation FAO Food and Agriculture Organization FICEN Fisheries Information Centre FMMP The MRC’s Flood Management and Mitigation Program GIS Geographic Information System GIZ Deutsche Gesellschaft für Internationale Zusammenarbeit IMHEN Institute of Meteorology, Hydrology and Environment IPCC Intergovernmental Panel on Climate Change IRRI International Rice Research Institute JICA Japanese International Cooperation Agency MARD Ministry of Agriculture and Rural Development (Viet Nam) MoC Ministry of Construction MoF Ministry of Finance MoFI Ministry of Fisheries MoIT Ministry of Industry and Trade MoND Ministry of National Defence MoNRE Ministry of Natural Resources and Environment MoST Ministry of Science and Technology MoT Ministry of Transportation MPI Ministry of Planning and Investment MRC Mekong River Commission MRCS Mekong River Commission Secretariat MRD Mekong River Delta NAPA National Adaptation Program of Action. NCAR National Centre for Atmospheric Research NCEP National Centre for Environmental Prediction NTP National Target Program NWRC National Water Resources Council PPC People’s Party Committee
  • 12. Climate Change Impact and Adaptation Study in Mekong Delta – Part A viii | P a g e ROMS Regional Oceanographic Modelling System SKM Sinclair Knight Merz SLR Sea Level Rise TA Technical Assistance UNDP United Nations Development Program UNIDO United Nations Industrial Development Organisation VNMC Vietnam National Mekong Committee VRSAP Vietnam River System and Plains model WMO World Meteorological Organization
  • 13. Climate Change Impact and Adaptation Study in Mekong Delta – Part A ix | P a g e Key Terms Adaptation Actions taken in response to actual or projected climate change and impacts that lead to a reduction in risks or a realization of benefits. A distinction can be made between a planned or anticipatory approach to adaptation (i.e. risk treatments) and an approach that relies on unplanned or reactive adjustments. Adaptive capacity The capacity of an organization or system to moderate the risks of climate change or to realise benefits, through changes in its characteristics or behaviour. Adaptive capacity can be an inherent property or it could have been developed as a result of previous policy, planning or design decisions of the organisation. Climate change Climate change refers to a change of climate that is attributed directly or indirectly to human activity that alters the composition of the global atmosphere and that is in addition to natural climate variability observed over comparable time periods (United Nations Framework Convention on Climate Change). Climate scenario A coherent, plausible but often simplified description of a possible future climate (simply, average weather). A climate scenario should not be viewed as a prediction of the future climate. Rather, it provides a means of understanding the potential impacts of climate change, and identifying the potential risks and opportunities created by an uncertain future climate. Climatic vulnerability Climatic vulnerability is defined by the IPCC as “the degree to which a system is susceptible to, and unable to cope with, adverse effects of climate change, including climate variability and extremes. Vulnerability is a function of the character, magnitude, and rate of climate change and variation to which a system is exposed, its sensitivity, and its adaptive capacity”. Hazard A physically defined source of potential harm, or a situation with a potential for causing harm, in terms of human injury; damage to health, property, the environment, and other things of value; or some combination of these. Mitigation A human intervention to actively reduce the production of greenhouse gas emissions (reducing energy consumption in transport, construction, at home, at work, etc.), or to remove the greenhouse gases from the atmosphere (sequestration). Resilience A measure of the current ability of a community to resist, absorb, and recover from the effects of hazards, by quickly preserving or restoring its essential basic structures, functions and identity. Risk Risk is defined in general terms as the product of the frequency (or likelihood) of a particular event and the consequence of that event, be it in terms of lives lost, financial cost and/or environmental impact. Sensitivity Refers to the degree to which a system is affected, either adversely or beneficially, by climate related variables including means, extremes and variability. Exposure Defines the likelihood of a community being affected by a hazard. This is determined by GIS modelling and mapping of the predicted extent of hazards. Vulnerability Vulnerability is a function of risk and response capacity. It is a combination of the physical parameter of the hazards and its consequences such as personal injuries, degradation of buildings and infrastructure and functional perturbations. It may vary depending on non physical factors such as emergency preparation, education and recovery capacity.
  • 14. Climate Change Impact and Adaptation Study in Mekong Delta – Part A x | P a g e EXECUTIVE SUMMARY Overview The Asian Development Bank (ADB) engaged Sinclair Knight Merz (SKM), in association with Center for Environmental Research (CENRE) under the Vietnam Institute of Meteorology, Hydrology and Environment (IMHEN), Acclimatise and University of Newcastle, Australia to undertake ‘Part A’ of the Climate Change Impact and Adaptation Study in the Mekong Delta (TA 7377 – VIE). This Report is one of two products that represent the culmination of Part A of the Climate Change Prediction and Impact Assessment study. This report ‘Climate Change Vulnerability & Risk Assessment Study for Ca Mau and Kien Giang Provinces, Vietnam’ presents three key outputs: an identification of future climate conditions in the Mekong Delta region; an assessment of the effects of future climate scenarios on natural, social, and economic systems in the Mekong Delta region; and a baseline analysis of existing climate change capacity within the Government. It provides practical measures that provincial and district administrations can take to inform and strengthen their programs. Importantly, it addresses factors which may constrain or limit collaborative action between communities, leaders, experts and development partners and identifies themes and strategies for follow up work to be completed in Part B of the Project. Part B of the Climate Change Impact and Adaptation Study will commence in early 2012, and will focus on the identification of appropriate climate change adaptation measures for target provinces and targeted regional sectors; and the development of pilot projects for up-scaling and replication of Technical Assistance (TA) outcomes and support to collaborative mechanisms for information sharing and coordinated action on climate change. A fundamental principle of the project is the implementation of a participatory approach involving national and provincial government representatives. With this in mind, a second ‘knowledge product’, an atlas outlining the key findings of the project at a province level and for each district was also produced. It is expected that the atlas which contains maps of the projected impacts of climate change and of present and projected vulnerability will be an important tool for policy makers at national, provincial and district level. Target Provinces Ca Mau and Kien Giang are the two most southern provinces of Vietnam. The economies of both provinces are primarily based on agriculture, aquaculture, fishing and primary industries. Twenty four districts from the two provinces were considered in the scope of this assessment. Stakeholder consultations and field surveys were conducted in all districts, including: Ca Mau City, Cai Nuoc, Dam Doi, Nam Can, Ngoc Hien, Phu Tan, Thoi Binh, Tran Van Thoi and U Minh districts in Ca Mau province; and Rach Gia City, Ha Tien, An Bien, An Minh, Chau Thanh, Giang Thanh, Giong Rieng, Go Quao, Hon Dat, Kien Luong, Tan Hiep, U Minh Thuong, Vinh Thuan and the island districts of Kien Hai and Phu Quoc in Kien Giang province. Tasks and objectives The methodologies and key activities of the Technical Assistance brief for the project (Appendix 8). Part A of the project was expected to cover outputs 1 and 2. Outputs 3 and 4 will be completed in part B and while output 5 is commenced in Part A it will be completed in more detail in Part B. The relevant outputs and extent to which this study has achieved the expected outputs is described below. Output 1: identification of future climate conditions in the Mekong Delta region
  • 15. Climate Change Impact and Adaptation Study in Mekong Delta – Part A xi | P a g e Modelling future climate change scenarios in 2030 and 2050, building on work already carried out by the Ministry of Natural Resources and Environment (MONRE) and donors, and using Global circulation models, regional downscaled models, and local and international climate data as appropriate. Modelling activities will be undertaken initially at the regional level with more detailed modelling carried out for the regional target sectors and provinces. Modelling will investigate threats related to; rising sea level, rainfall patterns (including drought frequency), temperature patterns, salinity patterns, and storm surge. This objective was successfully achieved, and the study produced comprehensive climate scenario modelling for the whole Mekong Delta region using the most up to date climate scenario information that is available for Vietnam. The report outlines detailed climate projection data for both Ca Mau and Kien Giang. However a number of knowledge gaps and limitations of the various modelling applications have been noted. Output 2: assessment of the effects of future climate scenarios on natural, social, and economic systems in the Mekong Delta region. a. Carry out an impact risk assessment at Mekong Delta regional level using an approach based on GIS (geographic information system) to identify the effects of future climate change scenarios on; hydro-meteorological characteristics (e.g., flooding, sea levels and tides, salinity, river flows), natural systems (e.g., biodiversity, water resources and quality, soils.), social systems (e.g., population, poverty, gender, public health, urban settlements), economic systems (e.g., industry, gross domestic product, agricultural production), and important development sectors (including, but not limited to, the identified target sectors). b. Identify regional hotspots of climate change sensitivity, including vulnerable infrastructure items in the target sectors. c. Integrated assessment modelling will then be carried out for target provinces and sectors to provide a more detailed assessment of climate change effects. This objective was substantially achieved, but instead of moving from a Mekong Delta scale down to province scale, the assessment started at the province scale. However, while the assessment was only applied to the two target provinces, the observations, key findings and conclusions can be extrapolated to apply to other provinces in the Delta. The study successfully used the outputs from a hydrological / hydrodynamic model and a coastal model in MapInfo GIS to assess the effects of future climate scenarios. The outputs from the modelling covered the entire region but due to time and data constraints, detailed analysis of projected effects was restricted to Ca Mau and Kien Giang. The evaluation did however consider the interconnections within the whole region, including inter linkages of people, transport, trade, and water. The outputs from the GIS were successfully used to determine the current and projected extent of the effects on hydro-meteorological and natural systems, but again analysis was restricted to Ca Mau and Kien Giang rather than at a regional level. In order to identify the effects on the social, economic and development systems the study used three separate components; the results from the GIS exposure modelling, observations and findings from the sectoral consultations, and district survey data to determine the relative levels of risk for particular threat sources. The chosen methodology allowed for the identification of hotspot districts in each target sector. Due to the data intensive nature of the adopted risk assessment method, rather than applying a preliminary coarse regional assessment as described in b, the study commenced with a detailed vulnerability assessment for the target provinces and sectors only. Output 5: incorporate institutional strengthening activities for Government decision makers and technical staff, as well as awareness raising activities for the community.
  • 16. Climate Change Impact and Adaptation Study in Mekong Delta – Part A xii | P a g e Activities for output 5 will be commenced under part A. An analysis of existing climate change capacity within the Government will be carried out as the baseline to develop a tailored capacity building program for provincial and sector authorities (PART B) This output was only partially achieved. No formal climate change capacity assessment of national government decision makers was carried out. However the international specialists did carry out informal assessment of province and district capacity during the initial district surveys to varying degrees. The status of future plans was examined and the extent to which climate change adaptation is incorporated was analysed as a basis to assess existing capacity. It is recommended that a formal institutional capacity assessment be carried out in Part B. Project Outcomes Output 1: Climate Change Projection Modelling. Based on the review of relevant literature relating to climate change impacts and adaptation and the preliminary analysis of secondary data for the Mekong Delta region undertaken during the project it was evident that there were significant knowledge gaps and limitations surrounding the quantification of climate change impacts in Vietnam, especially for the Mekong Delta region. In 2010 IMHEN produced climate change scenarios for a select range of climate change development scenarios: Low emissions scenario (B1); Intermediate emissions scenario of the medium scenario group (B2); and the intermediate scenario of the high emission scenario group (A2 and A1Fi). This data has significantly improved the climate change and sea level projections for Vietnam, and provides sea level scenarios for 25 cm, 50 cm, 75 cm and 100 cm. The study utilised statistically downscaled data for temperature and rainfall, together with the regionally downscaled scenarios for sea level rise produced by IMHEN 2010 and the latest hydrological river flow scenarios developed for the Mekong mainstream above Kratie by the Mekong River Commission. The scenarios developed by the MRC were based on PRECIS, and have been used in a number of reports prepared by IMHEN relating to climate change impacts in the Mekong River upstream of Vietnam. As of mid-March 2011, the official Digital Elevation Model for the Mekong Delta was released and a copy was made available for use by the project. Extreme precipitation change projections were also derived for Ca Mau City and Rach Gia City by CLIMsystems. Projections for changes in multiple day and one day extreme rainfall events were explored for 2030 and 2050 (A2 and B2) by applying ensemble pattern scaling to the daily precipitation output of 12 GCMs The approach and methodology employed to produce the climate change scenarios and climate change impact assessments is illustrated in Figure 1. The components that were used to produce the final outputs of an outline of the threats are described below. Two modelling efforts were used to determine the potential impacts of anthropogenic climate change in the region. 1. Hydrological/ Hydrodynamic modelling was conducted by IMHEN using the outputs from the regional climate modelling, historical climate data and the DEM to determine the potential impacts on; flooding caused by increased streamflow, salinity and saline intrusion, drought, and water resource demand and supply. Hydrological modelling was performed using the Integrated Quality and Quantity Model (IQQM) to simulate the flow of water through the Mekong Delta river systems, making allowance for control structures such as dams and irrigation abstractions. Hydrodynamic modelling performed using the ISIS software enabled representation of the complex interactions caused by tidal influences, flow reversals between wet and dry seasons, and overbank flow in the flood season. Salinity intrusion modelling was also performed using ISIS. Hydrological and hydrodynamic modelling was conducted under baseline (1980-1999 and for the 2000 flood event), 2030 (2020-2039) and 2050 (2040-2059) time horizons with flood inundation
  • 17. Climate Change Impact and Adaptation Study in Mekong Delta – Part A xiii | P a g e projections produced for both A2 and B2 emission scenarios and salinity intrusion projections projected for B2. Figure 1- Schematic outlining this project’s climate change scenario and impact assessment methodology. Note that sea level rise was taken into account in the hydrological and hydrodynamic modelling but storm surges, typhoon impacts, and wind and ocean wave processes were not. While existing flood and salinity control/protection infrastructure was incorporated planned infrastructure was not included. 2. Coastal modelling performed by Dr Nhan at the Institute of Coastal and Offshore Engineering was used to simulate the combined processes of hydrodynamics, wind induced waves, mud transport, sand transport, erosion/deposition, storm surge, and typhoons in the near shoreline coastal zone of Kien Giang and western Ca Mau provinces. This modelling utilizes the MIKE 21/3 Coupled Model Flow Model and used as its input the hydrological modelling outputs, particularly the streamflow and river flood inundation modelling results. Analysis of the projected changes to the key input variables to coastal modelling revealed minimal differences between 2030 and 2050 or A2 and B2 so only 2050 and only under the B2 scenario was modelled in detail. Rather than the standard baseline of 1980-1999 this modelling used 2000-2009 as a baseline. The comprehensive climate scenario modelling work used in this study utilizes the most up to date climate scenario information that is available for Vietnam. However there are a number of knowledge gaps and limitations of the various modelling applications in Vietnam. These include: The application of the MAGICC/SCENGEN 5.3 model in the development of climate change scenarios, which produces low-resolution grid maps (300 by 300 km) and makes it difficult to accurately reflect the local specificities of climate change in Vietnam; SIMCLIM modelling  Outputs: Extreme rainfall vents
  • 18. Climate Change Impact and Adaptation Study in Mekong Delta – Part A xiv | P a g e There is currently a lack of in-depth analysis to distinguish and assess impacts induced by climate change from other natural phenomena (e.g. El Nino/Southern Oscillation etc); The current hydro-meteorological observation network is insufficient and inadequately distributed across climate zones and therefore unable to meet the demands for climate monitoring and/or early disaster warning. The knowledge gaps were significant barriers to overcome in achieving the stated objectives of this project (and some were only partially conquered), in particular the limited availability of observed historical data and regionally-specific climate change scenario information for means and extremes at the provincial level. Sea Level Rise Projections The different climate scenarios show little difference for the time periods that this study is concerned with. Sea level is projected to rise by approximately 15 cm by 2030 and by approximately 30 cm in 2050. By the end of the 21st century, the sea level from Ca Mau to Kien Giang could rise up to 72 cm (low scenario), 82 cm (medium scenario) and 105 cm (high scenario) compared with 1980-1999. The hydrological modelling indicated that a 15 cm or 30 cm sea level rise would not result in an appreciable increase in land area of the target provinces that would be "permanently inundated" primarily as a result of the protection afforded by the current system of sea-dykes and flood protection infrastructure. The exception is Ngoc Hien in Ca Mau province - which is already affected by inundation in periods of high seasonal tides. The most important effects of sea level rise relate to the corresponding changes in flooding and drainage, its relative effect on salinity and importance for low lying areas in terms of enhancing coastal erosion, proneness to inundation and increases storm surge/storm tide vulnerability. Any change in the mean sea level, combined with the effects of storm surge associated with large storms or cyclones are likely to have dramatic consequences, especially for Ngoc Hien and for the island districts of Kien Hai and Phu Quoc. Rainfall Projections The most recent IMHEN projections for the end of the 21st century under both A2 and B2 emissions scenarios are that: By the end of 21st century, rainfall is expected to increase by about 3 to 4% in both Kien Giang and Ca Mau compared to the baseline. Rainfall tends to increase in rainy months (by up to 25% by the end of the century) and decrease in dry months (can be from 30 to 35%). In other words the dry seasons will get drier and rainfall in the rainy season will be more intense (i.e. larger volumes in shorter periods). This will exacerbate flooding and drought conditions. Extreme events The CLIMsystems modelling projected that for both provinces the 10 and 100 yr extreme rainfall events will be ~6% larger for 2030 (both scenarios) and 10% (B2) and 11% (A2) larger for 2050. However, it should be noted that these values represent increases of only 13 mm and 22 mm in a 150 mm+ event for Ca Mau and only 15 mm and 32 mm during a 150- 300 mm event for Rach Gia. Temperature Projections The general trend of maximum and minimum temperature over the past 50 years has been an increase with the minimum temperature increasing faster than the maximum temperature. Projected future trends are:  Increased seasonal air temperature ranging from 0.7°C warmer by 2030 to 1.4°C warmer by 2050 for Ca Mau, and 0.5°C to 0.9°C warmer for Kien Giang by 2050;
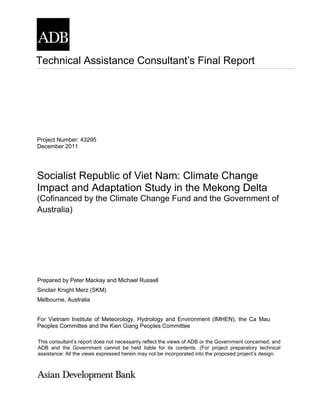
  • 19. Climate Change Impact and Adaptation Study in Mekong Delta – Part A xv | P a g e  By the end of 21st century, the annual temperature would increase by about 1.5 to 2.0°C in Ca Mau and Kien Giang. The increase of Ca Mau is higher than in Kien Giang.  The maximum temperature increases by less than the minimum temperature. By the end of 21st century, the maximum temperature may be higher than current record about from 2 to 2.5°C compared with an increase of 3.5 to 4.0°C for the minimum temperature. Other Climate Change Projections:  Relative humidity decreases in the dry months and increase in rainy months in both provinces. However, the annual relative humidity tends to decrease slightly.  Average wind speed increases in winter, spring and autumn months in both provinces, but decreases in the summer months. Annual average wind speed increases in most areas of Ca Mau and does not have a clear trend in Kien Giang. Some of the results that have emerged from the downscaling are confusing and will require further detailed investigation to clarify:  The A2 temperature results are very close to the B2 results, even out to 2050, which is contrary to IPCC (2007).  The A2 scenario temperatures are sometimes not as warm as B2, which is also contrary to IPCC (2007).  The change in temperature out to 2050 is sometimes not as large as the change to 2030 which is inconsistent with the known physics of climate change;  The spatial pattern of warming is difficult to interpret, which requires further investigation.  The projected rainfall change under A2 is sometimes less than the change under B2 (this is for both the seasonal and monthly projections).  There is a lack of significant differences in wind speed between the 2030 and 2050 scenarios and further investigation is required to determine whether this is a real result. Salinity Projections Changes in hydrological conditions in the canal and river systems of the two provinces are projected to occur due to the changes in the dynamics of flow between the higher sea level and the flows in the Bassac branch of the Mekong River. As a result the intrusion of saline water into the canal system is projected to change in the future. Salinity is found to be highest in late April and early May with recorded values of salinity in the study area reaching as much as 29.4 ‰ (parts per thousand). Figure 2 summarise the findings from IMHEN modelling for the current and future extent of salinity in the region in 2050 for the A2 scenarios. Most notable is that all the districts in Ca Mau, and the majority of districts in Kien Giang (with the exception of the island districts of Phu Quoc and Kien Hai) are already affected by salinity. In the northern part of Kien Giang salinity is projected to decrease in extent while in the south it is projected to increase in extent. The models predict an increase in area of high salinity (>0.28 ‰) for both scenarios. Storm Surge Projections During a storm event, the combined effect of low pressure and high winds result in higher than normal water levels. For both the East and West coastlines, storm surge will occur on the ocean facing coastlines that are exposed to waves from the northeast and southwest monsoons. It is clear from the climate simulations that extreme weather events pose a significant threat to both provinces. Typhoons (defined as tropical depressions of sufficient intensity to produce gale force
  • 20. Climate Change Impact and Adaptation Study in Mekong Delta – Part A xvi | P a g e winds) are not only dangerous because they produces destructive winds but also because they are associated with torrential rains (often leading to floods), storm surge and wild sea conditions. Figure 2 - Current and projected (2050 A2) maximum extent of salinity in the two provinces. An analysis of Typhoon trends by IMHEN showed that while the frequency in the East Sea increased slightly, the frequency of typhoon landings in Vietnam has no clear trend. However, Typhoon landings have moved toward the South and the frequency of very strong storms (> level 12) has increased. The analysis also showed that the typhoon season is ending later. This indicates that areas that have not typically suffered from storms (such as the south eastern portion of the country and HCMC) may increasingly be vulnerable. However, cyclones are a complex phenomenon and their formation is very difficult to predict. As part of the coastal modelling, the observations from Typhoon Linda in 1997 were used to simulate the potential effects of typhoons and storm surge on the coastlines of Ca Mau and Kien Giang under different sea level rise scenarios. The simulations show that the water surface elevation for a large scale typhoon event could be as high as 2 m in elevation, and in combined with 4-5 m waves could result in severe damage to coastal protection dykes, and fishing villages in estuaries and canal mouths along the entire coast. Output 2: assessment of the effects of future climate scenarios on natural, social, and economic systems in the Mekong Delta region Impacts on hydro-meteorological characteristics The outputs from the hydrological / hydrodynamic and coastal models were imported into MapInfo GIS for further spatial analysis to determine the spatial extent of the projected impacts. While the model outputs covered the western portion of the Mekong Delta, detailed analysis presented in the report covers only the target provinces. Analysis of the model outputs indicates that a number of projected climate changes will have notable impacts. Both the projected changes to rainfall patterns and increase in sea level will combine to alter the extent of impacts of extreme flood events. With the projected increase in total annual precipitation,
  • 21. Climate Change Impact and Adaptation Study in Mekong Delta – Part A xvii | P a g e and the projected changes to the hydrology of the Bassac River, flood danger is expected to increase in all districts (except Phu Quoc and Kien Hai which are island districts) by 20 to 50% between now and 2030 and 2050 respectively. Higher sea levels will reduce the ability of flood waters to escape to the sea and will thus lead to more widespread and deeper inundation during extreme flood events. The difference in the projected extent and depth of extreme event flooding (based on the 2000 flood) for baseline sea level and climate conditions compared to the projected extent for sea level and climate conditions for 2050 are illustrated in Figure 3. Most of Kien Giang is only just above sea level and for twelve out of fourteen districts, the projected threat of flooding is considered to be moderate to severe. Extreme threat of flooding from an extreme event is projected to be lower in Ca Mau with only five out of nine districts with vulnerability to flooding considered to be moderate to severe. Districts experiencing the greatest increases in area inundated include: An Minh – 55% increase; Vinh Thuan – 53% increase; Ca Mau – 51% increase; and An Bien – 43% increase. Figure 3 - Current and projected (2050 A2) extent and depth of extreme event flooding (based on the 2000 flood). In the majority of the districts, flood protection is not adequate. Upgrading of flood protection is urgently needed for all the districts, especially for the major settlements and industrial areas. Flood protection upgrading is also needed along the Bassac River which is outside the study area but influences flooding in Kien Giang and to a lesser extent in Ca Mau. Increases in sea level, and the associated reduction in sediment transport and changes in deposition patterns will lead to general and wide scale deterioration in coastal conditions, including lower levels of sedimentation on the east coast and an increase in coastal erosion on the west coast. In addition, the area of Ca Mau exposed to storm surge is projected to increase from 9% to 15%, while the area of Kien Giang that is exposed is also projected to increase. Ngoc Hien district in Ca Mau is most likely to be adversely effected as are the island districts of Phu Quoc and Kien Hai in Kien Giang, especially Kien Hai with between 6 and 13% of their land area inundated. The combined effect of sea level rise and increased storm surge will have detrimental effects on the fringing strip of mangroves that
  • 22. Climate Change Impact and Adaptation Study in Mekong Delta – Part A xviii | P a g e currently help protect the coastline and provide valuable livelihood opportunities. In addition to this it is likely that there will be a deterioration of beaches on Phu Quoc and other low set islands in the Kien Hai Island group. These could become greater problems should climate changes result in ‘unexpected’ changes in oceanic circulation patterns, local currents, wind direction and wave dynamics Climate Change Impacts on Natural Systems For each sector expert opinion was used to make an assessment of the existence and adequacy of in 2030 and 2050. Table 1 below summarises the projected impacts of climate change on natural systems in each district of the two target provinces. In the Table the impact of each hazard on the infrastructure is rated according to the combination of exposure to the hazard and the extent of existing measures that are in place to reduce the impacts. Table 1 - Summary of climate change impacts on natural systems in each district. District Hazard Erosion & Sedimentation Flooding & Drought Saline Intrusion Storm Surge CaMauProvince Ca Mau • ••• ••• • Cai Nuoc •• •••• ••• • Dam Doi •• •• ••• •• Nam Can •• ••• ••• •• Ngoc Hien •••• •• ••• •••• Phu Tan •• ••• ••• •• Thoi Binh • •• ••• • Tran Van Thoi •• ••• ••• •• U Minh •• •• ••• •• KienGiangProvince Rach Gia •• ••• ••• •• Ha Tien •• ••• ••• •• An Bien •• ••• ••• •• An Minh •• •• ••• •• Chau Thanh •• •••• ••• •• Giang Thanh •• •••• •• • Giong Rieng • •••• •• • Go Quao • •••• ••• • Hon Dat •• •••• ••• •• Kien Hai •• • • •••• Kien Luong •• •••• ••• •• Phu Quoc •• • • •• Tan Hiep • •••• ••• • U Minh Thuong •• ••• ••• • Vinh Thuan •• ••• ••• • • Adequate, now and in the near future (around 10 years) ••• Improvements are desirable in view of economic development (medium term) •• Adequate, but adaptation needed in view of climate change (long term) •••• Rehabilitation or upgrading urgently needed As illustrated in the Table above, whilst the exposure to salinity is widespread and considered to be major for just about all of the mainland districts, where control measures are largely in place the impacts are generally only moderate. This is the same for the nature and extent of coastal erosion. Whilst all of the coastal districts are exposed to coastal erosion, for most districts the impacts were assessed as intermediate and/or partly controlled. However Ngoc Hien was assessed as major and largely uncontrolled as it is the only coastal district not protected by the sea-dyke system.
  • 23. Climate Change Impact and Adaptation Study in Mekong Delta – Part A xix | P a g e In terms of magnitude and extent, river flooding and inundation clearly represent the greatest threats to both provinces and especially to Kien Giang where twelve of the fifteen districts were assessed as having major exposure with little control mechanisms in place. In particular, the districts of Chau Thanh, Giang Thanh, Giong Rieng, Go Quao, Hon Dat, Kien Luong and Tan Hiep were considered to be highly vulnerable and threatened by flooding and inundation. Impact Risk Assessment of social and economic systems in important development sectors. The study approach to impact risk assessment emphasises the need to understand localised ‘current vulnerability and risk’ as the best basis for predicting future vulnerabilities and risks, as regional downscaling of long-term climate forecasts need to be supplemented by assessments of who within geographically vulnerable regions are the most socially and physically vulnerable. Several conceptual frameworks have been proposed that incorporate these concepts to describe the general processes that lead to vulnerable people and places. This study has adopted the following definitions: Hazard refers specifically to physical manifestations of climatic variability or change, such as droughts, floods, storms, episodes of heavy rainfall, long-term changes in the mean values of climatic variables, and potential future shifts in climatic regimes; Exposure refers to the types of assets at risk. They can include property, infrastructure, natural resources, and the services those natural resources can provide (protection of health, provision of food or water, etc.); Sensitivity is the degree to which a system (natural, human, or built) is likely to be affected by change, such as climate‐related environmental change; Risk is a measure of the consequence (severity or sensitivity) and likelihood (probability) of potential impact; and Adaptive capacity is the ability of a community or system to mitigate, cope with, or accommodate change Resilience is the opposite of vulnerability, and building resilience is the primary goal of adaptation planning. Resilience is a community’s ability to absorb disturbance while retaining its basic structure and function. Hence, the most vulnerable people, communities, districts or systems are those that are most exposed to climate hazards or impacts, and who are the most sensitive to those effects, and who have the lowest capacity to respond to the changing conditions. In this context, the study developed a Comparative Vulnerability Assessment (CVRA) conceptual framework that identified key geographic areas and sectors that are particularly vulnerable to the combined effects of climate change and sea level rise, and particularly the impacts of flooding, inundation, salinity, and storm surge. The CVRA incorporates a range of vulnerability indicators that cover the important aspects of the social, economic and development systems that lead to climate change vulnerability. The indicators incorporate measures of, exposure, sensitivity, and adaptive capacity. The method also incorporates weighting factors that are based on expert opinions that estimate the current status of existing protection measures and assess their suitability to provide protection from projected changes to the extent of climate change impacts. The method uses the results from the exposure modelling together with the key observations and findings from the sectoral consultations and surveys to determine the relative levels of risk for a particular threat source - expressed as a function of ‘likelihood’ and ‘consequence’ to highlight the major risks at the district and provincial levels. Due to the data intensive nature of the adopted CVRA method, rather than applying a preliminary coarse regional assessment, the study focused on a detailed vulnerability assessment for the target provinces and sectors only.
  • 24. Climate Change Impact and Adaptation Study in Mekong Delta – Part A xx | P a g e The study focused on developing a range of comparative baseline indicators at the ‘district’ level for each sector in order to provide a more detailed picture of the nature and extent of human settlements and infrastructure that are likely to be most vulnerable to future climate change, and to develop ‘vulnerability profiles’ for each district that explicitly illustrate the ’comparative vulnerability’ of each area under present conditions and for 2030 and 2050. This CVRA (Comparative Vulnerability Risk Assessment) framework is a useful approach to presenting quantitative estimates of the risks that climate change poses, at both the regional and the local level. However, it is important to understand the limitations of this approach, namely that the quantitative estimates are reliant on the quality of information available. In addition the CVRA is unavoidably uncertain as it does not take account of changes in non-climatic factors. These include future adaptation measures that will influence both the baseline exposure and their sensitivity to climate effects. Comparative Vulnerability Risk Assessment Findings Risk The risk assessment presented in Table 2 indicates the extent of the risks that are posed by the three major climate change threats to the 25 districts in the two target provinces. The island districts of Phu Quoc and Kien Giang have little risk from inundation or salinity. While five districts in Ca Mau and two mainland district in Kien Giang are currently at low risk from inundation, all mainland districts are projected to be at moderate risk from inundation by 2050. All mainland districts are currently at moderate risk from salinity and are projected to remain at moderate risk out to 2050. Ngoc Hien and Table 2- Risks posed to each district from climate change impacts for baseline, 2030 and 2050. Inundation Salinity Storm Surge District 2010 2030 2050 2010 2030 2050 2010 2030 2050 Ca Mau 3 8 9 10 10 10 0 0 0 Cai Nuoc 8 9 9 10 10 10 0 0 0 Dam Doi 3 8 8 10 10 10 4 4 4 Nam Can 8 8 8 10 10 10 4 4 6 Ngoc Hien 3 8 3 10 10 10 8 10 10 Phu Tan 8 8 8 10 10 10 4 4 4 Thoi Binh 3 3 8 10 10 10 0 0 0 Tran Van Thoi 8 8 9 10 10 10 4 4 4 U Minh 3 3 8 10 10 10 4 4 4 Rach Gia 9 9 9 10 10 10 4 4 4 Ha Tien 8 8 9 10 10 10 4 6 6 An Bien 8 8 9 10 10 10 4 4 4 An Minh 3 8 8 10 10 10 4 4 4 Chau Thanh 9 9 9 10 10 10 4 4 4 Giang Thanh 9 9 9 10 10 10 0 0 0 Giong Rieng 9 9 9 5 5 5 0 0 0 Go Quao 8 9 9 5 10 10 0 0 0 Hon Dat 9 9 9 10 5 5 4 4 4 Kien Hai 0 0 0 0 0 0 6 6 6 Kien Luong 9 9 9 10 10 10 4 4 4 Phu Quoc 3 3 3 0 0 0 4 4 4 Tan Hiep 9 9 9 10 5 5 0 0 0 U Minh Thuong 3 8 8 10 10 10 0 0 0 Vinh Thuan 3 8 8 10 10 10 0 0 0 >20 Extreme; requires urgent attention. 5 - 12 Medium; existing controls sufficient in the short term, will require attention in the medium term. 12 - 20 High; requiring attention in the near term. <5 Low; existing controls will be sufficient.
  • 25. Climate Change Impact and Adaptation Study in Mekong Delta – Part A xxi | P a g e Kien Hai are currently at moderate risk from storm surge but are projected to remain at moderate risk out to 2050. Nam Can and Ha Tien are projected to be at moderate risk from storm surge by 2050. Sectoral Vulnerability Population and Poverty The provinces of Kien Giang and Ca Mau are home to approximately 2.92 million people and have some of the highest population densities in the country. The main pressures driving socio-economic vulnerability in the region are demographic trends, population growth, pressure on land and water use, limited space (available land) and industrial development. Whilst poverty is important in terms of resilience and adaptive capacity, the relatively low levels of poverty in the region would indicate that it is not a principal driver of vulnerability. However, higher incidences of poverty reduce adaptive capacity. It should be noted that there is also a strong correlation between ethnicity and poverty in the study region. Agriculture and Livelihoods It is highly likely that economic development of both provinces will be adversely affected by climate change, primarily due to the direct and indirect effects of climate change on primary industry. Agriculture as an economic sector accounts for approximately 40% of the regional GDP, provides for the livelihoods of more than 75 % of the people and is the major contributor to the economies of both provinces. Any increase in the negative impacts on the agricultural systems from flooding, inundation, salinity and coastal erosion and sedimentation will impact not only on the livelihoods of local people, but also on the regional and national economies. The most severe socio-economic vulnerabilities in this sector relate to the combined effects of flooding, inundation and saline intrusion associated with sea level rise on agricultural lands and aquaculture lands and the resulting impacts on livelihoods, GDP and primary industry. Increased temperature may result in decreased rice yields due to heat stress and decreased flowering potential. However, crop models incorporating CO2 fertilization predict increased yield if irrigation requirements are met. The yields of sugar cane and maize are predicted to increase. Other fruit and vegetable crops may have decreased yields due to impacts on flowering/fruiting and/or changes in growth rates. For aquaculture, shrimp mortality may increase due to high water temperature, increase in disease levels and increased mortality in larvae production systems. Higher wet season rainfall may reduce rice yields through inundation damage, or localised flooding damaging farm infrastructure. Aquaculture may experience a reduction in salinity leading to decreased growth rates and disease or localised flooding damaging pond infrastructure. And fisheries may see a reduction in estuarine or near shore salinity leading to dramatic changes in fish ecology and reduction in catch. Lower dry season rainfall may result in increased salinity in canals leading to reduced growth rates for aquaculture and reduced rice yields. A decreased capacity for irrigation will affect not only rice but other crops. A potential climate impact specific to the rice shrimp farming system is a reduced cropping window through delays in planting the rice crop (because of need for rain to flush out salts) and reduced yields due to end of season salinity damage. Irregular seasonal changes can cause poor water quality and shrimp stress and disease. Industry and Energy The industrial sector will be most at risk from the effects of sea level rise and inundation. The industries of both provinces are primarily based on the processing of agricultural, aquacultural and ocean fishing products. Kien Giang has large natural resource based industries primarily cement manufacturing from local limestone deposits and Ca Mau has fertiliser production and large existing energy sector assets with new energy based developments underway. Both provinces have small
  • 26. Climate Change Impact and Adaptation Study in Mekong Delta – Part A xxii | P a g e service industries based around tourism, ice making, ship building and agriculture and aquaculture service industries. The shrimp and fish processing plant sites are generally in the order of only 0.5 to 1.5 m above water level. Some plants already come close to flooding in spring tides in the wet season, so they are vulnerable to any sea level rise (SLR) climate change effects. Many of the new industrial zones and shrimp and fish processing plant sites are also only around 0.5 to 1.5 m above water level and are vulnerable to sea level rise and inundation and will eventually either need to be raised or defended or abandoned. In some cases it is clear that the industrial sites would be defended in almost any realistic climate change impact scenario for their remaining lives. This includes the Ca Mau fertilizer complex and the two medium-large cement plants and the new brick making plant in Kien Luong district of Kien Giang province The main climate change vulnerability of the provincial power transmission and distribution system, and particularly the large number of low and medium voltage distribution level poles traversing low lying rice paddies and aquaculture areas, is their vulnerability to extreme events, in particular high winds and typhoons. There will also be increased corrosion vulnerability from inundation and salinity, primarily on medium and low voltage distribution level poles. High voltage steel transmission towers are well engineered to international standards and are not significantly vulnerability to climate change Urban Settlements and Transportation The urban settlement patterns in Ca Mau and Kien Giang are on the Mekong Delta are unique, consisting of the two provincial centres of Rach Gia and Ca Mau and 41 other provincial towns and district centres, connected by an extensive and complex system of waterways and roads. The main drivers of vulnerability in relation to human settlements in the region are population growth and urbanisation, and the associated pressure on land and water use, limited space (available land) and migration. The highest risks facing urban settlements in the region relate to the combined effects of sea level rise and severe flood risk and storm surge associated with extreme events. However, the overall socio economic resilience and adaptive capacity in the urban areas is considered to be relatively high, primarily due to higher levels of income, wealth and support services and infrastructure in comparison with rural populations. Water transport is of crucial importance in both provinces as demonstrated by the disproportionately high volume of goods shipped out of both provinces. Water transportation (rivers/canals) provides the natural comparative advantage of the Province compared to other areas with only roads. Inland waterways provide a cheap, all-weather and easily accessible network for all the population. However, significant investments in the roads network have been made in the last 10 years in Ca Mau and Kien Giang in an integrated system of national, provincial and district level roads that service the main population centres. The region is also serviced by 3 domestic airports and there is a major border crossing to Cambodia near Ha Tien. The most important vulnerabilities for the transport sector relate to the combined effects of river based flooding and coastal inundation associated with sea level rise. Whilst roads are usually considered to be highly vulnerable to SLR and only modest inundations may cause significant damages to a network, the actual designs of newly built or upgraded roads are based on flood records and local conditions. National Roads are designed for 1 in 100 year floods and Provincial Roads for 1 in 50 year floods offering a high level of resilience. Elevation Codes for roads in Ca Mau mean they will be much higher than surrounding lands leading to potential difficulties for: access to frontage properties; access to lower access points; transverse drainage under the road may be reduced; roads may flood adjoining properties; and the incorporation of road drainage and other services along roads. The move towards increased industrialisation will put more demands on both the land and water based transportation systems to ensure there is an efficient system to support processing and marketing of produce.
  • 27. Climate Change Impact and Adaptation Study in Mekong Delta – Part A xxiii | P a g e Vulnerability hotspots The vulnerability rankings for each of the district are based on a standard set of indicators so that the vulnerability can be compared not only between districts, but also across sectors. A regional vulnerability was calculated for each time period as the average value of the five sectors. The geographical distribution of the regional vulnerability for baseline, 2030 and 2050 is shown in Figure 4. Currently, while the Study Area has high exposure the vulnerability to the potential impacts of climate change are low to moderate. However the magnitude of exposure, sensitivity, vulnerability and risk associated with these changes will change into the future, with a number of areas being assessed as highly vulnerable by 2050. Figure 4. - The regional vulnerability for baseline, 2030 A2 and 2050 A2. Regional hotspots of climate change sensitivity Hotspots are defined as geographical areas that inherently have the highest vulnerability to a climate change hazard or combination of hazards. Because the CVRA process uses a ranking method and is applied on a sector basis, the most vulnerable districts in each sector can be identified. The hotspot districts for each sector are shown in Table 3. In Ca Mau province, Tran Van Thoi, Dam Doi and Ca Mau City are vulnerable across multiple sectors. In Kien Giang, Chau Thanh is vulnerable in all sectors and Rach Gia city and Kien Luong are vulnerable across multiple sectors. Table 3 - Vulnerability hotspot districts in each sector. Sector Population Poverty Agriculture & Livelihoods Industry & Energy Urban Settlements & Transport Ca Mau Province Ca Mau Ngoc Hien U Minh Dam Doi Cai Nuoc Tran Van Thoi Dam Doi Dam Doi Tran Van Thoi Tran Van Thoi Tran Van Thoi Ca Mau Ca Mau Kien Giang Province Rach Gia Chau Thanh Hon Dat Chau Thanh Chau Thanh Chau Thanh Rach Gia Hon Dat Kien Luong Chau Thanh Rach Gia Ha Tien Kien Luong Rach Gia Giong Rieng Go Quao An Bien An Minh
  • 28. Climate Change Impact and Adaptation Study in Mekong Delta – Part A xxiv | P a g e Output 5: an analysis of existing climate change capacity within the Government Capacity at the national, provincial and district level capacity was assessed through an analysis of the current planning documents and the existing situation on the ground in combination with the results of the project survey. The assessment for the provincial/district level, summarised in Table 4, indicates that there is a considerable lack of institutional capacity at these levels of government. Capacity at the local (commune) level was not specifically assessed and would be an important component in the process of choosing sites for pilot projects. It is recommended that a formal assessment of adaptive capacity be carried out as a first step in designing an institutional climate change adaptation capacity building program. Table 4 - Qualitative assessment of institutional capacity for nine key measures. Capacity component Assessment Engage with stakeholders and create consensus Key provincial development decisions are conceptualised at and delegated from the national level Awareness programs are often in place but poor understanding by the public is stated as barrier. Women and farmers unions are poorly represented in planning stages Articulate the mandate of a new institution or vision a trajectory Prime minister proclamations generally contain appropriate visionary components Develop a strategy and translate into a plan and budget Strategies are poorly developed and plans lack concrete steps Implement a programme or policy Lack of processes and checks in programme implementation Monitor and evaluate results Very weekly developed Effective and good leadership There is a distinct lack of tendency for individuals to take on decision making roles Effective and well functioning institutions Many institutions do not function well Environment conducive to knowledge sharing Institutional environment actively suppresses knowledge sharing Transparent and independent accountability systems Complete absence of transparency accountability system Further research needs and gaps Capacity at the national level was only assessed by expert judgement based on future development plans and research output. While capacity at the local (commune) level was not specifically assessed and would be an important component in the process of choosing sites for pilot projects. It is recommended that a formal assessment of adaptive capacity be carried out as a first step in designing an institutional climate change adaptation capacity building program. There are a range of other issues that were beyond the scope of the study that require further consideration, including: How can the results of current future studies of this nature (and especially the meteorological and climate modelling), be disseminated more effectively so that the information can be more readily available to others? This is an extremely important point for the Government of Vietnam to address. With a plethora of climate change studies being carried out by many different organizations in Vietnam, and especially on the Mekong Delta, how can future adaptation projects be coordinated so that work is not duplicated? Internal migration from rural areas to provincial centres or to the large cities, and the question of how climate change impact on this is a highly sensitive issue, which only the Government of Vietnam can address. How can existing networks and organizations be better used to improve cooperation on adaptation activities and enhance resilience.
  • 29. Climate Change Impact and Adaptation Study in Mekong Delta – Part A 1 | P a g e 1. Introduction The Asian Development Bank (ADB) engaged Sinclair Knight Merz (SKM), in association with Center for Environmental Research (CENRE) under the Vietnam Institute of Meteorology, Hydrology and Environment (IMHEN), Acclimatise and University of Newcastle, Australia to undertake ‘Part A’ of the Climate Change Impact and Adaptation Study in the Mekong Delta (TA 7377 – VIE). This Report, ‘Climate Change Vulnerability & Risk Assessment Study for Ca Mau and Kien Giang Provinces, Vietnam’ represents the culmination of Part A of the Climate Change Prediction and Impact Assessment study, and incorporates the most up-to-date projections of future climate conditions in the Mekong Delta region; and a detailed vulnerability and risk assessment (VRA) of the potential effects of future climate scenarios on natural, social and economic systems in the Mekong Delta region. Part B of the Climate Change Impact and Adaptation Study will commence later this year, and will focus on the identification of appropriate climate change adaptation measures for target provinces and targeted regional sectors; and the development of pilot projects for up-scaling and replication of TA outcomes and provide support to collaborative mechanisms for information sharing and coordinated action on climate change. 1.1 Purpose of this Study The purpose of this study was to identify potential future climate conditions in the Mekong Delta region, and assess the effects of future climate scenarios on natural, social and economic systems in the region, so as to inform and assist decision makers and development partners in the Mekong Delta region to adapt to the future impacts of climate change and sea level rise. The study focuses on assessing the potential impacts of climate change on the three target sectors in Kien Giang and Ca Mau provinces, these being energy and industry, transport and urban planning, and agriculture and forestry. In this context, the study primarily targets provincial and district level decision makers in the Kien Giang and Ca Mau provinces, as well as major development partners. It provides practical measures that provincial and district administrations can take to inform and strengthen their programs. Importantly, it addresses factors which may constrain or limit collaborative action between communities, leaders, specialists and development partners. It suggests target provinces and targeted regional sectors, which may be suitable for future development as pilot projects for up-scaling and replication in Part B of the project. And finally the study has attempted to identify a range of sectoral adaptation themes for the target sectors where non-structural adaptation options suitable for addressing social and natural system vulnerability can be futher explored in Part B of the project. 1.2 The Regional Context Vietnam is considered to be one of the countries likely to be most affected by global climate change. Within Vietnam, the Mekong Delta region in the south of the country has been identified as being particularly susceptible to the impacts of extreme climate events and climate variability. The focus of this study is the Mekong Delta provinces of Ca Mau and Kien Giang. With a sea level rise of 75 cm, Kien Giang and Ca Mau are two of the top four most affected provinces in terms of areas inundated in Vietnam (according to the Sea Level Rise Report – IMHEN 2010b).
  • 30. Climate Change Impact and Adaptation Study in Mekong Delta – Part A 2 | P a g e Figure 5 - Map of the Study Area
  • 31. Climate Change Impact and Adaptation Study in Mekong Delta – Part A 3 | P a g e 1.2.1 The Mekong Delta The Mekong Delta region covers 12% of the area of Vietnam, and comprises the provinces of Long An, Dong Thap, Tien Giang, An Gian, Vinh Long, Ben Tre, Tra Vinh, Soc Trang, Can Tho, Bac Lieu, Kien Giang and Ca Mau and is home to one fifth of the national population (i.e. approximately 17 million people). Two-thirds of the Mekong delta is located in southern Vietnam and one third in Cambodia. The Vietnamese portion of the Mekong Delta occupies 40,058 km2 , of which 24,000 km2 are now used for agriculture and aquaculture and 4,000 km2 for forestry. The population density in the Vietnamese part of the Delta is relatively high (425 inhabitants/ km2 ) when compared to other regions of the country which averages around 250 inhabitants/km2 . With a population growth rate of 0.6% the pressure on the available space is increasing, and is considered to be one of the major drivers of change in the Delta along with economic development and climate change. Poverty remains an important challenge for the region. Despite a considerable decline in poverty since 1998, there are still around four million poor people living in the Vietnamese Mekong Delta provinces. This is the highest number of poor people of any of Vietnam’s seven regions, and has the highest percentage of ’near poor’ people who are vulnerable to falling back into poverty through adverse impacts on household livelihoods and income from climate change. The Mekong Delta is primarily a rural landscape, with approximately 85% of the population living in rural circumstances and reliant on agriculture for their livelihoods. The Vietnamese part of the Mekong Delta is one of the most productive and intensively cultivated areas in Asia, and is considered to be a priority area for national economic development and food security. Around two thirds of the Mekong delta (10,000 km2 ) is used for agricultural production with the rice dominant product. The delta is responsible for producing half of the country’s rice, 60 percent of its fish-shrimp harvest, and 80 percent of its fruit crop. Aquaculture, forestry and non-rice agricultural crops are also important in some areas. Both freshwater and brackish water aquaculture have recently expanded in both area and economic importance. Aquaculture exports from the delta grew by over 425 percent between 1998 and 2008, and exceed USD 4 billion in value in 2009. The delta now contains 65 percent of the country’s area under aquaculture. Primary production accounted for 41 percent of value added to the delta GDP in 2007, with agriculture, aquaculture, fisheries and forestry the largest primary sectors. Industry, construction and service sectors have grown much faster and collectively account for 59 percent of the regional economy. However much of the industry is either involved in processing primary products such as rice, aquatic products, and sugar or provides agricultural support services such as fertiliser production and machinery servicing. Many changes have occurred in the Mekong Delta to support agricultural and aquacultural expansion and intensification. Canals, dikes and roads have altered the natural dynamics of the floodplain. Mangroves have been cleared and replaced with shrimp ponds, and canals and dams have opened up brackish areas to rice farming. Continuing agricultural and aqua cultural expansion threatens more loss of mangroves in the delta. Increasing use of groundwater is also of concern, increasing risks of saltwater intrusion, as well as contributing to compaction of the sediment layers (WWF Vietnam). Whilst rice and aquaculture are the primary livelihood pursuits, over the last 5-10 years there has also been a rapid uptake of new economic activities, primarily due the Government’s economic restructuring initiatives in the area. In recent years both shrimp cultivation and fruit production have expanded rapidly, with government providing subsidised credit in support of these activities. Many of those who can afford the inputs for these activities have profited. Intensive shrimp farming requires high levels of investment to ensure that the ponds do not become polluted and to limit losses from
  • 32. Climate Change Impact and Adaptation Study in Mekong Delta – Part A 4 | P a g e shrimp disease. People who have managed to invest on a scale to do this properly and efficiently have, in some cases, become very wealthy. Another significant trend in the delta is that of increased mechanisation and land consolidation. In comparison with other lower Mekong Basin countries, Vietnam’s Delta has both the highest levels of chemical inputs and the largest number of tractors per capita. Currently, 90 percent of the rice land on the delta is prepared by tractor, 80 percent is mechanically harvested and almost 100 percent of rice is machine threshed. 1.2.2 Socio-Economic Context Over the last 25 years, Vietnam’s economy changed dramatically from a planned economy to a modern free market economy. Vietnam’s economy was among the fastest growing economies of Asia, with the profound reforms under ‘Doi Moi’, which literally means ‘change and renewal’, contributing to impressive increases in production and substantial declines in the incidence of poverty from 37 per cent in 1998 to 29 per cent in 2002, and 13 per cent in 2008. Under Doi Moi, the Government of Vietnam identified the Mekong Delta as a priority area for economic development, and established targets to increase the production of food, commodities and consumer goods in the Delta by 8 percent annually. According to figures from the General Statistics Office in Hanoi, Vietnam’s economy grew 8.5 percent in 2007, the fastest pace since 1996. Industry and construction accounted for 42 percent of Vietnam’s economy in the first quarter of 2008. Agriculture, forestry and fisheries, which accounted for 14 percent of Vietnam’s economy in the first quarter, grew at 2.9 percent, up from 2.6 percent in the same period in 2007. Per capita GDP increased from US$ 200 in 1996 to over US$ 700 in 2006. With its strong economic performance, Vietnam has become attractive as a country for foreign investment with a cheap, well-educated labour force and large domestic market. Compounded Annual Growth Rate (CAGR) was about 7.6 per cent in the period from 2000 to 2010 and as a result GDP per capita increased from US$400 in 2000 to almost US$1,100 in 2010, buoyed by the continued expansion of investment in infrastructure, labour-intensive manufacturing and service activities. Triggered by the global financial crisis, GDP growth fell to about six per cent in 2008 and 4.5 percent in 2009, the lowest level in almost a decade and a sharp drop from the 8.5 per cent in 2007. At the same time, inflation rose to 25 per cent in 2008, the highest in the region which also includes Laos, Thailand, and Cambodia. Projected real GDP growth (excluding inflation) for the period 2012-2020 targets about 7% per year. However, the drop in GDP growth rate during the financial crisis was less than in neighbouring countries as the Government began addressing the threat of an overheated domestic economy decisively, starting in late 2007. In response to the first shock of the current crisis, the authorities shifted emphasis from growth to stabilisation in March 2008. In late 2008, they shifted once more to supporting economic activity through large interest rate reductions, injections of liquidity, and a fiscal stimulus package. 1.2.3 Sectoral Growth and Diversification The extraordinary economic growth in the Vietnam over the last 20 years has primarily been driven by the economic structural transition from what was primarily a centrally-planned rurally-based economy to a more dynamic and productive multi-sectoral market driven economy that promoted the rapid development of the private sector. Between 1986 and 2005, the structure of the Vietnamese economy transitioned from an economy dominated by agricultural production to an economy dominated by industry and construction and services. Figure 6 illustrates the long-term economic structural transition in Vietnam. The relative contribution of agriculture to GDP has declined from 38.1% in 1986 to 20.7% in 2005, representing a
  • 33. Climate Change Impact and Adaptation Study in Mekong Delta – Part A 5 | P a g e 17% reduction. Over the same period the proportional contribution from industry and energy and the service sectors has risen by 11.9% and 5% respectively. The transition towards to an economy dominated by industry and construction and services has lifted productivity and growth rates, and suggests that industry will likely become the leading sector in the economy. Figure 6 – Vietnam’s economic–sectoral structure transition 1986-2005. Source: Vietnam’s Economy After 20 years of Renewal (1986-2005) In the Mekong Delta, the share of GDP by sector has also shifted markedly from agriculture to the industry and service sectors. In the late 1980s, agriculture comprised more than 40 per cent of GDP, while service and industry contributed about 30 and 25 per cent to GDP, respectively. In 2007, industry’s contribution to GDP rose to more than 40 per cent, while agriculture contributed only about 20 per cent. The rapid expansion of the industrial sector in the Mekong Delta has been due to growth in infrastructure, mining, oil production, construction and opening of trade policies. The importance of these changes to the coastal economies of Ca Mau and Kien Giang cannot be emphasized sufficiently. Today, the coastal economies of Ca Mau and Kien Giang’s multi-sectoral activities are strongly interwoven with linkages in numerous value chains, and the economies of both provinces encompass a range of maritime and terrestrial industries. The major sectors that contribute to the economy of the two provinces are: 1986 2005 Agriculture Industry & Construction Services Use of the term Agriculture In discussions of economic sectors Agriculture is used to refer to all products from the rural economy; grains, fruit, animal husbandry, aquaculture, forestry and fisheries. However, the term Agriculture is also used to refer to the combination of cropping and aquaculture, and Fisheries is used to describe both Aquaculture and capture fisheries, particularily when describing the output of fish processing which occurs in the same factories In the remainder of the study the following definitions will be used: Agriculture – Crops (mainly rice), fruit, animal husbandry and aquaculture, Aquaculture – Production of fish, prawns and other crustaceans in ponds or cages Fisheries – catch of wild fish from the ocean or rivers and canals Forestry – production of timber and timber products from natural or plantation forest.