Oil and Fatty Acid Composition Analysis of Ethiopian Mustard (Brasicacarinataa. Braun) Landraces
•
0 likes•69 views

The experiments was conducted at Holetta Agricultural Research Center, to analyze forty nine Ethiopian Mustard land races for oil and fatty acid composition traits The experiment was carried out in a simple lattice design. The analysis of variance showed that there were highly significant differences among genotypes for all oil and fatty acid traits compared. The significant difference indicates the existence of genetic variability among the land races which is important for improvement

Recommended
Recommended
More Related Content
Similar to Oil and Fatty Acid Composition Analysis of Ethiopian Mustard (Brasicacarinataa. Braun) Landraces
Similar to Oil and Fatty Acid Composition Analysis of Ethiopian Mustard (Brasicacarinataa. Braun) Landraces (20)
More from Premier Publishers
More from Premier Publishers (20)
Recently uploaded
Recently uploaded (20)
Oil and Fatty Acid Composition Analysis of Ethiopian Mustard (Brasicacarinataa. Braun) Landraces
- 1. IJPBCS Oil and Fatty Acid Composition Analysis of Ethiopian Mustard (Brasicacarinataa. Braun) Landraces Fekadu Amsalu Holetta Agricultural Research Center. P. O. Box 2003, Addis Ababa, Ethiopia. Email: fekiamsalu@gmail.com The experiments was conducted at Holetta Agricultural Research Center, to analyze forty nine Ethiopian Mustard land races for oil and fatty acid composition traits The experiment was carried out in a simple lattice design. The analysis of variance showed that there were highly significant differences among genotypes for all oil and fatty acid traits compared. The significant difference indicates the existence of genetic variability among the land races which is important for improvement of these traits. The highest heritability in broad sense was recorded for linolenic(62.58%),, palmitic(58.19%), linoleic (57.46%),stearic (56.39%),erucic(54.32%) oleic acid(53.65%) and oil content(50.33%). This suggests that large proportion of the total variance was due to the high genotypic and less environmental variance. Hence, a good progress can be made if some of these traits are considered as selection criteria for the improvement of oil and fatty acid composition traits. In the correlation coefficient analysis, a highly significant but negative correlations were observed between oleic acid and linoleic(-0.468), linolenic(-0.716) and erucic acid (-0.760). Since for edible purpose oleic acid is considered as preferred fatty acid increased level of the three linoleic, linolenic and erucic acid is not nutritionally desirable. This relationship had practical advantage towards selecting high oleic, but low linoleic, linolenic and erucic acid containing genotypes. Highly significant positive correlation was found between palmitic,linoleic(0.430) and erucic (0.517), where as negative association was observed between palmitic and oleic acid (-0.015), which indicates that some sort of compromise may be needed in order to increase palmitic acid for edible purposes. Multivariate analyses resulted in the formation of four clusters and have shown the presence of substantial genetic diversity among the genotypes. The present study also showed that geographical diversity could not necessarily be an index of variation and the factors other than geographic diversity such as genetic drift, selection pressure, closeness in pedigree and environment may be responsible for differential grouping of genotypes.The present study revealed the presence of considerable variability among genotypes for all traits. These results indicate that there is good opportunity to improve these characters using the tested genotypes. Keywords: Ethiopian mustard, oil content, Genetic advance, heritability; correlation, fatty acid analysis INTRODUCTION Ethiopian mustard (BrasicacarinataA. Braun) an oil crop of Ethiopian origin, an important oil seed crop grown in many regions of the country used as a source of vegetable oil. The crop traditionally used for many purposes, such as greasing traditional bread-baking clay pan, curing certain diseases and as a source of vegetable relish (Nigussie, 2001). Before Ethiopian mustard can be used as a major food crop, the quality of both the seed oil and the meal characteristics must be improved to meet Canola quality standards (Getinetet al., 1994). Oil content is generally percentage of fat in the seed. Enhancement of oil content in seeds and simultaneous improvement in their quality will increase the total oil yield/ha of higher nutritive value. Fatty acid composition controls functional and nutritional values of different vegetable oils, varying considerably depending on the plant species. The presence of genetic variation for oil and fatty acid composition is found to be essential for genetically improving the oil quality and subsequently developing new International Journal of Plant Breeding and Crop Science Vol. 8(1), pp. 1039-1049, March, 2021. © www.premierpublishers.org, ISSN: 2167-0449 Research Article
- 2. Fekadu A. 1040 cultivars. Number of potential mustard land races has been evaluated for their seed oil content percent and fatty acids profile of which, some have been collected from different parts of the country. Improvement manipulation in oil crops to improve nutritional values, have lead to increased oil quality in new genotypes including those with low erucic acid oil content of brassica carinata. Brassica oil has fatty acids composition in higher genetic variations as compared to those contained in other major vegetable oils. Brassica species seed oil is characterized by significant amount of long-chain monounsaturated fatty acids, mainly erucic acid (C22:1) absence in any other commercial plant oil. High erucic acid oils are use full for industrial application, but not for human consumption. Therefore to develop varieties having both commercial and free erucic acid as well as those with high erucic acid is promising for breeding program in brassica oil seed crops. Other important objectives are the increase of oleic acid and linoleic acid, and the reduction of linolenic acid content. Currently, additional breeding targets involving oil composition have emerged, in particular those within field of industrial application of vegetable oils, since it is possible to transfer gene among species. Therefore the present study was executed with the objective of estimating the variability, heritability and genetic advance analysis for oil content and fatty acid composition of Ethiopian mustard land races: MATERIALS AND METHODS Experimental Site The experiment was conducted at Holetta Agricultural Research Center (HARC) in 2013/2014 cropping season from June to December 2013. Holetta (West Shewa Zone of Oromia Region) is located at latitude 9o N and longitude 38o E, altitude of 2400 m a.s.l situated 30km West of Addis Ababa. It is one of the representatives of oil seed Brassica growing areas in the central highlands of Ethiopia (Nigussie and Mesfin, 1994). The area has mean annual rainfall of 1059 mm and temperatures of 23oC (maximum) and 8oC (minimum). The soil type is Nitisols with soil ph in the range of 6.0 -7.5(Nigussie and Mesfin, 1994). Description of Test Materials A total of forty-nine mustard land races that include one local check and one standard check were used in this study. The majority of the landraces represent the national collection from different major mustard growing regions of the country and that are maintained at HARC. The accessions were obtained kindly from Holetta agricultural research center of highland oil crops improvement project. The details of the accessions used in the experiment are given in Table 1 . Table 1: List of 49 Ethiopian mustard genotypes used in the study and their origin No. Accession number Area of collection Altitude(m) Latitude Longitude 1 PGRC/E 20001 West Wollega/Arjo 2420 08-44-00N 36-40.00E 2 '' 20002 Bale Zone/Kitu 2500 06-.59.00N 39-12-00E 3 '' 20004 South Gonder/Liba 1980 12-.05-00N 37-44-00E 4 '' 20005 SouthGonder/Debretabor 1830 11-57-00N 37-37-00E 5 '' 20006 South Gonder/Debretabor 1980 11-50-00N 37-37_00E 6 '' 20007 North Gonder/Woger/Dabat 2500 * * 7 '' 20017 West Gojiam /Awi /Dangila 1980 11-.20-00N 36-58-00E 8 '' 20056 West Shewa/Jibatenamecha 2200 09-01-00N 38.-20-00E 9 '' 20065 West Shewa/Jibatenamecha 2200 08-58-00N 37-30.00E 10 '' 20066 West Shewa/Ambo 1950 08-.59.00N 37-48-00E 11 '' 20067 West Shewa/Ambo 2010 08-.58-00N 37-52-00E 12 '' 20076 SNNP/Wenago 1853 06-23-00N 38-20-00E 13 '' 20077 South East Tigray/Inderta 2000 13-29-00N 39-30.00E 14 '' 20112 West Gojam/JabiTehnan 1980 10-.39.00N 37-24-00E 15 '' 20117 West Shewa/Jibatnamecha 2050 08-.58-00N 38-01-00E 16 '' 20127 West Shewa/chelia 1700 09-03-00N 37-10-00E 17 '' 20133 West Shewa/Menagesha 2600 09-11-00N 39-09.00E 18 '' 20134 West Shewa/Jibat 2200 08-.58.00N 37-30-00E 19 '' 20146 West Gojam/Bahirdarzuria 1980 11-.25-00N 37-12-00E 20 '' 20165 West Gojiam/Awi/Dangila 1980 11-20-00N 36-58-00E 21 '' 20166 West Gojiam/Awi/Dangila 1980 11-20-00N 36-58.00E 22 '' 21008 Arsi/Gedeb 2380 07-.12.00N 38-09-00E 23 '' 21012 West shewa/Dendi 2900 09-.14-00N 38-53-00E 24 '' 21017 West Shewa/Gendbert 2470 09-43-00N 37-46-00E 25 '' 21026 West GojiamAwi/Dangila 2000 11-18-00N 36-58.00E 26 '' 21035 West Gojam/Sekela 2540 10-.50-00N 37-04-00E 27 '' 21037 West Gojiam/Awi/Dangila 2165 11-.14-00N 36-51-00E
- 3. 28 '' 21068 Bale/Adaba 2500 07-01-00N 39-25-00E 29 '' 21157 SNNP /South omo 2830 06-19-00N 38-52-00E 30 '' 21225 East Gojam/Enemay 2000 10-.32-00N 38-09-00E 31 '' 208411 West Gonder/Debretabor 2150 11-.50-00N 37-35-00E 32 '' 229665 West Gojam/Burie 2050 10-33-00N 37-34-00E 33 '' 237048 Arsie-Robe 2350 07-08-00N 40-00.00E 34 '' 241907 South Gonder/Fogera 1825 12-.01-00N 37-43-00E 35 '' 241910 South Gonder/Farta 2289 11-.49-00N 38-00-00E 36 '' 242856 Arsi zone /Sherka 2360 07-32-64N 39-37-87E 37 '' 242858 Arsi zone /Sherka 2360 07-34-27N 39-31-24E 38 '' 243738 South Wollo/Desiezuria 2928 11-08-00N 39-13-00E 39 '' 243739 South Wollo/Tenta 2950 11-.14-00N 39-15-00E 40 '' 21256 West Gojam/Bahirdarzuria 1940 11-16-00N 36-59-00E 41 '' 243750 Wollo/kalu 2020 11-45-00N 39-47.00E 42 '' 2243756 South Gonder/ Debark 3115 11-.08.00N 37-56-00E 43 '' 243761 GonderZuria 2050 12-.19-00N 37-33-00E 44 '' 243763 South Gonder/Kemkem 2070 11-57-00N 37-37-00E 45 '' 208556 West Shewa/AdisAlem 2200 * * 46 '' 208585 East Shewa/yerer 1600 * * 47 Yellow dodolla Bale/Dodolla 2500 06-.59-00N 39-12-00E 48 (ZemX Yellow Dodolla ) Cross 2400 09-00-00N 38-00-00E 49 Local check Holetta area 2400 09-00-00N 38-00-00E Source: Holetta highland oil crops research program,*=information not found Experimental Design, Management and Season The experiment of the trial for the seed sample taken was carried out from June 2013 to December 2013. The experiment was laid out in simple lattice design with two replications. A plot of seeds sample was taken from harvested four central rows of each three-meter long and 30Cm spacing between rows and used for oil and fatty acid data collection. Each replication had seven blocks and each block was represented by seven plots. The path between blocks was 2 m and the spacing between plots with in sub-blocks was also 0.6 m. Each entry was manually drilled a rate of 10 kg/ha and urea and phosphorous fertilizers were applied at the rates of 46/69 kg/ha N/P2O5respectively following the national recommendations. All other recommended agronomic and cultural practices were carried out following practices described by Adefris(2005). Data Collected for Analysis 1. Oil content (Oc): The oil content percent data were collected for Ethiopian mustard land races by using Nuclear Magnetic Resonance Spectroscope (NMRS). It was measured as percentage of fats in the seed. A sample of 22 g of seeds was dried in an oven for 2 and half an hour at 780C and cooled for 30 minutes in desiccators. The proportion of oil in the seed to total oven dried seed weight measured by Nuclear Magnetic Resonance Spectroscope as described by Oregon State University seed laboratory.WWW.Seedlaboregonstate.ed/node/ 158. 2. Oil fatty acid analysis: Three gram of the forty nine Ethiopian mustard land races seeds sample was scanned by NIRS (Near Infrared Reflectance Spectroscopy ) to determine oil fatty acid compositions (palmitic, stearic, oleic, linoleic ,lonolenic and erucic ) on percentage basis. Data Analysis Analysis of variance The data collected for oil content percent and fatty acid composition traits were subjected to analysis of variance (ANOVA) for simple lattice design. Analysis of variance was done using Proc lattice and Proc GLM procedures of SAS version 9.2, (SAS Institute, 2008). Analysis of variance (Table 2) for the considered traits was done using the model for lattice design as follows: ) ( ) ( ) / ( ) ( j eil j l r b rj ti u j Yil Where, ) ( j Yil is the observation of the treatment ) , ,.... 1 ( 2 k V i i , in the block ) ,... 1 ( k l l of the replication ) ,..., 1 ( m j j ; µ is a constant common to all observations; ti is the effect of the treatment i; rj is the effect of the replication j; (b|r) l (j) is the effect of the block l of the replication j; ) ( j il e is the error associated to the observation Yil(j), where eil(j independent. RESULTS AND DISCUSSION Analysis of Variance The analysis of variance for the oil and fatty acid composition traits studied is given in Table 2. The analysis of variance showed that there were highly significant
- 4. Fekadu A. 1042 differences among genotypes for all traits compared. The highly significant difference indicates the existence of genetic variability among the land races that is important for selection and breeding progranm. Similarly Yared,(2010) studied thirty six genotypes of mustard for oil content and fatty acid composition (palmitic, stearic, oleic, linoleic linolenic and erucic acid ) of traits found the same result. Variation in fatty acid compositions among the Ethiopian mustard germplasm accessions has also been reported by Nigussie et al., (1999) and Adefris(2005). Table 2: Simple Lattice analysis of variance and expected mean square Source of variation Df SS MS F-value Replication(r) r-1 SSr MSr MSr/MSe Genotype(g) g-1 SSg MSg MSg/MSe Block within replication r(b-1) SSb MSb MSb/MSe Intra-block error (b-1)(rb-b-1) SSe MSe Total rb2-1 SST Where, D.F. = degree of freedom, SS sum of squares MS : mean of squares ,SS rand MSr sum of squares and mean of replication, respectively: SSg and MSg are sum of squares and mean of genotypes, respectively: SSb and MSb are sum of squares and mean of blocks within replication respectively. SSe and MSe are sum of squares and mean of intera-block error. Estimation of phenotypic and genotypic variability The variability present in the population was estimated by simple measures, namely range, mean, standard error, and phenotypic and genotypic variances and coefficients of variations. The phenotypic and genotypic variance and coefficients of variations was also estimated as per the procedure suggested by Burton and De Vane (1953) as follows: e g p 2 2 2 r MSe MSg g 2 Where, g 2 =Genotypic variance P 2 = Phenotypic variance e 2 = Environmental (error) variance or Error mean square MSg = mean sum square due genotypes (accessions) MSe =mean sum square of error (environmental variance) r = number of replications Phenotypic Coefficient of variation (PCV), 100 __ 2 x x p PCV Genotypic coefficient of variation (GCV), 100 __ 2 x x g GCV __ x = Population mean of the character being evaluated Heritability (in broad sense) Heritability in the broad sense for quantitative characters was computed using the formula suggested by Singh and Chaudhary (1985): 100 2 2 x p g H Where, H= heritability in the broad sense. g 2 = Genotypic variance and p 2 = Phenotypic variance. Expected genetic advance (GA) The genetic advance (GA) for selection intensity (K) at 5% was calculated by the formula suggested by Allard (1960) as: H K GA P Where, GA = expected genetic advance, p =phenotypic standard deviation on mean basis, H= Heritability in broad sense, K =selection differential (k=2.06 at 5% selection intensity) Genetic advance (as percent of mean) (GA) was computed to compare the extent of predicted genetic advance of different traits under selection using the formula: 100 ___ X GA GA Where, __ x =population mean of the quantitative character, GA =genetic advance as percent of mean.
- 5. Int. J. Plant Breed. Crop. Sci. 1043 RESULTS AND DISCUSSION Analysis of Variance The analysis of variance for the oil and fatty acid composition traits studied is given in Table3.The analysis of variance showed that there were highly significant differences among genotypes for all traits compared. The highly significant difference indicates the existence of genetic variability among the land races that is important for selection and breedingprogram. Similarly Yared(2010) studied thirty six genotypes of mustard for oil content andfatty acid composition(palmitic, stearic, oleic, linoleic linolenic and erucic acid ) of traits found the same result. Variation in fatty acid compositions among the Ethiopian mustard germplasm accessions has also been reported by Nigussie et al., (1999) and Adefris(2005). Table 3: Mean squares for different sources of variations for oil and fatty acid traits of 49 Ethiopian mustard Genotypes Characters Genotype (48) Block (12) Replication(1) Intera-block error (36) Oil content 3.4446** 1.3825ns 217.51 1.1283 Palmitic acid 0.2691** 0.0661 0.0072 0.05179 Stearic acid 0.034** 0.0073 0.0002 0.00757 Oleic acid 2.2211** 1.1983 4.1164 0.598 Linoleic acid 2.2839** 1.5701 4.1291 0.4673 Linolenic acid 11.342** 1.444 7.3909 1.3781 Erucic acid 7.165** 4.959 23.078 1.846 ** Significant at p = 0.01 significance level, respectively; Mean and Range Values of oil and fatty acid composition Traits The mean and range values of the studied 49 genotypes of Ethiopian mustard land races for oil and fatty acid composition traits are presented in Table4. Regarding seed oil and fatty acid composition traits, the oil content, palmitic, stearic, oleic, linoleic, linolenic and erucic acid of the genotypes ranged from 39.1 to46.0, 2.76 to 4.55. 0.64 to 1.17%, 6.91 to 11.51, 15.59 to 20.09, 7.61 to 17.39 and 40.09-49.07,respectively. The highest palmic mean value was shown by the genotype PGRC/E21225 where as the lowest was by the genotype PGRC/E20065. The highest value of stearic acid (1.17)was shown by the genotype PGRC/E 208411 and the lowest (0.64) by genotype PGRC/E 21008.The highest value of oleic acid(11.51) was shown by genotype PGRC/E 20017, whereas the lowest(6.91) was by genotype (zem x yellow). The highest value (20.09) for linoleic acid was recorded by genotype PGRC/E 21225 and the lowest (15.59) was recorded by genotype PGRC/E 21017.The highest mean value (17.39) for linolenic acid was recorded by genotype PGRC/E 21008 and the lowest (7.61) was recorded by genotype PGRC/E 208411. Among tested genotypes the highest oil content percent (46.0%) was recorded for PGRC/E 208585 and the lowest (39.1%) for the genotype PGRC/E20133 (Table4). Generally; these results indicate that those traits which had wide range of variations will serve for breeding and selection for improvement of the trait desired. Table 4: Mean and range values of tested genotypes for oil and fatty acid composition traits determined by NMRS and NIRS Genotypes Oil content Palmitic Stearic Oleic Linoleic Linolenic Erucic acid 1 PGRC/E 20001 43.8 3.96 0.93 9.47 16.99 10.94 45.38 2 '' 20002 41.9 3.83 0.72 8.16 19.21 15.18 45.95 3 '' 20004 42.5 3.64 1.05 9.90 16.80 10.05 43.70 4 '' 20005 42.9 3.94 0.82 9.77 17.86 13.95 43.47 5 '' 20006 42.7 3.46 0.97 9.50 16.88 10.83 43.53 6 '' 20007 43.2 3.60 0.86 8.74 16.96 12.33 44.63 7 '' 20017 43.5 3.40 1.05 11.51 16.82 10.54 40.47 8 '' 20056 41.8 3.79 0.98 9.50 17.24 10.18 44.13 9 '' 20065 41.0 2.76 1.14 9.75 15.99 9.42 40.09 10 '' 20066 42.2 4.09 1.03 10.42 16.20 10.38 44.30 11 '' 20067 44.0 4.09 0.95 9.25 16.96 12.76 45.70
- 6. CV= coefficient of variation, LSD=least significant,NMR=Nuclear magnetic resonance, NRIS=near infrared reflectance spectroscopy Analysis of Genetic Parameters Genotypic and phenotypic coefficient of variation Estimates of genotypic variance and phenotypic variances, genotypic coefficient of variation (GCV), phenotypic coefficients of variation (PCV), heritability in broad sense, expected genetic advances and genetic advances as percent mean are given in Table5. Estimated genetic variance ranged from 0.0132% for stearic acid to4.9822% for linolenic acid (Table5). Likewise phenotypic variance ranged from 0.04159% for stearic acid to 12.7205% for linolenic acid. Genotypic 12 '' 20076 43.0 3.47 1.02 9.30 17.00 10.24 43.46 13 '' 20077 42.1 4.42 0.67 7.20 18.30 16.44 49.07 14 '' 20112 45.4 3.56 1.00 9.51 16.75 10.67 42.25 15 '' 20117 43.0 4.02 1.09 9.51 16.31 9.24 43.68 16 '' 20127 42.4 4.08 1.02 11.36 16.83 10.39 41.83 17 '' 20133 39.1 4.51 0.90 9.56 19.37 13.57 45.66 18 '' 20134 42.4 4.26 1.02 10.27 16.12 10.07 44.22 19 '' 20146 43.7 3.85 0.91 9.73 18.42 12.61 42.97 20 '' 20165 44.7 3.65 0.95 10.17 16.35 11.46 42.41 21 '' 20166 43.5 3.81 0.93 9.98 17.00 12.28 43.95 22 '' 21008 43.5 3.61 0.64 7.50 18.65 17.39 46.41 23 '' 21012 43.2 3.35 1.10 10.73 16.98 9.71 40.61 24 '' 21017 42.6 3.67 1.10 10.39 15.59 9.27 43.03 25 '' 21026 45.5 3.78 1.07 10.41 16.72 9.21 42.57 26 '' 21035 43.3 3.96 0.91 10.29 17.96 12.26 43.74 27 '' 21037 43.1 3.69 1.05 10.52 17.72 10.54 41.80 28 '' 21068 41.3 3.19 0.72 7.24 17.42 14.78 46.82 29 '' 21157 41.1 3.57 0.92 10.07 17.28 14.26 41.81 30 '' 21225 41.5 4.55 0.79 9.72 20.09 15.17 44.68 31 '' 208411 43.9 3.32 1.17 10.75 17.32 7.61 42.63 32 '' 229665 43.7 4.13 1.05 9.69 16.98 9.78 43.28 33 '' 237048 41.5 4.27 0.71 7.32 18.76 12.70 48.28 34 '' 241907 41.6 3.78 0.93 9.04 16.83 10.35 45.03 35 '' 241910 43.1 3.84 0.94 10.33 17.40 12.50 44.29 36 '' 242856 41.5 4.09 0.85 8.97 18.85 13.48 43.62 37 '' 242858 41.3 4.11 0.94 10.41 17.78 11.65 43.67 38 '' 243738 41.3 4.01 0.83 9.13 18.98 15.07 45.31 39 '' 243739 44.2 4.23 0.81 8.14 18.85 14.96 46.98 40 '' 21256 44.5 3.50 1.06 9.76 16.79 8.75 41.67 41 '' 243750 42.5 3.47 0.76 8.48 19.12 15.12 44.18 42 '' 2243756 42.7 3.66 1.01 10.01 16.97 10.32 41.17 43 '' 243761 43.5 3.53 0.93 9.44 17.44 11.48 43.29 44 '' 243763 42.1 3.95 0.87 9.92 17.32 11.86 42.60 45 '' 208556 44.2 3.72 0.89 9.06 16.97 13.84 43.91 46 '' 208585 46.0 3.65 0.87 8.49 17.34 15.73 44.22 47 Yellow dodolla(YD) 44.4 3.21 0.93 8.02 17.52 14.55 43.29 48 (ZemXYD ) 43.8 3.57 0.65 6.91 18.40 16.99 46.32 49 Local check 42.4 4.44 0.85 9.57 18.43 13.10 45.69 Range 39.1-46.0 2.76-4.55 0.64-1.17 6.91-11.51 15.59-20.09 7.61-17.39 40.09-49.07 Average mean 42.9 3.8 0.92 9.44 17.5 12.16 43.91 CV (%) 2.477 5.99 9.39 8.19 3.91 9.65 3.09 LSD (0.05) 2.13 0.46 0.18 1.66 1.50 2.36 2.96
- 7. Int. J. Plant Breed. Crop. Sci. 1045 coefficients of variation ranged from 1.20% forstearic acid to6.39 % for linolenic acid. Linolenic acid (12.7205, 4.9822) and erucic acid (9.0115, 2.65935) showed high phenotypic and genotypic variances, respectively indicating that the genotypes could be reflected by the phenotype and the effectiveness of selection based on the phenotypic performance for these traits. Likewise, Yared(2010) reported high genotypic and phenotypic variance for erucic acid, linoleic, stearic, palmitic and oil content in Ethiopian mustard. Low genotypic variance as compared to environmental variance was recorded for traits such as stearic acid (0.0132), palmitic acid (0.01087), oleic (0.8116), linoleic acid(0.9083),linolenic acid(4.9822), erucic acid(2.65935)and oil content percent(1.1582). However, high genotypic coefficients of variation (GCV) and phenotypic coefficients of variation (PCV) were shown in traits such as linolenic acid (6.39, 10.21) erucic acid(2.46,4.53) and oleic acid(2.94, 5.48) respectively, which means selection of these traits based on phenotype and genotypic characteristics may be useful for oil and fatty acid improvement. This result agrees with the findings of Abebe (2006) and Aytac and Kinaci (2009). Heritability in the broad sense Breeders can make rapid progress where heritability is high by using selection methods that are dependant solely on phenotypic characteristics (e.g. mass selection). However, where heritability is low methods of selection based on families and progeny testing are more effective and efficient. Heritability estimated using the total genetic variance is called broad sense heritability. Heritability in the broad sense of the traits is presented in Table 5. In this study, heritability values were found to be sufficiently high for most important yield component characters. Dabholkar (1992) generally classified heritability estimates as low (5- 10%), medium (10-30%) and high (30-60%). Based on this classification, linolenic acid (62.58%), palmitic acid (58.19%), linoleic acid (57.46%), stearic acid (56.39%), erucic acid (54.32%), oleicacid (53.65%), oil contentpercent(50.53%), exhibited high heritability estimates. Linolenic acid was found to be the most heritable trait in the genotype, with heritability of 62.58%, followed by palmitic acid (58.19%) and linolec acid (57.46%). This indicates that selection for these traits in the genotype would be most effective for the expression of these traits in the succeeding generations. Therefore, good improvement can be made if some of these traits are considered as selection criteria in future breeding program. Similar findings had been reported by Yared (2010) showed thatfor palmitic, lenoleic, stearic and oil content of seeds. High heritability value was found for linoleic, erucic acid,stearic and palmitic acid content of seeds recorded in the current study was also recorded by Yared(2010) andAbebe(2006).According to Singh(1993), the heritability of a character is high, selection for such character is fairly easy as selected character will be transmitted to its progeny. This is because there would be a close correspondence between the genotype and phenotype due to a relatively similar contribution of the environment to the genotype. Genetic advance Concerning the genetic advance at 5% intensity the highest genetic gain was predicted for linolenic acid (4.05%) followed by erucic acid (3.18 %) and while the lowest genetic advance was predicted for stearic acid (0.22%).Genetic advance as a percent mean ranged from5.08 % for oil content to33.19% for linolenic acid(Table 5). Within this range, a relatively high genetic advance as a percent mean was observed for linolenic acid (33.19%)and stearic acid (23.89%)followed by oleic acid (18.78%). On the other side high genetic advance with high heritability was shown for linolenic acid and erucic acid which may be because of the presence of both additive and non-additive gene action (Liang et al., 1972). On the other hand, the lowest genetic gain as percent of means was observed for oil content 5.08 % followed by erucic acid7.23%.Low genetic advance as percent means observations in this study indicates that characters probably were under environmental influence than the genotypic expression and that selection based on these traits would be ineffective. Table 5: Components of variance, coefficients of variability, heritability and genetic advance and Genetic advance as percent of mean of studied traits Oil and fatty acid composition δ2g δ2e δ2ph GCV PCV h2b GA k = 5% GA/Gr and mean *100 k 5% Palmic acid 0.1087 0.21 0.32089 1.69 2.91 58.19 0.62 16.32 Stearic acid 0.0132 0.03 0.04159 1.20 2.13 56.39 0.22 23.89 Oleic acid 0.8116 2.01 2.8191 2.94 5.48 53.65 1.77 18.78 Linoleic acid 0.9083 1.84 2.7512 2.28 3.96 57.46 1.80 10.31 Linolenic acid 4.9822 7.74 12.7205 6.39 10.21 62.58 4.05 33.19 Erucic acid 2.65935 6.352 9.0115 2.46 4.53 54.32 3.18 7.23 Oil content 1.1582 3.41 4.5729 1.64 3.27 50.33 2.18 5.08 δ2g = Genotypic variance, δ2e = Error variance, δ2ph = Phenotypic variance, GCV = Genotypic coefficient of variability, PCV = Phenotypic coefficient of variability, h2b = Broad sense heritability, GA = Genetic advance and K = Selection intensity
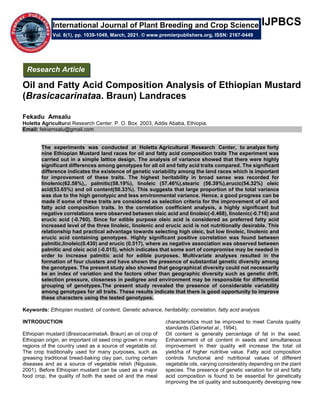
- 8. Fekadu A. 1046 Genotypic correlation coefficients among oil and fatty acid composition traits Genotypic correlation coefficients among oil and fatty acid composition traits are presented in Table6. A highly significant but negative correlations were observed between oleic acid and linoleic acid(-0.468),linolenic acid(- 0.716) and erucic acid (-0.760).Since for edible purpose oleic acid is considered as preferred fatty acid increased level of the three linoleic, linolenic and erucic acid is not nutritionally desirable. This relationship had practical advantage towards selecting high oleic, but low linoleic, linolenic and erucic acid containing genotypes which is in agreement with Islam (2009), Patel et al. (2003), Sia et al. (2004), Nigussie (2001); Adefris (2005) and Tsege et al. (2004) who found similar results., However Khan et al. (2008) reported the opposite. Highly significant positive correlation was found between palmitic, linoleic(0.430) and erucic acid (0.517), where as negative association was observed between palmitic and oleic acid (-0.015), which indicates that some sort of compromise may be needed in order to increase palmitic acid for edible purposes for which Islam (2009) reported the opposite. Erucic acid showed negative correlation with oil content (-0.200) though it was insignificant which implies increasing oil content, favors the oil for edible purpose in terms of erucic and oleic acid content. Likewise, highly significant negative correlation was found between linolenic and oil content (- 0.104). There was also highly negative correlation between oleic, linoleic(-0.468) and linolenic acid (-0.716), which is in agreement with the findings of Adefris (2005) and Kumar and Tsunda (1980), respectively. The traits association which contradicted with the previous findings might have been as a result of synchronized selection applied on the traits concerned. Table 6: Genotypic correlation coefficients among oil content and fatty acid compositiontraits in 49 Ethiopian mustard genotypes tested at Holetta, 2013/14 Traits Palmitic Stearic Oleic Linoleic Linolenic Erucicacid Oil content Palmitic 0.302* -0.015 0.430** 0.220 0.517** -0.274* Stearic 0.794** -0.726** -0.909** -0.766** 0.183 Oleic -0.468** -0.716** -0.760** 0.031 Linoleic 0.715** 0.528** -0.317* Linolenic 0.630** -0.104 Erucic acid -0.200 Oil content *, ** significant at p < 0.05 and p < 0.01 significance level respectively Clustering of genotypes using quality traits Clustering based on quality traits produced clear grouping of the 49 genotypesinto four clusters Fig 1. The highest 61.22 % of the genotypes were grouped under C1 followed by 24.49 % in C3 and 12.24% in C2, 2.04% in C4. In quality traits clustering, Cluster 1 the largest of a of all included 30(61.22 %) genotypes that comprised nine genotypes each from West Shewa, West Gojiam and South and North Gonder, one genotypes each from Southern Nation Nationalities West Wollega and Arsi zone respectively. The second cluster (cluster2) comprises 6 (12.24%) genotypes 2 from Bale zone , one genotype each from Arsie zone ,South Wollo, South Tigray and cross. Local check and standard check was also included in cluster 3. Cluster3 comprised 12(24.48%) genotypes. Four Genotypes were from West and East Shew, 2genotypes from West and East Gojiam and South Wollo, 1genotype each from Southern Nations nationalities and Bale zone. There are also genotypes with the same geographical origin but grouped in different clusters and genotypes with different geographic origin groped in the same cluster. Solitary genotype in C4 was Arsi zone origin. Cluster means for quality traits Intra-class average genetic divergence of Ethiopian mustard for quality traits is shown in Table 7. Genotypes of C4 showed the highest mean palmatic fatty acid content than other clusters. On the other side highest stearic, oleic and low erucic fatty acid content was found in C1 cluster than other clusters. High linoleic and erucic acid content showed in C4 Genotypes and high oil content with low erucic acid was cluster in C1. Table 7.Clusters means for quality traits of the Ethiopian Mustard genotypes Cluster Traiats C1 C2 C3 C4 Mean Mean Mean Mean Palmitic 3.73 3.81 3.92 4.27 Stearic 1.00 0.70 0.86 0.71 Oleic 9.99 7.53 9.21 7.32
- 9. Linoleic 16.9 18.47 18.35 18.76 Linolenic 10.57 15.96 14.20 12.70 Erucic acid 43.10 46.93 44.07 48.28 OC 43.20 42.72 42.42 41.50 C1= cluster 1, C2= Cluster2, C3= Cluster3, C4=, ClusteR4, OC=Oil content SUMMARY AND CONCLUSION In this study, 49 Ethiopian mustard genotypes acquired from diverse zones/regions of Ethiopia were evaluated in simple lattice design with two replications at Holetta Agricultural Research Center, West Shewa zone, with the objective ofestimating the variability, heritability and genetic advance for oil content and fatty acid composition analysis of Ethiopian mustard land races: The analysis of variance showed that there were highly significant differences among genotypes for all traits compared. The highly significant difference indicates the existence of genetic variability among the land races that is important for selection and breeding program. High phenotypic coefficient of variation (PCV) was recorded for linolenic acid, oleic acid and erucic acid. But low PCV was detected for stearic and palmitic acid. Generally, the magnitudes of phenotypic coefficient of variation (PCV) and genotypic coefficient of variation (GCV) were high for linoleinic acid and oleic acid. Heritability in broad sense estimates was high for linolenic,palmitic, linoleic, stearic, erucic acid,oleic acid and oilec content percent. Genetic advance as percent of the mean (GAM) was high for linolenic acid, stearic acid and plamitic acid.Oil content percent showed positive correlation with stearic and oleic acid, which indicates that taking in to account oil content and stearic as selection criteria will be an effective way to increase oil palatability. Palmitic, linoleic and erucic acid showed negative correlation on oil content which shows improvement in increasing these traits may be at the expense of the oil content. The present study revealed the presence of considerable variability among genotypes for all traits compared. These conditions indicate that there is good opportunity to improve these characters using the tested genotypes. Multivariate analyses of genetic divergence among genotypes have resulted in the formation of four clusters, and have shown the presence of genetic variability for further selection and breeding. Genetic distances among most clusters were significant from which selection of parents may be made for crossing in order to obtain genetic recombination and transgressive segregants. Genotypes for maturity earliness may be obtained from C1. Likewise, genotypes in C2, C3 and C4 may used for improvement of seed yield, oil yield and oil content respectively. Parental material for improvement of seed oil of Ethiopian mustard may be obtained from those genotypes which have high oleic but low erucic acid content in the seed oil in C1. On the other hand, genotype in C4 has shown highest erucic acid content in its seed oil which may be used as sources of genes in efforts of breeding for industrial purposes. Genotypes formed in C1 could also be used for their high oil content. It is also suggested that further work on crossing and pedigree selection among the genotypes studied is needed in order to get the desired level of oleic, linoleic, linolenic and erucic acid for both food and non- food industry, while improving other seed yield components and agronomic traits. REFERENCES Abebe Delesa(2006). Genetic Variability and Association Among Seed Yield and Yield Related Traits in Ethiopian mustard (Brassica carinata A. Braun) at Kulumsa, Arsi. An M.Sc. Thesis Presented to the School of Graduate Studies of Alemaya University. 75p. Adefris Teklewold (2005). Diversity Study Based on Quality Traits and RAPD Markers and Investigation of Heterosis in Ethiopian Mustard. Ph.D. diss. Georg-August Univ. of Göttingen, Germany. 161p. Allard, R.W(1999).. Principles of plant breeding. 2thed. New York, John Wiley & Sons,254 p. ISBN 978-0-471-02309-8. Aytaç, Z. and G. Kınac.(2009). Genetic variability and association studies of some quantitative characters in winter rapeseed(Brassica napus L.). African Journal of Biotechnology,8 (15): 3547-3554. Burton, G.W.and E.H.de Vane (1953). Estimating heritability in tall fescue(Festuca arundinacea) from replicated clonal material. Agron. J. 45: 478- 481. CSA (Central Statistical Authority). (2013/14). Report on land utilization: Private peasant holdings, 'Meher' season. Statistical bulletin. Addis Ababa, Ethiopia. Dabholkar, A.R.(1992).Elements of biometrical genetics. Concept Publishing Company, New Delhi, India.431p. Getinet, A., G. Rakow, J.P. Raney and R.K. Downey.(1994). Development of zero erucic acid Ethiopian mustard through an interspecific cross with zero erucic acid oriental mustard. Can. J. Plant Sci. 74: 793-795. Islam, M. S., L . Rahman and M. S. Alam.(2009). Correlation and path coefficient analysis in fat and fatty acids of rapeseed and mustard. Bangladesh J. Agril. Res. 34(2): 247-253.
- 10. Fekadu A. 1048 Khan, S., Farhatullah, H. Iftikhar, Khalil, M. Iqbal, M. Yasir Khan and A. Naushad.(2008). Geneticvariability for morphological traits in F3:4 Brassica populations. Sarhad J. Agric. 24(2): 217-222. Kumar, P.R. and S. Tsunoda.(1980). Variation in Oil Content and Fatty acid Composition among seeds from the Cruciferae.pp. 235-283. Liang, G.H., C.R. Reddy and A.D. Dayton.(1972). Heterosis, inbreedign depression and heritability estimates in a systematic series of grain sorghum genotypes. Crop Sci. 12(4):409-411. Nigussie Alemayehu.(2001). Germplasm diversity and Genetics of Quality and Agronomic Traits in Ethiopian Mustard (Brassica carinata A. Braun). Ph. D. Thesis, George-August University of GÖttingen, Germany Nigussie, A., H. Becker and G. Gebeyehu. (1999). Genetic variability in Ethiopian mustard (Brassica carinata A. Braun) for quality characteristics. 10th International Rapeseed Congress, Canberra, Australia. Nigussie Alemayehu and Mesfin Abebe.(1994). Relative importance of some managmnet factors in seed and oil yields of Ethiopian mustasrd (Brasica carinata Braun.) and Rapeseed (Brasica napus L.). Ethiop. J. Agric. Sci. 14: 27-36 Patel, K. M., K.P. Prajapati, C. J. Patel and N. P. Patel (2003).Variability and correlation studies for fatty acids in Indian mustard. Brassica 5(3-4): 72-74. SAS Institute INC.(2002-2008). SAS*STAT, users guide, version 9.2, Cary N.C., SAS INC Sia, P., B. Singh, J. N. Sachan and R. K. Pattnaik.(2004). Correlation among quality traits in toria (Brassica rapa L. sp. toria). Environment and Ecology, 22(2) :316-318 Singh, B. D. (1993). Plant breeding principles and methods. Kalyani Publishers, Ludhiana, New Delhi. Singh, R.K.and B.D. Chaydhary (1985). Biometrical methods in quantitative genetic Analysis Tsege, G., T., M.T. Labuschagne and A. Hugo. (2004). Genetic relationships among Ethiopian mustard genotypes based on oil content and fatty acid composition. African J. Biotech. 4: 1256- 1268. www. Seed laboratory Oregon state university. Oil, Protein and moisture Determination using NMR Yared Semahegn (2010). Genetic diversity and Relationship among Association amongEthiopian mustard (Brassica carinata A. Braun) genotypes based on their agronomic and quality Traits in at Holetta Agricultural research,. An M.Sc. Thesis Presented to the School of Graduate Studies of Jima University. 75p. Accepted 26 January 2021 Citation: Fekadu Amsalu (2021). Oil and Fatty Acid Composition Analysis of Ethiopian Mustard (Brasicacarinataa. Braun) Landraces. International Journal of Plant Breeding and Crop Science, 8(1): 1039-1049. Copyright: © 2021: Fekadu A. This is an open-access article distributed under the terms of the Creative Commons Attribution License, which permits unrestricted use, distribution, and reproduction in any medium, provided the original author and source are cited
- 11. 11 Int. J. Plant Breed. Crop. Sci. 1049 Semi-partial R-squared Figure1. Dendrogram which shows the distribution of the 49 Ethiopian mustard genotypes based on quality traits 0.0 0.5 1.0 1.5 2.0 Name of Observation or Cluster 1 1 5 6 3 4 3 7 3 8 2 3 4 9 2 4 3 9 3 6 4 1 4 6 4 2 8 5 7 1 3 4 5 3 2 1 6 4 2 3 0 4 3 2 2 3 1 2 6 3 3 1 1 1 2 3 5 4 8 2 7 1 4 2 0 1 8 1 9 2 1 4 0 2 8 3 1 0 2 9 4 4 9 1 7 2 5 4 7 Cluster I Cluster II C luster IV Cluster I ClusterIII