
Recommended
More Related Content
What's hot
What's hot (20)
Similar to Lecture 1.6 further graphs and transformations of quadratic equations
Similar to Lecture 1.6 further graphs and transformations of quadratic equations (20)
More from narayana dash
More from narayana dash (12)
Recently uploaded
Recently uploaded (20)
Lecture 1.6 further graphs and transformations of quadratic equations
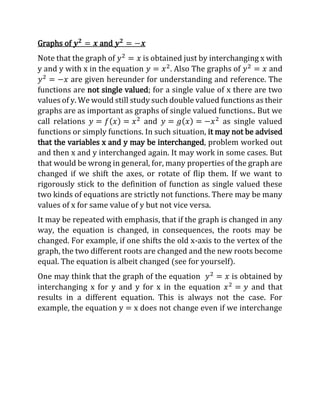
- 1. Graphs of 𝒚𝟐 = 𝒙 and 𝒚𝟐 = −𝒙 Note that the graph of 𝑦2 = 𝑥 is obtained just by interchanging x with y and y with x in the equation 𝑦 = 𝑥2 . Also The graphs of 𝑦2 = 𝑥 and 𝑦2 = −𝑥 are given hereunder for understanding and reference. The functions are not single valued; for a single value of x there are two values of y. We would still study such double valued functions as their graphs are as important as graphs of single valued functions.. But we call relations 𝑦 = 𝑓(𝑥) = 𝑥2 and 𝑦 = 𝑔(𝑥) = −𝑥2 as single valued functions or simply functions. In such situation, it may not be advised that the variables x and y may be interchanged, problem worked out and then x and y interchanged again. It may work in some cases. But that would be wrong in general, for, many properties of the graph are changed if we shift the axes, or rotate of flip them. If we want to rigorously stick to the definition of function as single valued these two kinds of equations are strictly not functions. There may be many values of x for same value of y but not vice versa. It may be repeated with emphasis, that if the graph is changed in any way, the equation is changed, in consequences, the roots may be changed. For example, if one shifts the old x-axis to the vertex of the graph, the two different roots are changed and the new roots become equal. The equation is albeit changed (see for yourself). One may think that the graph of the equation 𝑦2 = 𝑥 is obtained by interchanging x for y and y for x in the equation 𝑥2 = 𝑦 and that results in a different equation. This is always not the case. For example, the equation y = x does not change even if we interchange
- 2. the variables. We see that these graphs are also parabolas, with their axis of symmetry being along the x-axis instead of along the y-axis. We have seen that the graph of 𝑦 = 𝑎𝑥2 , 𝑦 = 𝑎𝑥2 + 𝑏𝑥 + 𝑐 etc. are got by scaling the graph of 𝑦 = 𝑥2 and scaling and shifting the graph of 𝑦 = 𝑥2 without changing their axis of symmetry. Parabolas whose axis of symmetry is not parallel to x-axis or y-axis Can we have parabolas having their axis of symmetry in any direction, not particularly along the x-axis or y-axis? If we can have such parabolas, is their corresponding equation a quadratic equation? If they are, are they of the type 𝑦 = 𝑎𝑥2 + 𝑏𝑥 + 𝑐 or any other expression not like this? The key question is, if we rotate a parabola through an angle, what is the result? Graph of 𝑥 = 𝑦2 Graph of 𝑥 = −𝑦2
- 3. Let there be a parabola 𝑌 = 𝑋2 in XY axes (Black Axex) and B(X,Y) be any point on it, described by 𝑋 = 𝑡, 𝑌 = 𝑡2 , describing the equation 𝑌 = 𝑋2 in terms of a single parameter ‘t’ instead of two variables ‘X’ and ‘Y’, while keeping relationship between the two variables intact. Such an equation like 𝑋 = 𝑡, 𝑌 = 𝑡2 is called ‘parametric equation’ of the parabola 𝑌 = 𝑋2 . There can be many parametric forms as such. The XY axes are at an angle θ with our standard xy-axes (Blue Axes). From B, drop a perpendicular BA on the X-axis, and a perpendicular BC on Y axis, and a perpendicular BR on x-axis. From A drop a perpendicular AQ on the x-axis and from B drop a perpendicular BP on QA extended. Let the ∠AOQ=θ. Since B is the point 𝑋 = 𝑡, 𝑌 = 𝑡2 on the parabola in the XY axes, 𝑂𝐴 = A x’ x O C B y y’ P Q R θ θ t 𝑡2 X Y
- 4. 𝑡, 𝐵𝐴 = 𝑡2 . It is easily seen that OABC is a rectangle, as well as PBRQ. Apply similar triangles to ΔAOQ and ΔBOP, to show ∠BAP=θ. We have to find out the coordinates of the point B ,i.e., OR and RB and explore how they are related. Now we can easily show that 𝑂𝑄 = 𝑡 cos 𝜃 , 𝐴𝑄 = 𝑡 sin 𝜃, 𝐴𝑃 = 𝑡2 cos 𝜃, and 𝐵𝑃 = 𝑡2 sin 𝜃. So, −𝑂𝑅 = 𝑄𝑅 − 𝑄𝑂 = 𝐵𝑃 − 𝑂𝑄. (𝑂𝑅 = 𝑥). Hence 𝑥 = 𝑡 cos 𝜃 − 𝑡2 sin 𝜃 …………………………...(1) Similarly, 𝐵𝑅 = 𝑃𝑄 = 𝑃𝐴 + 𝐴𝑄 Or, 𝑦 = 𝑡 sin 𝜃 + 𝑡2 cos 𝜃, ………………………………..(2) To find the relation between x and y we have to eliminate t from these two equations. Multiply eqn.(1) by cos 𝜃 and eqn.(2) by sin 𝜃 and add. 𝑥 cos 𝜃 = 𝑡 cos2 𝜃 − 𝑡2 sin 𝜃 cos 𝜃 𝑦 sin 𝜃 = 𝑡 sin2 𝜃 + 𝑡2 sin 𝜃 cos 𝜃 Adding, we get, 𝑥 cos 𝜃 + 𝑦 sin 𝜃 = 𝑡 cos2 𝜃 + 𝑡 sin2 𝜃 Or, 𝑥 cos 𝜃 + 𝑦 sin 𝜃 = 𝑡…………………………………..(3) Putting this value of t in eqn. (2) we get,
- 5. 𝑦 = (𝑥 cos 𝜃 + 𝑦 sin 𝜃) sin 𝜃 + (𝑥 cos 𝜃 + 𝑦 sin 𝜃)2 cos 𝜃 Or, 𝑦(1 − sin2 𝜃) − 𝑥 cos 𝜃 sin 𝜃 = (𝑥 cos 𝜃 + 𝑦 sin 𝜃)2 cos 𝜃 Or, 𝑦 cos2 𝜃 − 𝑥 cos 𝜃 sin 𝜃 = (𝑥 cos 𝜃 + 𝑦 sin 𝜃)2 cos 𝜃 Or, 𝑦 cos 𝜃 − 𝑥 sin 𝜃 = (𝑥 cos 𝜃 + 𝑦 sin 𝜃)2 ………….(4) This is the equation of the parabola 𝑌 = 𝑋2 in XY axes which becomes 𝑦 cos 𝜃 − 𝑥 sin 𝜃 = (𝑥 cos 𝜃 + 𝑦 sin 𝜃)2 in the regular xy-axes. Since we have just rotated the XY axes into the xy- axes, the parabola remains the same but the equation changes. A close look at equation (4) tells us that the XY-axis has rotated through an angle – 𝜽 to become xy-axes and the equation 𝑌 = 𝑋2 has become 𝑦 cos 𝜃 − 𝑥 sin 𝜃 = (𝑥 cos 𝜃 + 𝑦 sin 𝜃)2 . In other words, from equation (3), as 𝑡 = 𝑋, we may write 𝑥 cos 𝜃 + 𝑦 sin 𝜃 = 𝑋…………………………………..(5) Again from eqn. (4), we may write, 𝑦 cos 𝜃 − 𝑥 sin 𝜃 = 𝑌…………………………………....(6) The situation may be viewed from a different perspective. When XY- axis has rotated through an angle – 𝜽 to become xy-axes, this is just in other words, xy-axis has rotated through an angle 𝜽 to become XY-axes. Now 𝐜𝐨𝐬(−𝜽)=𝐜𝐨𝐬 𝜽 and 𝐬𝐢𝐧(−𝜽)=− 𝐬𝐢𝐧 𝜽. So we can rewrite eqn.(5) and eqn.(6) as 𝑋 cos 𝜃 − 𝑌 sin 𝜃 = 𝑥…………………………………..(5’) and
- 6. 𝑌 cos 𝜃 + 𝑋 sin 𝜃 = 𝑥…………………………………....(6’) For now we have explored shifting, scaling and rotating the coordinate axex, at least the orthogonal Cartesian axes. Note that when the old axes are shifted by, h and k respectively (the origin at (0,0) shifted to the point (h, k) to form a new set of axes, from the perspective of new axes the old axes are shifted just by (−ℎ, −𝑘) respectively. Similarly when any old axis is scaled (magnified) by a factor ‘a’, from the perspective of new axes, the corresponding old axis is scaled by a factor 1/a . Notice that shifting or rotation do not change dimensions of the graph, although they change the equation which the graph represents. Whereas scaling changes the dimension of the graph as well as the equation of the graph. Flip about an axis is rotation of the graph by 1800 .