SlideShare ist ein Scribd-Unternehmen logo
1 von 1
Downloaden Sie, um offline zu lesen
Correlating nutritional values of grasses, legumes, and broadleaf weeds
                         Shockey,                    W.L. 1;            Rayburn,                      E.B.2;             Basden,                                     T 3;              Seymore,                                         D.A.4;                Smith,                                      B.D.5

                                                                              1Extension
                                                                                   Agent, West Virginia University, Kingwood, WV, 26537
                                                                  2Forage Extension Specialist, West Virginia University, Morgantown, WV, 26506
                                                           3Nutrient Management Extension Specialist, West Virginia University, Morgantown, WV, 2650
                                                                         4Extension Agent, West Virginia University, Franklin, WV, 26807
           646                                                          5Extension Agent, West Virginia University, Petersburg, WV, 26847


                   ABSTRACT                                                           INTRODUCTION
Most pastures contain grasses (gr), legumes (leg), and           Climatic conditions in West Virginia are good for forage growth,                                                                             CP                                                                                                       NDF
broadleaf weeds (blw). Each class of forage has unique           which can then be used as feed for ruminant livestock. Most
                                                                                                                                                                     30        CPleg = 0.73CPgra + 11.40                                                                           70
nutritional characteristics both in terms of plant               pastures contain grasses, legumes, and broadleaf weeds as primary                                                                                                                                                           NDFleg = 0.53NDFgra + 8.02
                                                                                                                                                                                R2 = 0.44, SDreg = 2.8
composition and animal utilization. In the Appalachian           forage species. Each of these forage classes has unique nutritional                                                                                                                                               60          R2 = 0.33, SDreg = 4.2
                                                                                                                                                                     25
region, gr are the dominant forage species. The growth           characteristics both in terms of plant composition and animal


                                                                                                                                                                                                                                                               % NDF, Leg or Blw
stage of most gr, which can give an indication of its            utilization.                                                                                                                                                                                                      50


                                                                                                                                              % CP, Leg or Blw
                                                                                                                                                                     20                                                                        Leg                                                                                                 Leg
nutritive value, is easily identified. Experiments were
                                                                 In the Appalachian region of the United States grasses are the                                                                                                                                                    40
conducted to measure the correlation of nutritive                                                                                                                    15                                                                        Gra                                                                                                 Gra
                                                                 dominant forage species. The readily identifiable growth stage of
components of gr compared to leg and blw at similar                                                                                                                                                                                                                                30
                                                                 grasses can give an indication of its nutritive value. To apply this                                                                                                          Blw                                                                                                 Blw
stages of re-growth. Sixteen pastures were sampled                                                                                                                   10                                                                                                                                            NDFblw = 0.67NDFgra + 2.83
                                                                 principle to swards containing mixed classes of forage, experiments                                                                                                                                               20
between May and November during a three-year period.                                                                                                                                                                                           Linear (Leg)                                                          R2 = 0.33, SDreg = 5.3        Linear (Leg)
                                                                 were conducted to measure the relationship between the nutritive                                                                            CPblw = 1.10CPgra + 0.19
After clipping, 40 samples were hand-separated                                                                                                                       5
                                                                 components of grasses to legumes and broadleaf weeds at similar                                                                              R2 = 0.66, SDreg = 2.7                                               10
according to botanical composition then analyzed for                                                                                                                                                                                           Linear (Blw)                                                                                        Linear (Blw)
                                                                 stages of re-growth.
crude protein (CP), neutral detergent fiber (NDF), acid                                                                                                              0                                                                                                              0
detergent fiber (ADF), and total digestible nutrients            Development of a model that regresses nutritive components of                                            0           5           10          15         20         25                                                  30           40           50             60         70
(TDN). Correlations between gr and leg or between gr             different classes of forage at similar stages of re-growth for a given
                                                                                                                                                                                               % Crude Protein, Gra                                                                                            % NDF, Gra
and blw for each parameter were                                  time and space may provide a way for ranchers and researchers to
CPleg = -0.09CPgr 2 + 3.31CPgr -6.88, R2 = 0.52;                 predict how the different classes of plants respond to the unique
                                                                 environmental conditions caused by their particular grazing                                                                           Figure 1                                                                                                  Figure 2
CPblw = 1.10 CPgr + 0.19, R2 = 0.66;                             management strategy.

NDFleg = 0.53NDFgr + 8.02, R2 = 0.33;

NDFblw = 0.67NDFgr + 2.83, R2 = 0.33;                                                                                                                                                                        ADF                                                                                                       TDN
ADFleg = 0.89ADFgr – 1.62,   R2   = 0.54;
                                                                            MATERIALS AND METHODS                                                                    45
                                                                                                                                                                               ADFblw = 0.75ADFgra + 7.16
                                                                                                                                                                                                                                                                                   75 TDN = 1.20TDN – 12.50
                                                                                                                                                                                                                                                                                         leg           gra
                                                                                                                                                                     40          R2 = 0.52, SDreg = 3.3                                                                            70    R2 = 0.45, SDreg = 3.2
                                                                 Sixteen pastures which were located on farms in several regions of
ADFblw = 0.75ADFgr + 7.16,   R2   = 0.52;                                                                                                                            35


                                                                                                                                                                                                                                                               % TDN, Leg or Blw
                                                                 WV were managed to measure effects of weather, fertilizer, and


                                                                                                                                                 % ADF, Leg or Blw
                                                                                                                                                                                                                                                                                   65
                                                                 management strategies on a variety of parameters, including                                         30                                                                        Leg                                                                                                 Leg
TDNleg = 1.27TDNgr – 16.31,   R2   = 0.45; and                                                                                                                                                                                                                                     60
                                                                 botanical composition of the swards. A series of samples was                                        25
                                                                                                                                                                                                                                               Gra                                                                                                 Gra
                                                                 collected by clipping 1 foot square, randomly selected areas                                        20
TDNblw = 1.17TDNgr – 11.16, R2 = 0.36.                                                                                                                                                                                                                                             55                                TDNblw = 1.17TDNgra – 11.20
                                                                 between May and November during a three-year period.                                                                                                                          Blw                                                                                                 Blw
                                                                                                                                                                     15                                                                                                                                                 R2 = 0.36, SDreg = 3.7
Thirty-three to 66% of the variation in the nutritive                                                                                                                                                  ADFleg = 0.89ADFgra – 1.62                                                  50
                                                                 After clipping, 40 samples were hand-separated according to                                         10                                  R2 = 0.54, SDreg = 3.7                Linear (Leg)                                                                                        Linear (Leg)
components in leg and blw was accounted for by
                                                                 botanical composition as grass (gra), legume (leg), and broadleaf                                                                                                                                                 45
measuring the measurements in gr at the same stage of                                                                                                                 5                                                                        Linear (Blw)                                                                                        Linear (Blw)
                                                                 weed (blw). Separated samples were sent to the analytical
re-growth. Results suggest implications for assessing                                                                                                                 0                                                                                                            40
                                                                 laboratories of Dairy One, Cornell, NY and analyzed for crude protein
the nutritive value of pasture swards by analysis of the
                                                                 (CP), neutral detergent fiber (NDF), acid detergent fiber (ADF), and                                     10              20            30             40           50                                                  55                60                65              70
gr only.
                                                                 total digestible nutrients (TDN) by Near Infrared Reflective (NIR)                                                                 % ADF, Gra                                                                                                 % TDN, Gra
                                                                 analysis.
                                                                 For each parameter, regressions between grasses and legumes and
                                                                 between grasses and broadleaf weeds were calculated by least
                                                                                                                                                                                                       Figure 3                                                                                                  Figure 4
                                                                 squares regression techniques.


                                                               RESULTS AND DISCUSSION
                                                                                                                                                                                                                                                                                             SUMMARY
Linear regressions between grass and legume or between grass and broadleaf weeds for each nutritional component are depicted in figures 1-4.
                                                                                                                                                                                                                                         Linear regressions accounted for 33 to 66% of the variation (with a standard
Legumes contained higher concentrations of CP than both the grasses and broadleaf weeds (Figure 1). It was also noted that changes in the concentration of CP in the
                                                                                                                                                                                                                                         deviation about the regression of 2.7 to 5.3 units) in the nutritive components
grasses were more closely related to changes in the broadleaf weeds compared to legumes.
                                                                                                                                                                                                                                         in legumes and broadleaf weeds by inputting the components in grass over
NDF was lower in both legumes and broadleaf weeds compared to grasses and were positively regressed (Figure 2). ADF levels were lower in legumes compared to grasses                                                                     the same range of re-growth. These results suggest implications for
and broadleaf weeds (Figure 3).                                                                                                                                                                                                          predicting animal performance based on the botanical components of
                                                                                                                                                                                                                                         pasture swards. A larger and more comprehensive database could improve
TDN was similar over the range measured among all the 3 classes of forage (Figure 4). This supports the concept of a similar energy value across all classes of forages with
                                                                                                                                                                                                                                         the precision of regressions between botanical composition and animal
performance parameters being more closely related to intake than utilization. This observation is consistent with the results of Weiss, W.P. and Shockey, W.L. (1992.
                                                                                                                                                                                                                                         performance and provide criteria for pasture managers to maximize forage
Orchardgrass can be a good forage for dairy cows. Hoard's Dairyman, 137(5) , p 204) who noted that the performance of lactating dairy cows was similar for cows
                                                                                                                                                                                                                                         utilization.
consuming orchardgrass vs alfalfa because the NDF was more digestible in the grass compared to the legume.

Weitere ähnliche Inhalte

Mehr von nacaa

Getting online information to come to you nacaa 2012
Getting online information to come to you   nacaa 2012Getting online information to come to you   nacaa 2012
Getting online information to come to you nacaa 2012nacaa
 
Petty gis2012
Petty gis2012Petty gis2012
Petty gis2012nacaa
 
A gsploration nacaa 2012 poster
A gsploration nacaa 2012 posterA gsploration nacaa 2012 poster
A gsploration nacaa 2012 posternacaa
 
Yutzy, nacaa2012, Poster
Yutzy, nacaa2012, PosterYutzy, nacaa2012, Poster
Yutzy, nacaa2012, Posternacaa
 
Greenhalgh noxious weed poster for nacaa 2012
Greenhalgh noxious weed poster for nacaa 2012Greenhalgh noxious weed poster for nacaa 2012
Greenhalgh noxious weed poster for nacaa 2012nacaa
 
Infante casella and carleo poster nj
Infante casella and carleo poster njInfante casella and carleo poster nj
Infante casella and carleo poster njnacaa
 
Nacaa annie's diverse audience poster
Nacaa annie's diverse audience posterNacaa annie's diverse audience poster
Nacaa annie's diverse audience posternacaa
 
Baker beef camp poster2
Baker beef camp poster2Baker beef camp poster2
Baker beef camp poster2nacaa
 
Byers2012 nacaa poster
Byers2012 nacaa posterByers2012 nacaa poster
Byers2012 nacaa posternacaa
 
Poster gary gao_grapewineanalysisworkshop_nacaa_2012
Poster gary gao_grapewineanalysisworkshop_nacaa_2012Poster gary gao_grapewineanalysisworkshop_nacaa_2012
Poster gary gao_grapewineanalysisworkshop_nacaa_2012nacaa
 
Gps 101 c_dillard
Gps 101 c_dillardGps 101 c_dillard
Gps 101 c_dillardnacaa
 
Md small flock research survey 2012 poster (1) draft (2)
Md small flock research survey 2012 poster (1) draft (2)Md small flock research survey 2012 poster (1) draft (2)
Md small flock research survey 2012 poster (1) draft (2)nacaa
 
Mg vphonetraining edcrrn
Mg vphonetraining edcrrnMg vphonetraining edcrrn
Mg vphonetraining edcrrnnacaa
 
Lentz es nonohwheat12
Lentz es nonohwheat12Lentz es nonohwheat12
Lentz es nonohwheat12nacaa
 
Haller hay feeding poster
Haller   hay feeding posterHaller   hay feeding poster
Haller hay feeding posternacaa
 
Shannon prec ag software nacaa poster
Shannon prec ag software nacaa posterShannon prec ag software nacaa poster
Shannon prec ag software nacaa posternacaa
 
Haller hay feeding poster
Haller   hay feeding posterHaller   hay feeding poster
Haller hay feeding posternacaa
 
2012 cotton beltwide curry poster2
2012 cotton beltwide curry poster22012 cotton beltwide curry poster2
2012 cotton beltwide curry poster2nacaa
 
Arnold reduce phos
Arnold reduce phosArnold reduce phos
Arnold reduce phosnacaa
 
Lantz poster2012
Lantz poster2012Lantz poster2012
Lantz poster2012nacaa
 

Mehr von nacaa (20)

Getting online information to come to you nacaa 2012
Getting online information to come to you   nacaa 2012Getting online information to come to you   nacaa 2012
Getting online information to come to you nacaa 2012
 
Petty gis2012
Petty gis2012Petty gis2012
Petty gis2012
 
A gsploration nacaa 2012 poster
A gsploration nacaa 2012 posterA gsploration nacaa 2012 poster
A gsploration nacaa 2012 poster
 
Yutzy, nacaa2012, Poster
Yutzy, nacaa2012, PosterYutzy, nacaa2012, Poster
Yutzy, nacaa2012, Poster
 
Greenhalgh noxious weed poster for nacaa 2012
Greenhalgh noxious weed poster for nacaa 2012Greenhalgh noxious weed poster for nacaa 2012
Greenhalgh noxious weed poster for nacaa 2012
 
Infante casella and carleo poster nj
Infante casella and carleo poster njInfante casella and carleo poster nj
Infante casella and carleo poster nj
 
Nacaa annie's diverse audience poster
Nacaa annie's diverse audience posterNacaa annie's diverse audience poster
Nacaa annie's diverse audience poster
 
Baker beef camp poster2
Baker beef camp poster2Baker beef camp poster2
Baker beef camp poster2
 
Byers2012 nacaa poster
Byers2012 nacaa posterByers2012 nacaa poster
Byers2012 nacaa poster
 
Poster gary gao_grapewineanalysisworkshop_nacaa_2012
Poster gary gao_grapewineanalysisworkshop_nacaa_2012Poster gary gao_grapewineanalysisworkshop_nacaa_2012
Poster gary gao_grapewineanalysisworkshop_nacaa_2012
 
Gps 101 c_dillard
Gps 101 c_dillardGps 101 c_dillard
Gps 101 c_dillard
 
Md small flock research survey 2012 poster (1) draft (2)
Md small flock research survey 2012 poster (1) draft (2)Md small flock research survey 2012 poster (1) draft (2)
Md small flock research survey 2012 poster (1) draft (2)
 
Mg vphonetraining edcrrn
Mg vphonetraining edcrrnMg vphonetraining edcrrn
Mg vphonetraining edcrrn
 
Lentz es nonohwheat12
Lentz es nonohwheat12Lentz es nonohwheat12
Lentz es nonohwheat12
 
Haller hay feeding poster
Haller   hay feeding posterHaller   hay feeding poster
Haller hay feeding poster
 
Shannon prec ag software nacaa poster
Shannon prec ag software nacaa posterShannon prec ag software nacaa poster
Shannon prec ag software nacaa poster
 
Haller hay feeding poster
Haller   hay feeding posterHaller   hay feeding poster
Haller hay feeding poster
 
2012 cotton beltwide curry poster2
2012 cotton beltwide curry poster22012 cotton beltwide curry poster2
2012 cotton beltwide curry poster2
 
Arnold reduce phos
Arnold reduce phosArnold reduce phos
Arnold reduce phos
 
Lantz poster2012
Lantz poster2012Lantz poster2012
Lantz poster2012
 

Kürzlich hochgeladen

Integumentary System SMP B. Pharm Sem I.ppt
Integumentary System SMP B. Pharm Sem I.pptIntegumentary System SMP B. Pharm Sem I.ppt
Integumentary System SMP B. Pharm Sem I.pptshraddhaparab530
 
ANG SEKTOR NG agrikultura.pptx QUARTER 4
ANG SEKTOR NG agrikultura.pptx QUARTER 4ANG SEKTOR NG agrikultura.pptx QUARTER 4
ANG SEKTOR NG agrikultura.pptx QUARTER 4MiaBumagat1
 
ClimART Action | eTwinning Project
ClimART Action    |    eTwinning ProjectClimART Action    |    eTwinning Project
ClimART Action | eTwinning Projectjordimapav
 
HỌC TỐT TIẾNG ANH 11 THEO CHƯƠNG TRÌNH GLOBAL SUCCESS ĐÁP ÁN CHI TIẾT - CẢ NĂ...
HỌC TỐT TIẾNG ANH 11 THEO CHƯƠNG TRÌNH GLOBAL SUCCESS ĐÁP ÁN CHI TIẾT - CẢ NĂ...HỌC TỐT TIẾNG ANH 11 THEO CHƯƠNG TRÌNH GLOBAL SUCCESS ĐÁP ÁN CHI TIẾT - CẢ NĂ...
HỌC TỐT TIẾNG ANH 11 THEO CHƯƠNG TRÌNH GLOBAL SUCCESS ĐÁP ÁN CHI TIẾT - CẢ NĂ...Nguyen Thanh Tu Collection
 
Expanded definition: technical and operational
Expanded definition: technical and operationalExpanded definition: technical and operational
Expanded definition: technical and operationalssuser3e220a
 
Daily Lesson Plan in Mathematics Quarter 4
Daily Lesson Plan in Mathematics Quarter 4Daily Lesson Plan in Mathematics Quarter 4
Daily Lesson Plan in Mathematics Quarter 4JOYLYNSAMANIEGO
 
Presentation Activity 2. Unit 3 transv.pptx
Presentation Activity 2. Unit 3 transv.pptxPresentation Activity 2. Unit 3 transv.pptx
Presentation Activity 2. Unit 3 transv.pptxRosabel UA
 
Q4-PPT-Music9_Lesson-1-Romantic-Opera.pptx
Q4-PPT-Music9_Lesson-1-Romantic-Opera.pptxQ4-PPT-Music9_Lesson-1-Romantic-Opera.pptx
Q4-PPT-Music9_Lesson-1-Romantic-Opera.pptxlancelewisportillo
 
Field Attribute Index Feature in Odoo 17
Field Attribute Index Feature in Odoo 17Field Attribute Index Feature in Odoo 17
Field Attribute Index Feature in Odoo 17Celine George
 
EMBODO Lesson Plan Grade 9 Law of Sines.docx
EMBODO Lesson Plan Grade 9 Law of Sines.docxEMBODO Lesson Plan Grade 9 Law of Sines.docx
EMBODO Lesson Plan Grade 9 Law of Sines.docxElton John Embodo
 
Active Learning Strategies (in short ALS).pdf
Active Learning Strategies (in short ALS).pdfActive Learning Strategies (in short ALS).pdf
Active Learning Strategies (in short ALS).pdfPatidar M
 
TEACHER REFLECTION FORM (NEW SET........).docx
TEACHER REFLECTION FORM (NEW SET........).docxTEACHER REFLECTION FORM (NEW SET........).docx
TEACHER REFLECTION FORM (NEW SET........).docxruthvilladarez
 
GRADE 4 - SUMMATIVE TEST QUARTER 4 ALL SUBJECTS
GRADE 4 - SUMMATIVE TEST QUARTER 4 ALL SUBJECTSGRADE 4 - SUMMATIVE TEST QUARTER 4 ALL SUBJECTS
GRADE 4 - SUMMATIVE TEST QUARTER 4 ALL SUBJECTSJoshuaGantuangco2
 
The Contemporary World: The Globalization of World Politics
The Contemporary World: The Globalization of World PoliticsThe Contemporary World: The Globalization of World Politics
The Contemporary World: The Globalization of World PoliticsRommel Regala
 
Inclusivity Essentials_ Creating Accessible Websites for Nonprofits .pdf
Inclusivity Essentials_ Creating Accessible Websites for Nonprofits .pdfInclusivity Essentials_ Creating Accessible Websites for Nonprofits .pdf
Inclusivity Essentials_ Creating Accessible Websites for Nonprofits .pdfTechSoup
 
4.18.24 Movement Legacies, Reflection, and Review.pptx
4.18.24 Movement Legacies, Reflection, and Review.pptx4.18.24 Movement Legacies, Reflection, and Review.pptx
4.18.24 Movement Legacies, Reflection, and Review.pptxmary850239
 

Kürzlich hochgeladen (20)

Integumentary System SMP B. Pharm Sem I.ppt
Integumentary System SMP B. Pharm Sem I.pptIntegumentary System SMP B. Pharm Sem I.ppt
Integumentary System SMP B. Pharm Sem I.ppt
 
ANG SEKTOR NG agrikultura.pptx QUARTER 4
ANG SEKTOR NG agrikultura.pptx QUARTER 4ANG SEKTOR NG agrikultura.pptx QUARTER 4
ANG SEKTOR NG agrikultura.pptx QUARTER 4
 
ClimART Action | eTwinning Project
ClimART Action    |    eTwinning ProjectClimART Action    |    eTwinning Project
ClimART Action | eTwinning Project
 
LEFT_ON_C'N_ PRELIMS_EL_DORADO_2024.pptx
LEFT_ON_C'N_ PRELIMS_EL_DORADO_2024.pptxLEFT_ON_C'N_ PRELIMS_EL_DORADO_2024.pptx
LEFT_ON_C'N_ PRELIMS_EL_DORADO_2024.pptx
 
HỌC TỐT TIẾNG ANH 11 THEO CHƯƠNG TRÌNH GLOBAL SUCCESS ĐÁP ÁN CHI TIẾT - CẢ NĂ...
HỌC TỐT TIẾNG ANH 11 THEO CHƯƠNG TRÌNH GLOBAL SUCCESS ĐÁP ÁN CHI TIẾT - CẢ NĂ...HỌC TỐT TIẾNG ANH 11 THEO CHƯƠNG TRÌNH GLOBAL SUCCESS ĐÁP ÁN CHI TIẾT - CẢ NĂ...
HỌC TỐT TIẾNG ANH 11 THEO CHƯƠNG TRÌNH GLOBAL SUCCESS ĐÁP ÁN CHI TIẾT - CẢ NĂ...
 
FINALS_OF_LEFT_ON_C'N_EL_DORADO_2024.pptx
FINALS_OF_LEFT_ON_C'N_EL_DORADO_2024.pptxFINALS_OF_LEFT_ON_C'N_EL_DORADO_2024.pptx
FINALS_OF_LEFT_ON_C'N_EL_DORADO_2024.pptx
 
Expanded definition: technical and operational
Expanded definition: technical and operationalExpanded definition: technical and operational
Expanded definition: technical and operational
 
Daily Lesson Plan in Mathematics Quarter 4
Daily Lesson Plan in Mathematics Quarter 4Daily Lesson Plan in Mathematics Quarter 4
Daily Lesson Plan in Mathematics Quarter 4
 
Presentation Activity 2. Unit 3 transv.pptx
Presentation Activity 2. Unit 3 transv.pptxPresentation Activity 2. Unit 3 transv.pptx
Presentation Activity 2. Unit 3 transv.pptx
 
Q4-PPT-Music9_Lesson-1-Romantic-Opera.pptx
Q4-PPT-Music9_Lesson-1-Romantic-Opera.pptxQ4-PPT-Music9_Lesson-1-Romantic-Opera.pptx
Q4-PPT-Music9_Lesson-1-Romantic-Opera.pptx
 
Field Attribute Index Feature in Odoo 17
Field Attribute Index Feature in Odoo 17Field Attribute Index Feature in Odoo 17
Field Attribute Index Feature in Odoo 17
 
YOUVE_GOT_EMAIL_PRELIMS_EL_DORADO_2024.pptx
YOUVE_GOT_EMAIL_PRELIMS_EL_DORADO_2024.pptxYOUVE_GOT_EMAIL_PRELIMS_EL_DORADO_2024.pptx
YOUVE_GOT_EMAIL_PRELIMS_EL_DORADO_2024.pptx
 
EMBODO Lesson Plan Grade 9 Law of Sines.docx
EMBODO Lesson Plan Grade 9 Law of Sines.docxEMBODO Lesson Plan Grade 9 Law of Sines.docx
EMBODO Lesson Plan Grade 9 Law of Sines.docx
 
Active Learning Strategies (in short ALS).pdf
Active Learning Strategies (in short ALS).pdfActive Learning Strategies (in short ALS).pdf
Active Learning Strategies (in short ALS).pdf
 
TEACHER REFLECTION FORM (NEW SET........).docx
TEACHER REFLECTION FORM (NEW SET........).docxTEACHER REFLECTION FORM (NEW SET........).docx
TEACHER REFLECTION FORM (NEW SET........).docx
 
GRADE 4 - SUMMATIVE TEST QUARTER 4 ALL SUBJECTS
GRADE 4 - SUMMATIVE TEST QUARTER 4 ALL SUBJECTSGRADE 4 - SUMMATIVE TEST QUARTER 4 ALL SUBJECTS
GRADE 4 - SUMMATIVE TEST QUARTER 4 ALL SUBJECTS
 
The Contemporary World: The Globalization of World Politics
The Contemporary World: The Globalization of World PoliticsThe Contemporary World: The Globalization of World Politics
The Contemporary World: The Globalization of World Politics
 
Inclusivity Essentials_ Creating Accessible Websites for Nonprofits .pdf
Inclusivity Essentials_ Creating Accessible Websites for Nonprofits .pdfInclusivity Essentials_ Creating Accessible Websites for Nonprofits .pdf
Inclusivity Essentials_ Creating Accessible Websites for Nonprofits .pdf
 
YOUVE GOT EMAIL_FINALS_EL_DORADO_2024.pptx
YOUVE GOT EMAIL_FINALS_EL_DORADO_2024.pptxYOUVE GOT EMAIL_FINALS_EL_DORADO_2024.pptx
YOUVE GOT EMAIL_FINALS_EL_DORADO_2024.pptx
 
4.18.24 Movement Legacies, Reflection, and Review.pptx
4.18.24 Movement Legacies, Reflection, and Review.pptx4.18.24 Movement Legacies, Reflection, and Review.pptx
4.18.24 Movement Legacies, Reflection, and Review.pptx
 

Correlating Nutritional Values of Forages

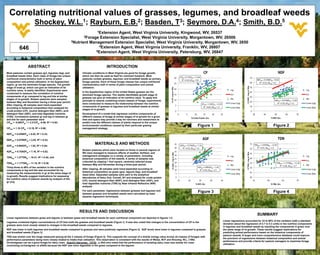
  • 1. Correlating nutritional values of grasses, legumes, and broadleaf weeds Shockey, W.L. 1; Rayburn, E.B.2; Basden, T 3; Seymore, D.A.4; Smith, B.D.5 1Extension Agent, West Virginia University, Kingwood, WV, 26537 2Forage Extension Specialist, West Virginia University, Morgantown, WV, 26506 3Nutrient Management Extension Specialist, West Virginia University, Morgantown, WV, 2650 4Extension Agent, West Virginia University, Franklin, WV, 26807 646 5Extension Agent, West Virginia University, Petersburg, WV, 26847 ABSTRACT INTRODUCTION Most pastures contain grasses (gr), legumes (leg), and Climatic conditions in West Virginia are good for forage growth, CP NDF broadleaf weeds (blw). Each class of forage has unique which can then be used as feed for ruminant livestock. Most 30 CPleg = 0.73CPgra + 11.40 70 nutritional characteristics both in terms of plant pastures contain grasses, legumes, and broadleaf weeds as primary NDFleg = 0.53NDFgra + 8.02 R2 = 0.44, SDreg = 2.8 composition and animal utilization. In the Appalachian forage species. Each of these forage classes has unique nutritional 60 R2 = 0.33, SDreg = 4.2 25 region, gr are the dominant forage species. The growth characteristics both in terms of plant composition and animal % NDF, Leg or Blw stage of most gr, which can give an indication of its utilization. 50 % CP, Leg or Blw 20 Leg Leg nutritive value, is easily identified. Experiments were In the Appalachian region of the United States grasses are the 40 conducted to measure the correlation of nutritive 15 Gra Gra dominant forage species. The readily identifiable growth stage of components of gr compared to leg and blw at similar 30 grasses can give an indication of its nutritive value. To apply this Blw Blw stages of re-growth. Sixteen pastures were sampled 10 NDFblw = 0.67NDFgra + 2.83 principle to swards containing mixed classes of forage, experiments 20 between May and November during a three-year period. Linear (Leg) R2 = 0.33, SDreg = 5.3 Linear (Leg) were conducted to measure the relationship between the nutritive CPblw = 1.10CPgra + 0.19 After clipping, 40 samples were hand-separated 5 components of grasses to legumes and broadleaf weeds at similar R2 = 0.66, SDreg = 2.7 10 according to botanical composition then analyzed for Linear (Blw) Linear (Blw) stages of re-growth. crude protein (CP), neutral detergent fiber (NDF), acid 0 0 detergent fiber (ADF), and total digestible nutrients Development of a model that regresses nutritive components of 0 5 10 15 20 25 30 40 50 60 70 (TDN). Correlations between gr and leg or between gr different classes of forage at similar stages of re-growth for a given % Crude Protein, Gra % NDF, Gra and blw for each parameter were time and space may provide a way for ranchers and researchers to CPleg = -0.09CPgr 2 + 3.31CPgr -6.88, R2 = 0.52; predict how the different classes of plants respond to the unique environmental conditions caused by their particular grazing Figure 1 Figure 2 CPblw = 1.10 CPgr + 0.19, R2 = 0.66; management strategy. NDFleg = 0.53NDFgr + 8.02, R2 = 0.33; NDFblw = 0.67NDFgr + 2.83, R2 = 0.33; ADF TDN ADFleg = 0.89ADFgr – 1.62, R2 = 0.54; MATERIALS AND METHODS 45 ADFblw = 0.75ADFgra + 7.16 75 TDN = 1.20TDN – 12.50 leg gra 40 R2 = 0.52, SDreg = 3.3 70 R2 = 0.45, SDreg = 3.2 Sixteen pastures which were located on farms in several regions of ADFblw = 0.75ADFgr + 7.16, R2 = 0.52; 35 % TDN, Leg or Blw WV were managed to measure effects of weather, fertilizer, and % ADF, Leg or Blw 65 management strategies on a variety of parameters, including 30 Leg Leg TDNleg = 1.27TDNgr – 16.31, R2 = 0.45; and 60 botanical composition of the swards. A series of samples was 25 Gra Gra collected by clipping 1 foot square, randomly selected areas 20 TDNblw = 1.17TDNgr – 11.16, R2 = 0.36. 55 TDNblw = 1.17TDNgra – 11.20 between May and November during a three-year period. Blw Blw 15 R2 = 0.36, SDreg = 3.7 Thirty-three to 66% of the variation in the nutritive ADFleg = 0.89ADFgra – 1.62 50 After clipping, 40 samples were hand-separated according to 10 R2 = 0.54, SDreg = 3.7 Linear (Leg) Linear (Leg) components in leg and blw was accounted for by botanical composition as grass (gra), legume (leg), and broadleaf 45 measuring the measurements in gr at the same stage of 5 Linear (Blw) Linear (Blw) weed (blw). Separated samples were sent to the analytical re-growth. Results suggest implications for assessing 0 40 laboratories of Dairy One, Cornell, NY and analyzed for crude protein the nutritive value of pasture swards by analysis of the (CP), neutral detergent fiber (NDF), acid detergent fiber (ADF), and 10 20 30 40 50 55 60 65 70 gr only. total digestible nutrients (TDN) by Near Infrared Reflective (NIR) % ADF, Gra % TDN, Gra analysis. For each parameter, regressions between grasses and legumes and between grasses and broadleaf weeds were calculated by least Figure 3 Figure 4 squares regression techniques. RESULTS AND DISCUSSION SUMMARY Linear regressions between grass and legume or between grass and broadleaf weeds for each nutritional component are depicted in figures 1-4. Linear regressions accounted for 33 to 66% of the variation (with a standard Legumes contained higher concentrations of CP than both the grasses and broadleaf weeds (Figure 1). It was also noted that changes in the concentration of CP in the deviation about the regression of 2.7 to 5.3 units) in the nutritive components grasses were more closely related to changes in the broadleaf weeds compared to legumes. in legumes and broadleaf weeds by inputting the components in grass over NDF was lower in both legumes and broadleaf weeds compared to grasses and were positively regressed (Figure 2). ADF levels were lower in legumes compared to grasses the same range of re-growth. These results suggest implications for and broadleaf weeds (Figure 3). predicting animal performance based on the botanical components of pasture swards. A larger and more comprehensive database could improve TDN was similar over the range measured among all the 3 classes of forage (Figure 4). This supports the concept of a similar energy value across all classes of forages with the precision of regressions between botanical composition and animal performance parameters being more closely related to intake than utilization. This observation is consistent with the results of Weiss, W.P. and Shockey, W.L. (1992. performance and provide criteria for pasture managers to maximize forage Orchardgrass can be a good forage for dairy cows. Hoard's Dairyman, 137(5) , p 204) who noted that the performance of lactating dairy cows was similar for cows utilization. consuming orchardgrass vs alfalfa because the NDF was more digestible in the grass compared to the legume.