
Empfohlen
Weitere ähnliche Inhalte
Ähnlich wie 1 data analysis -line plots masy 19
Ähnlich wie 1 data analysis -line plots masy 19 (6)
Mehr von mskarras
Mehr von mskarras (20)
Kürzlich hochgeladen
Kürzlich hochgeladen (20)
1 data analysis -line plots masy 19
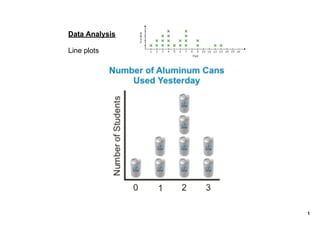
- 2. Steps to constructing a Line Plot 1) With a ruler, draw a horizontal line. 2) Choose a scale * choose numbers slightly smaller and slightly larger than the smallest and largest numbers in your list. 3) Plot an X above the line for each item in your list 2
- 3. 1) With a ruler, draw a horizontal line. 2) Choose a scale * choose numbers slightly smaller and slightly larger than the smallest and largest numbers in your list. 3) Plot an X above the line for each item in your list 3
- 5. 5
- 6. 6