
Empfohlen
Weitere ähnliche Inhalte
Ähnlich wie Test 1
Ähnlich wie Test 1 (20)
Mehr von monster2010
Mehr von monster2010 (20)
Kürzlich hochgeladen
Kürzlich hochgeladen (20)
Test 1
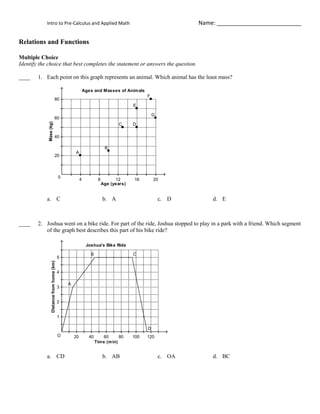
- 1. Relations and Functions<br />Multiple Choice<br />Identify the choice that best completes the statement or answers the question.<br />____1.Each point on this graph represents an animal. Which animal has the least mass?<br />a.C b.Ac.Dd.E<br />____2.Joshua went on a bike ride. For part of the ride, Joshua stopped to play in a park with a friend. Which segment of the graph best describes this part of his bike ride?<br />a.CDb.ABc.OAd.BC<br />____3.A person in a car drives away from a stop sign, cruises at a constant speed, and then slows down as she approaches another stop sign. Which graph best represents this situation?<br />a.c.b.d.<br />____4.Identify the range of this relation.<br />a.c.b.d.<br />____5.This graph shows the height of the tide in a harbour as a function of time in one day. What is the greatest height of the tide?<br />a.9 mb.2 mc.8 md.4 m<br />____6.Each point on this graph represents a person. Which two people are the same age?<br />a.E and Fc.D and Eb.C and Dd.B and C<br />____7.Which graph best represents the cost of renting a kayak as a function of time?<br />a.c.b.d.<br />____8.Which set of ordered pairs does not represent a function?<br />a) <br />b) <br />c) <br />d) <br />____9.Which of these graphs represents a function?<br />a) b)<br /> <br />c) d)<br /> <br />____10.Which of these graphs represents a function?<br />a) b)<br /> <br />c) d)<br /> <br />____11.This set of ordered pairs represents a linear relation. Determine its rate of change.<br /> <br />a.c.b.d.<br />____12.The monthly income, I dollars, of a furniture salesperson is given by the equation , where s represents the salesperson’s total monthly sales in dollars. Determine the rate of change of this linear relation.<br /> <br />a.0.03c.1500b.d.3<br />____13.Which graph represents the linear function ?<br />a.c.b.d.<br />Written Answers: Show all necessary work.<br />14.a) Write in function notation: <br />b) Write as an equation in two variables: <br />15.This graph shows the volume of gas in a car as a function of time. Describe what is happening for line segment EF in the graph.<br />16.Suppose a student drew a graph of each function described below. For which graphs should the student connect the points? Justify your answer.<br />a) The mass of a stack of coins is a function of the number of coins.<br />b) The temperature in Vancouver is a function of the time of day.<br />c) The mass of an animal is a function of its age.<br />d) The price of a carton of milk is a function of the size of the carton.<br />17.This is a graph of the function .<br /> <br /> <br />a) Determine the range value when the domain value is –2. <br />b) Determine the domain value when the range value is –1.<br />18.Determine the domain and range of the graph of this function. Write in set and interval notation.<br /> <br />19.Which equations represent linear relations? Create tables of values if necessary.<br />a) b) <br />c) d) <br />20.This table represents the approximate relation between a distance in miles and the same distance in kilometres. Determine the rate of change of the relation.<br />Miles (mi.)918273645Kilometres (km)14.428.843.257.672.0<br />21.Determine the vertical and horizontal intercepts of this graph. What do they each represent?<br /> <br />22.This graph shows the cost, C dollars, of printing an advertising flyer for the school play as a function of the number of flyers printed, n. What is the cost when 1000 flyers are printed?<br /> <br />23.This graph shows cost, C dollars, as a function of time, t hours. What is the time when the cost is $35?<br /> <br />24.The equation represents the total cost, C dollars, for a sports banquet when g people attend.<br />a) Write the function in function notation.<br />b) Determine C(46).<br />c) Determine the value of g when C(g) = 1581. <br />25.This graph represents a day trip from Vancouver to Hope, B.C. The distance between Vancouver and Hope is approximately 150 km. <br />Describe the journey for each segment of the graph. <br />26.A company rents paddle boats by the day. This table shows the total cost of renting a paddle boat for different numbers of days.<br />Number of Days (n)Total Cost ($)1$54.003$112.005$170.007$228.00<br /> <br />a) Graph the relation between the total cost of the rental and the number of days.<br />b) Does the graph represent a linear relation? How do you know?<br />c) Determine the rate of change, then describe what it represents.<br />27.This graph shows the length, l metres, of an object’s shadow as a function of the height of the object, h metres.<br />a) What is the rate of change? What does it represent?<br />b) A tree has height 13 m. About how long is its shadow?<br />c) The length of the shadow of a building is 45 m. About how tall is the building?<br />28.Sketch a graph of the linear function .<br />