SlideShare ist ein Scribd-Unternehmen logo
1 von 53
Downloaden Sie, um offline zu lesen
Figure 1.1 Marketing Metrics: Marketing at the Core of the Organization
From Marketing Metrics: The Manager's Guide to Measuring Marketing Performance, 3/e by Paul Farris, Neil Bendle, Phillip E. Pfeifer and David J.
Reibstein (0134085965) Copyright © 2016 Pearson Education, Inc. All rights reserved.
From Marketing Metrics: The Manager's Guide to Measuring Marketing Performance, 3/e by Paul Farris, Neil Bendle, Phillip E. Pfeifer and David J.
Reibstein (0134085965) Copyright © 2016 Pearson Education, Inc. All rights reserved.
Figure 2.1 The BCG Matrix
Figure 2.2 Awareness, Attitudes, and Usage: Hierarchy of Effects
From Marketing Metrics: The Manager's Guide to Measuring Marketing Performance, 3/e by Paul Farris, Neil Bendle, Phillip E. Pfeifer and David J.
Reibstein (0134085965) Copyright © 2016 Pearson Education, Inc. All rights reserved.
Figure 2.3 Ratings
From Marketing Metrics: The Manager's Guide to Measuring Marketing Performance, 3/e by Paul Farris, Neil Bendle, Phillip E. Pfeifer and David J.
Reibstein (0134085965) Copyright © 2016 Pearson Education, Inc. All rights reserved.
Figure 2.4 A Typical Five-Point Scale
From Marketing Metrics: The Manager's Guide to Measuring Marketing Performance, 3/e by Paul Farris, Neil Bendle, Phillip E. Pfeifer and David J.
Reibstein (0134085965) Copyright © 2016 Pearson Education, Inc. All rights reserved.
Figure 2.5 Hotel Customer Survey Response
From Marketing Metrics: The Manager's Guide to Measuring Marketing Performance, 3/e by Paul Farris, Neil Bendle, Phillip E. Pfeifer and David J.
Reibstein (0134085965) Copyright © 2016 Pearson Education, Inc. All rights reserved.
Figure 3.1 Example of a Distribution Channel
From Marketing Metrics: The Manager's Guide to Measuring Marketing Performance, 3/e by Paul Farris, Neil Bendle, Phillip E. Pfeifer and David J.
Reibstein (0134085965) Copyright © 2016 Pearson Education, Inc. All rights reserved.
Figure 3.2 Customer Relationships
From Marketing Metrics: The Manager's Guide to Measuring Marketing Performance, 3/e by Paul Farris, Neil Bendle, Phillip E. Pfeifer and David J.
Reibstein (0134085965) Copyright © 2016 Pearson Education, Inc. All rights reserved.
Figure 3.3 Fixed and Variable Costs
From Marketing Metrics: The Manager's Guide to Measuring Marketing Performance, 3/e by Paul Farris, Neil Bendle, Phillip E. Pfeifer and David J.
Reibstein (0134085965) Copyright © 2016 Pearson Education, Inc. All rights reserved.
Figure 3.4 Total Cost Consists of Fixed and Variable Costs
From Marketing Metrics: The Manager's Guide to Measuring Marketing Performance, 3/e by Paul Farris, Neil Bendle, Phillip E. Pfeifer and David J.
Reibstein (0134085965) Copyright © 2016 Pearson Education, Inc. All rights reserved.
Figure 3.5 Total Cost per Unit Falls with Volume (Typical Assumptions)
From Marketing Metrics: The Manager's Guide to Measuring Marketing Performance, 3/e by Paul Farris, Neil Bendle, Phillip E. Pfeifer and David J.
Reibstein (0134085965) Copyright © 2016 Pearson Education, Inc. All rights reserved.
Figure 3.6 At Break-Even, Total Costs = Total Revenues
From Marketing Metrics: The Manager's Guide to Measuring Marketing Performance, 3/e by Paul Farris, Neil Bendle, Phillip E. Pfeifer and David J.
Reibstein (0134085965) Copyright © 2016 Pearson Education, Inc. All rights reserved.
Figure 4.1 Schematic of Simulated Test Market Volume Projection
From Marketing Metrics: The Manager's Guide to Measuring Marketing Performance, 3/e by Paul Farris, Neil Bendle, Phillip E. Pfeifer and David J.
Reibstein (0134085965) Copyright © 2016 Pearson Education, Inc. All rights reserved.
Figure 4.2 Time Horizon Influences Perceived Results
From Marketing Metrics: The Manager's Guide to Measuring Marketing Performance, 3/e by Paul Farris, Neil Bendle, Phillip E. Pfeifer and David J.
Reibstein (0134085965) Copyright © 2016 Pearson Education, Inc. All rights reserved.
Figure 4.3 Brand Equity—Outward Shift of Demand Curve
From Marketing Metrics: The Manager's Guide to Measuring Marketing Performance, 3/e by Paul Farris, Neil Bendle, Phillip E. Pfeifer and David J.
Reibstein (0134085965) Copyright © 2016 Pearson Education, Inc. All rights reserved.
Figure 4.4 Young & Rubicam Brand Asset Valuator Patterns of Brand Equity
From Marketing Metrics: The Manager's Guide to Measuring Marketing Performance, 3/e by Paul Farris, Neil Bendle, Phillip E. Pfeifer and David J.
Reibstein (0134085965) Copyright © 2016 Pearson Education, Inc. All rights reserved.
Figure 5.1 Customer Profitability by Decile
From Marketing Metrics: The Manager's Guide to Measuring Marketing Performance, 3/e by Paul Farris, Neil Bendle, Phillip E. Pfeifer and David J.
Reibstein (0134085965) Copyright © 2016 Pearson Education, Inc. All rights reserved.
Figure 5.2 The Whale Curve
From Marketing Metrics: The Manager's Guide to Measuring Marketing Performance, 3/e by Paul Farris, Neil Bendle, Phillip E. Pfeifer and David J.
Reibstein (0134085965) Copyright © 2016 Pearson Education, Inc. All rights reserved.
Figure 6.1 Sales Resulting from Calls to Customers
From Marketing Metrics: The Manager's Guide to Measuring Marketing Performance, 3/e by Paul Farris, Neil Bendle, Phillip E. Pfeifer and David J.
Reibstein (0134085965) Copyright © 2016 Pearson Education, Inc. All rights reserved.
Figure 6.2 Sales Force Funnel
From Marketing Metrics: The Manager's Guide to Measuring Marketing Performance, 3/e by Paul Farris, Neil Bendle, Phillip E. Pfeifer and David J.
Reibstein (0134085965) Copyright © 2016 Pearson Education, Inc. All rights reserved.
Figure 7.1 Maximum Willing to Buy and Maximum Reservation Price
From Marketing Metrics: The Manager's Guide to Measuring Marketing Performance, 3/e by Paul Farris, Neil Bendle, Phillip E. Pfeifer and David J.
Reibstein (0134085965) Copyright © 2016 Pearson Education, Inc. All rights reserved.
Figure 7.2 Simple Linear Demand (Price-Quantity) Function
From Marketing Metrics: The Manager's Guide to Measuring Marketing Performance, 3/e by Paul Farris, Neil Bendle, Phillip E. Pfeifer and David J.
Reibstein (0134085965) Copyright © 2016 Pearson Education, Inc. All rights reserved.
Figure 7.3 Example of Linear Demand Function
From Marketing Metrics: The Manager's Guide to Measuring Marketing Performance, 3/e by Paul Farris, Neil Bendle, Phillip E. Pfeifer and David J.
Reibstein (0134085965) Copyright © 2016 Pearson Education, Inc. All rights reserved.
Figure 7.4 Linear Demand Function
From Marketing Metrics: The Manager's Guide to Measuring Marketing Performance, 3/e by Paul Farris, Neil Bendle, Phillip E. Pfeifer and David J.
Reibstein (0134085965) Copyright © 2016 Pearson Education, Inc. All rights reserved.
Figure 7.5 Constant Elasticity
From Marketing Metrics: The Manager's Guide to Measuring Marketing Performance, 3/e by Paul Farris, Neil Bendle, Phillip E. Pfeifer and David J.
Reibstein (0134085965) Copyright © 2016 Pearson Education, Inc. All rights reserved.
Figure 7.6 Optimal Price Midway Between Variable Cost and MRP
From Marketing Metrics: The Manager's Guide to Measuring Marketing Performance, 3/e by Paul Farris, Neil Bendle, Phillip E. Pfeifer and David J.
Reibstein (0134085965) Copyright © 2016 Pearson Education, Inc. All rights reserved.
Figure 7.7 Linear Demand Functions with the Same MRP and Variable Cost
From Marketing Metrics: The Manager's Guide to Measuring Marketing Performance, 3/e by Paul Farris, Neil Bendle, Phillip E. Pfeifer and David J.
Reibstein (0134085965) Copyright © 2016 Pearson Education, Inc. All rights reserved.
Figure 7.8 Two Segments Form Demand
From Marketing Metrics: The Manager's Guide to Measuring Marketing Performance, 3/e by Paul Farris, Neil Bendle, Phillip E. Pfeifer and David J.
Reibstein (0134085965) Copyright © 2016 Pearson Education, Inc. All rights reserved.
Figure 7.9 Residual Price Elasticity
From Marketing Metrics: The Manager's Guide to Measuring Marketing Performance, 3/e by Paul Farris, Neil Bendle, Phillip E. Pfeifer and David J.
Reibstein (0134085965) Copyright © 2016 Pearson Education, Inc. All rights reserved.
Figure 7.10 Prisoner’s Dilemma Pay-off Grid
From Marketing Metrics: The Manager's Guide to Measuring Marketing Performance, 3/e by Paul Farris, Neil Bendle, Phillip E. Pfeifer and David J.
Reibstein (0134085965) Copyright © 2016 Pearson Education, Inc. All rights reserved.
Figure 7.11 Pay-off Grid with Arrows Representing Preferences for Prisoners
From Marketing Metrics: The Manager's Guide to Measuring Marketing Performance, 3/e by Paul Farris, Neil Bendle, Phillip E. Pfeifer and David J.
Reibstein (0134085965) Copyright © 2016 Pearson Education, Inc. All rights reserved.
Figure 7.12 Pay-off Grid with Expected Values (Values Are in the Millions of Dollars)
From Marketing Metrics: The Manager's Guide to Measuring Marketing Performance, 3/e by Paul Farris, Neil Bendle, Phillip E. Pfeifer and David J.
Reibstein (0134085965) Copyright © 2016 Pearson Education, Inc. All rights reserved.
Figure 7.13 Pay-off Grid with Expected Values and Preference Arrows
(Contribution Values Are in the Millions of Dollars)
From Marketing Metrics: The Manager's Guide to Measuring Marketing Performance, 3/e by Paul Farris, Neil Bendle, Phillip E. Pfeifer and David J.
Reibstein (0134085965) Copyright © 2016 Pearson Education, Inc. All rights reserved.
Figure 8.1 Monthly Sales Patterns
From Marketing Metrics: The Manager's Guide to Measuring Marketing Performance, 3/e by Paul Farris, Neil Bendle, Phillip E. Pfeifer and David J.
Reibstein (0134085965) Copyright © 2016 Pearson Education, Inc. All rights reserved.
Figure 8.2 Downward Spiral—Promotional Effectiveness
From Marketing Metrics: The Manager's Guide to Measuring Marketing Performance, 3/e by Paul Farris, Neil Bendle, Phillip E. Pfeifer and David J.
Reibstein (0134085965) Copyright © 2016 Pearson Education, Inc. All rights reserved.
Figure 8.3 Successful Promotion with Long-Term Benefits
From Marketing Metrics: The Manager's Guide to Measuring Marketing Performance, 3/e by Paul Farris, Neil Bendle, Phillip E. Pfeifer and David J.
Reibstein (0134085965) Copyright © 2016 Pearson Education, Inc. All rights reserved.
Figure 9.1 Venn Diagram Illustration of Net Reach
From Marketing Metrics: The Manager's Guide to Measuring Marketing Performance, 3/e by Paul Farris, Neil Bendle, Phillip E. Pfeifer and David J.
Reibstein (0134085965) Copyright © 2016 Pearson Education, Inc. All rights reserved.
Figure 9.2 Illustration of Cumulative Advertising Effectiveness
From Marketing Metrics: The Manager's Guide to Measuring Marketing Performance, 3/e by Paul Farris, Neil Bendle, Phillip E. Pfeifer and David J.
Reibstein (0134085965) Copyright © 2016 Pearson Education, Inc. All rights reserved.
Figure 10.1 Clickthrough Process
From Marketing Metrics: The Manager's Guide to Measuring Marketing Performance, 3/e by Paul Farris, Neil Bendle, Phillip E. Pfeifer and David J.
Reibstein (0134085965) Copyright © 2016 Pearson Education, Inc. All rights reserved.
Figure 10.2 The Order Acquisition Process
From Marketing Metrics: The Manager's Guide to Measuring Marketing Performance, 3/e by Paul Farris, Neil Bendle, Phillip E. Pfeifer and David J.
Reibstein (0134085965) Copyright © 2016 Pearson Education, Inc. All rights reserved.
Figure 10.3 Relationship of Hits to Pageviews to Visits to Visitors
From Marketing Metrics: The Manager's Guide to Measuring Marketing Performance, 3/e by Paul Farris, Neil Bendle, Phillip E. Pfeifer and David J.
Reibstein (0134085965) Copyright © 2016 Pearson Education, Inc. All rights reserved.
Figure 10.4 Example of Online Newspaper Visitor
From Marketing Metrics: The Manager's Guide to Measuring Marketing Performance, 3/e by Paul Farris, Neil Bendle, Phillip E. Pfeifer and David J.
Reibstein (0134085965) Copyright © 2016 Pearson Education, Inc. All rights reserved.
Figure 10.5 A Clickstream Documented
From Marketing Metrics: The Manager's Guide to Measuring Marketing Performance, 3/e by Paul Farris, Neil Bendle, Phillip E. Pfeifer and David J.
Reibstein (0134085965) Copyright © 2016 Pearson Education, Inc. All rights reserved.
Figure 11.1 Profits = Revenues Less Costs
From Marketing Metrics: The Manager's Guide to Measuring Marketing Performance, 3/e by Paul Farris, Neil Bendle, Phillip E. Pfeifer and David J.
Reibstein (0134085965) Copyright © 2016 Pearson Education, Inc. All rights reserved.
Figure 11.2 EVA Is After-Tax Profit Minus a Charge for Capital Usage
From Marketing Metrics: The Manager's Guide to Measuring Marketing Performance, 3/e by Paul Farris, Neil Bendle, Phillip E. Pfeifer and David J.
Reibstein (0134085965) Copyright © 2016 Pearson Education, Inc. All rights reserved.
Figure 11.3 Evaluating the Return to Marketing
From Marketing Metrics: The Manager's Guide to Measuring Marketing Performance, 3/e by Paul Farris, Neil Bendle, Phillip E. Pfeifer and David J.
Reibstein (0134085965) Copyright © 2016 Pearson Education, Inc. All rights reserved.
Figure 12.1 Prestige Luggage: Marketing Management Dashboard
From Marketing Metrics: The Manager's Guide to Measuring Marketing Performance, 3/e by Paul Farris, Neil Bendle, Phillip E. Pfeifer and David J.
Reibstein (0134085965) Copyright © 2016 Pearson Education, Inc. All rights reserved.
Figure 13.1 An Extended DuPont Model (adapted from http://www.12manage.com/
methods_dupont_model.html)
From Marketing Metrics: The Manager's Guide to Measuring Marketing Performance, 3/e by Paul Farris, Neil Bendle, Phillip E. Pfeifer and David J.
Reibstein (0134085965) Copyright © 2016 Pearson Education, Inc. All rights reserved.
Figure 13.2 A Sales Model
From Marketing Metrics: The Manager's Guide to Measuring Marketing Performance, 3/e by Paul Farris, Neil Bendle, Phillip E. Pfeifer and David J.
Reibstein (0134085965) Copyright © 2016 Pearson Education, Inc. All rights reserved.
Figure 13.3 Empirical Relationships between Marketing Decisions and Objectives
From Marketing Metrics: The Manager's Guide to Measuring Marketing Performance, 3/e by Paul Farris, Neil Bendle, Phillip E. Pfeifer and David J.
Reibstein (0134085965) Copyright © 2016 Pearson Education, Inc. All rights reserved.
Figure 13.4 Empirical Relationship with Components of Marketing Outcomes
From Marketing Metrics: The Manager's Guide to Measuring Marketing Performance, 3/e by Paul Farris, Neil Bendle, Phillip E. Pfeifer and David J.
Reibstein (0134085965) Copyright © 2016 Pearson Education, Inc. All rights reserved.
Figure 13.5 Simulated Test Markets Combine Empirical and Identity Relationships
From Marketing Metrics: The Manager's Guide to Measuring Marketing Performance, 3/e by Paul Farris, Neil Bendle, Phillip E. Pfeifer and David J.
Reibstein (0134085965) Copyright © 2016 Pearson Education, Inc. All rights reserved.
Figure 13.6 Empirical Relationship with Marketing Components
and Intermediate Metrics and Constructs
From Marketing Metrics: The Manager's Guide to Measuring Marketing Performance, 3/e by Paul Farris, Neil Bendle, Phillip E. Pfeifer and David J.
Reibstein (0134085965) Copyright © 2016 Pearson Education, Inc. All rights reserved.

Weitere ähnliche Inhalte

Andere mochten auch

HDC 90-day Review
HDC 90-day ReviewHDC 90-day Review
HDC 90-day ReviewDana Hultz
 
Principios de quimica y estructura ena3 - ejercicio 06 predicción de las e...
Principios de quimica y estructura    ena3 - ejercicio 06 predicción de las e...Principios de quimica y estructura    ena3 - ejercicio 06 predicción de las e...
Principios de quimica y estructura ena3 - ejercicio 06 predicción de las e...Triplenlace Química
 

Andere mochten auch (6)

Active Learning on Headline 10Jun 2015
Active Learning on Headline 10Jun 2015Active Learning on Headline 10Jun 2015
Active Learning on Headline 10Jun 2015
 
Jonathan molina
Jonathan molinaJonathan molina
Jonathan molina
 
Web 2.0
Web 2.0Web 2.0
Web 2.0
 
HDC 90-day Review
HDC 90-day ReviewHDC 90-day Review
HDC 90-day Review
 
Pedacito blueprint
Pedacito blueprintPedacito blueprint
Pedacito blueprint
 
Principios de quimica y estructura ena3 - ejercicio 06 predicción de las e...
Principios de quimica y estructura    ena3 - ejercicio 06 predicción de las e...Principios de quimica y estructura    ena3 - ejercicio 06 predicción de las e...
Principios de quimica y estructura ena3 - ejercicio 06 predicción de las e...
 

Ähnlich wie Proyecto final

9780134394367 2.pptx
9780134394367 2.pptx9780134394367 2.pptx
9780134394367 2.pptxMoises Cielak
 
The CMO Survey Report: Highlight and Insights August 2014
The CMO Survey Report: Highlight and Insights August 2014The CMO Survey Report: Highlight and Insights August 2014
The CMO Survey Report: Highlight and Insights August 2014christinemoorman
 
4 p's in marketing
4 p's in marketing4 p's in marketing
4 p's in marketingRavi Rastogi
 
Recommendation Report for client Traditional Medicinals Inc..docx
Recommendation Report for client Traditional Medicinals Inc..docxRecommendation Report for client Traditional Medicinals Inc..docx
Recommendation Report for client Traditional Medicinals Inc..docxaudeleypearl
 
dokumen.tips_chapter-1-marketing-research-malhotra (1).ppt
dokumen.tips_chapter-1-marketing-research-malhotra (1).pptdokumen.tips_chapter-1-marketing-research-malhotra (1).ppt
dokumen.tips_chapter-1-marketing-research-malhotra (1).pptMohammadRahat10
 
fdocuments.in_chapter-1-marketing-research-malhotra.ppt
fdocuments.in_chapter-1-marketing-research-malhotra.pptfdocuments.in_chapter-1-marketing-research-malhotra.ppt
fdocuments.in_chapter-1-marketing-research-malhotra.pptDindayalAgrawal3
 
david-sm13-ppt-08ppt.pptx
david-sm13-ppt-08ppt.pptxdavid-sm13-ppt-08ppt.pptx
david-sm13-ppt-08ppt.pptxmarhadi7
 
Chapter 1 Marketing Research Malhotra
Chapter 1 Marketing Research MalhotraChapter 1 Marketing Research Malhotra
Chapter 1 Marketing Research MalhotraAADITYA TANTIA
 
david_sm13_ppt_08.ppt
david_sm13_ppt_08.pptdavid_sm13_ppt_08.ppt
david_sm13_ppt_08.pptShahidRandhwa
 
7 step e marketing plan
7 step e marketing plan7 step e marketing plan
7 step e marketing plantalhamir0008
 
Marketing Mix Models In a Changing Environment
Marketing Mix Models In a Changing EnvironmentMarketing Mix Models In a Changing Environment
Marketing Mix Models In a Changing EnvironmentAquent
 
IntroductionFacebook wishes to introduce a new type of ser.docx
IntroductionFacebook wishes to introduce a new type of ser.docxIntroductionFacebook wishes to introduce a new type of ser.docx
IntroductionFacebook wishes to introduce a new type of ser.docxnormanibarber20063
 
Best Practices For Enhancing Vendor/Reseller Relationships
Best Practices For Enhancing Vendor/Reseller RelationshipsBest Practices For Enhancing Vendor/Reseller Relationships
Best Practices For Enhancing Vendor/Reseller RelationshipsChannelinsight
 
strauss_emktg6_ppt03_-_l_r.ppt
strauss_emktg6_ppt03_-_l_r.pptstrauss_emktg6_ppt03_-_l_r.ppt
strauss_emktg6_ppt03_-_l_r.pptHudaElMaghraby1
 
Marketing Research
Marketing ResearchMarketing Research
Marketing Researchwilson tom
 

Ähnlich wie Proyecto final (20)

9780134394367 2.pptx
9780134394367 2.pptx9780134394367 2.pptx
9780134394367 2.pptx
 
The CMO Survey Report: Highlight and Insights August 2014
The CMO Survey Report: Highlight and Insights August 2014The CMO Survey Report: Highlight and Insights August 2014
The CMO Survey Report: Highlight and Insights August 2014
 
4 p's in marketing
4 p's in marketing4 p's in marketing
4 p's in marketing
 
Recommendation Report for client Traditional Medicinals Inc..docx
Recommendation Report for client Traditional Medicinals Inc..docxRecommendation Report for client Traditional Medicinals Inc..docx
Recommendation Report for client Traditional Medicinals Inc..docx
 
dokumen.tips_chapter-1-marketing-research-malhotra (1).ppt
dokumen.tips_chapter-1-marketing-research-malhotra (1).pptdokumen.tips_chapter-1-marketing-research-malhotra (1).ppt
dokumen.tips_chapter-1-marketing-research-malhotra (1).ppt
 
fdocuments.in_chapter-1-marketing-research-malhotra.ppt
fdocuments.in_chapter-1-marketing-research-malhotra.pptfdocuments.in_chapter-1-marketing-research-malhotra.ppt
fdocuments.in_chapter-1-marketing-research-malhotra.ppt
 
david-sm13-ppt-08ppt.pptx
david-sm13-ppt-08ppt.pptxdavid-sm13-ppt-08ppt.pptx
david-sm13-ppt-08ppt.pptx
 
Chapter 1 Marketing Research Malhotra
Chapter 1 Marketing Research MalhotraChapter 1 Marketing Research Malhotra
Chapter 1 Marketing Research Malhotra
 
chapter 1.pdf
chapter 1.pdfchapter 1.pdf
chapter 1.pdf
 
david_sm13_ppt_08.ppt
david_sm13_ppt_08.pptdavid_sm13_ppt_08.ppt
david_sm13_ppt_08.ppt
 
david_sm13_ppt_08.ppt
david_sm13_ppt_08.pptdavid_sm13_ppt_08.ppt
david_sm13_ppt_08.ppt
 
7 step e marketing plan
7 step e marketing plan7 step e marketing plan
7 step e marketing plan
 
Marketing Mix Models In a Changing Environment
Marketing Mix Models In a Changing EnvironmentMarketing Mix Models In a Changing Environment
Marketing Mix Models In a Changing Environment
 
David sm13 ppt_08
David sm13 ppt_08David sm13 ppt_08
David sm13 ppt_08
 
IntroductionFacebook wishes to introduce a new type of ser.docx
IntroductionFacebook wishes to introduce a new type of ser.docxIntroductionFacebook wishes to introduce a new type of ser.docx
IntroductionFacebook wishes to introduce a new type of ser.docx
 
Chapter 3
Chapter 3 Chapter 3
Chapter 3
 
Best Practices For Enhancing Vendor/Reseller Relationships
Best Practices For Enhancing Vendor/Reseller RelationshipsBest Practices For Enhancing Vendor/Reseller Relationships
Best Practices For Enhancing Vendor/Reseller Relationships
 
MARKETING RESEARCH PPT.ppt
MARKETING RESEARCH PPT.pptMARKETING RESEARCH PPT.ppt
MARKETING RESEARCH PPT.ppt
 
strauss_emktg6_ppt03_-_l_r.ppt
strauss_emktg6_ppt03_-_l_r.pptstrauss_emktg6_ppt03_-_l_r.ppt
strauss_emktg6_ppt03_-_l_r.ppt
 
Marketing Research
Marketing ResearchMarketing Research
Marketing Research
 

Mehr von Moises Cielak

Mod 2 e commerce may2021
Mod 2 e commerce may2021Mod 2 e commerce may2021
Mod 2 e commerce may2021Moises Cielak
 
Lo que todo sitio web debería tener
Lo que todo sitio web debería tenerLo que todo sitio web debería tener
Lo que todo sitio web debería tenerMoises Cielak
 
Uvm redes sociales sabadito marzo 28 primera parte
Uvm redes sociales sabadito marzo 28  primera parte Uvm redes sociales sabadito marzo 28  primera parte
Uvm redes sociales sabadito marzo 28 primera parte Moises Cielak
 
Uvm modulo i qro seo sem
Uvm modulo i qro seo semUvm modulo i qro seo sem
Uvm modulo i qro seo semMoises Cielak
 
brand execution ITESM
brand execution ITESM brand execution ITESM
brand execution ITESM Moises Cielak
 
Modulo 1 seminario csf dic 2020 sudent
Modulo 1  seminario csf dic 2020 sudentModulo 1  seminario csf dic 2020 sudent
Modulo 1 seminario csf dic 2020 sudentMoises Cielak
 
Estrategias en redes sociales IBERO DOS
Estrategias en redes sociales   IBERO DOSEstrategias en redes sociales   IBERO DOS
Estrategias en redes sociales IBERO DOSMoises Cielak
 
Branding para nerds, primera parte
Branding para nerds, primera parte Branding para nerds, primera parte
Branding para nerds, primera parte Moises Cielak
 
Taller de redes sociales parte 7
Taller de redes sociales parte 7Taller de redes sociales parte 7
Taller de redes sociales parte 7Moises Cielak
 
Material muy especial para el tec digital
Material muy especial para el tec  digital Material muy especial para el tec  digital
Material muy especial para el tec digital Moises Cielak
 
Otro de redes para la ibero
Otro de redes para la iberoOtro de redes para la ibero
Otro de redes para la iberoMoises Cielak
 
Dt for slideshare cielak
Dt for slideshare cielakDt for slideshare cielak
Dt for slideshare cielakMoises Cielak
 
Acarcamiento al Marketing 2.0
Acarcamiento al Marketing 2.0   Acarcamiento al Marketing 2.0
Acarcamiento al Marketing 2.0 Moises Cielak
 
Lo que sabemos de la Generación Z
Lo que sabemos de la Generación Z Lo que sabemos de la Generación Z
Lo que sabemos de la Generación Z Moises Cielak
 

Mehr von Moises Cielak (20)

Mod 2 e commerce may2021
Mod 2 e commerce may2021Mod 2 e commerce may2021
Mod 2 e commerce may2021
 
Lo que todo sitio web debería tener
Lo que todo sitio web debería tenerLo que todo sitio web debería tener
Lo que todo sitio web debería tener
 
Uvm redes sociales sabadito marzo 28 primera parte
Uvm redes sociales sabadito marzo 28  primera parte Uvm redes sociales sabadito marzo 28  primera parte
Uvm redes sociales sabadito marzo 28 primera parte
 
Uvm modulo i qro seo sem
Uvm modulo i qro seo semUvm modulo i qro seo sem
Uvm modulo i qro seo sem
 
Hino motivacion
Hino motivacionHino motivacion
Hino motivacion
 
brand execution ITESM
brand execution ITESM brand execution ITESM
brand execution ITESM
 
Modulo 1 seminario csf dic 2020 sudent
Modulo 1  seminario csf dic 2020 sudentModulo 1  seminario csf dic 2020 sudent
Modulo 1 seminario csf dic 2020 sudent
 
Uvm oct 12
Uvm oct 12Uvm oct 12
Uvm oct 12
 
Estrategias en redes sociales IBERO DOS
Estrategias en redes sociales   IBERO DOSEstrategias en redes sociales   IBERO DOS
Estrategias en redes sociales IBERO DOS
 
Branding para nerds, primera parte
Branding para nerds, primera parte Branding para nerds, primera parte
Branding para nerds, primera parte
 
La tarde en mty
La tarde en mty La tarde en mty
La tarde en mty
 
Taller de redes sociales parte 7
Taller de redes sociales parte 7Taller de redes sociales parte 7
Taller de redes sociales parte 7
 
Laminas
LaminasLaminas
Laminas
 
Material muy especial para el tec digital
Material muy especial para el tec  digital Material muy especial para el tec  digital
Material muy especial para el tec digital
 
Otro de redes para la ibero
Otro de redes para la iberoOtro de redes para la ibero
Otro de redes para la ibero
 
Dt for slideshare cielak
Dt for slideshare cielakDt for slideshare cielak
Dt for slideshare cielak
 
Acarcamiento al Marketing 2.0
Acarcamiento al Marketing 2.0   Acarcamiento al Marketing 2.0
Acarcamiento al Marketing 2.0
 
Lo que sabemos de la Generación Z
Lo que sabemos de la Generación Z Lo que sabemos de la Generación Z
Lo que sabemos de la Generación Z
 
Publcidad hino 5
Publcidad hino 5Publcidad hino 5
Publcidad hino 5
 
Enero 12 cem
Enero 12 cemEnero 12 cem
Enero 12 cem
 

Kürzlich hochgeladen

Darshan Hiranandani [News About Next CEO].pdf
Darshan Hiranandani [News About Next CEO].pdfDarshan Hiranandani [News About Next CEO].pdf
Darshan Hiranandani [News About Next CEO].pdfShashank Mehta
 
TriStar Gold Corporate Presentation - April 2024
TriStar Gold Corporate Presentation - April 2024TriStar Gold Corporate Presentation - April 2024
TriStar Gold Corporate Presentation - April 2024Adnet Communications
 
Flow Your Strategy at Flight Levels Day 2024
Flow Your Strategy at Flight Levels Day 2024Flow Your Strategy at Flight Levels Day 2024
Flow Your Strategy at Flight Levels Day 2024Kirill Klimov
 
8447779800, Low rate Call girls in Shivaji Enclave Delhi NCR
8447779800, Low rate Call girls in Shivaji Enclave Delhi NCR8447779800, Low rate Call girls in Shivaji Enclave Delhi NCR
8447779800, Low rate Call girls in Shivaji Enclave Delhi NCRashishs7044
 
Unlocking the Future: Explore Web 3.0 Workshop to Start Earning Today!
Unlocking the Future: Explore Web 3.0 Workshop to Start Earning Today!Unlocking the Future: Explore Web 3.0 Workshop to Start Earning Today!
Unlocking the Future: Explore Web 3.0 Workshop to Start Earning Today!Doge Mining Website
 
APRIL2024_UKRAINE_xml_0000000000000 .pdf
APRIL2024_UKRAINE_xml_0000000000000 .pdfAPRIL2024_UKRAINE_xml_0000000000000 .pdf
APRIL2024_UKRAINE_xml_0000000000000 .pdfRbc Rbcua
 
Youth Involvement in an Innovative Coconut Value Chain by Mwalimu Menza
Youth Involvement in an Innovative Coconut Value Chain by Mwalimu MenzaYouth Involvement in an Innovative Coconut Value Chain by Mwalimu Menza
Youth Involvement in an Innovative Coconut Value Chain by Mwalimu Menzaictsugar
 
Global Scenario On Sustainable and Resilient Coconut Industry by Dr. Jelfina...
Global Scenario On Sustainable  and Resilient Coconut Industry by Dr. Jelfina...Global Scenario On Sustainable  and Resilient Coconut Industry by Dr. Jelfina...
Global Scenario On Sustainable and Resilient Coconut Industry by Dr. Jelfina...ictsugar
 
Innovation Conference 5th March 2024.pdf
Innovation Conference 5th March 2024.pdfInnovation Conference 5th March 2024.pdf
Innovation Conference 5th March 2024.pdfrichard876048
 
FULL ENJOY Call girls in Paharganj Delhi | 8377087607
FULL ENJOY Call girls in Paharganj Delhi | 8377087607FULL ENJOY Call girls in Paharganj Delhi | 8377087607
FULL ENJOY Call girls in Paharganj Delhi | 8377087607dollysharma2066
 
Memorándum de Entendimiento (MoU) entre Codelco y SQM
Memorándum de Entendimiento (MoU) entre Codelco y SQMMemorándum de Entendimiento (MoU) entre Codelco y SQM
Memorándum de Entendimiento (MoU) entre Codelco y SQMVoces Mineras
 
8447779800, Low rate Call girls in Kotla Mubarakpur Delhi NCR
8447779800, Low rate Call girls in Kotla Mubarakpur Delhi NCR8447779800, Low rate Call girls in Kotla Mubarakpur Delhi NCR
8447779800, Low rate Call girls in Kotla Mubarakpur Delhi NCRashishs7044
 
Marketplace and Quality Assurance Presentation - Vincent Chirchir
Marketplace and Quality Assurance Presentation - Vincent ChirchirMarketplace and Quality Assurance Presentation - Vincent Chirchir
Marketplace and Quality Assurance Presentation - Vincent Chirchirictsugar
 
(Best) ENJOY Call Girls in Faridabad Ex | 8377087607
(Best) ENJOY Call Girls in Faridabad Ex | 8377087607(Best) ENJOY Call Girls in Faridabad Ex | 8377087607
(Best) ENJOY Call Girls in Faridabad Ex | 8377087607dollysharma2066
 
Cyber Security Training in Office Environment
Cyber Security Training in Office EnvironmentCyber Security Training in Office Environment
Cyber Security Training in Office Environmentelijahj01012
 
8447779800, Low rate Call girls in New Ashok Nagar Delhi NCR
8447779800, Low rate Call girls in New Ashok Nagar Delhi NCR8447779800, Low rate Call girls in New Ashok Nagar Delhi NCR
8447779800, Low rate Call girls in New Ashok Nagar Delhi NCRashishs7044
 
International Business Environments and Operations 16th Global Edition test b...
International Business Environments and Operations 16th Global Edition test b...International Business Environments and Operations 16th Global Edition test b...
International Business Environments and Operations 16th Global Edition test b...ssuserf63bd7
 

Kürzlich hochgeladen (20)

Darshan Hiranandani [News About Next CEO].pdf
Darshan Hiranandani [News About Next CEO].pdfDarshan Hiranandani [News About Next CEO].pdf
Darshan Hiranandani [News About Next CEO].pdf
 
Enjoy ➥8448380779▻ Call Girls In Sector 18 Noida Escorts Delhi NCR
Enjoy ➥8448380779▻ Call Girls In Sector 18 Noida Escorts Delhi NCREnjoy ➥8448380779▻ Call Girls In Sector 18 Noida Escorts Delhi NCR
Enjoy ➥8448380779▻ Call Girls In Sector 18 Noida Escorts Delhi NCR
 
TriStar Gold Corporate Presentation - April 2024
TriStar Gold Corporate Presentation - April 2024TriStar Gold Corporate Presentation - April 2024
TriStar Gold Corporate Presentation - April 2024
 
Flow Your Strategy at Flight Levels Day 2024
Flow Your Strategy at Flight Levels Day 2024Flow Your Strategy at Flight Levels Day 2024
Flow Your Strategy at Flight Levels Day 2024
 
8447779800, Low rate Call girls in Shivaji Enclave Delhi NCR
8447779800, Low rate Call girls in Shivaji Enclave Delhi NCR8447779800, Low rate Call girls in Shivaji Enclave Delhi NCR
8447779800, Low rate Call girls in Shivaji Enclave Delhi NCR
 
Unlocking the Future: Explore Web 3.0 Workshop to Start Earning Today!
Unlocking the Future: Explore Web 3.0 Workshop to Start Earning Today!Unlocking the Future: Explore Web 3.0 Workshop to Start Earning Today!
Unlocking the Future: Explore Web 3.0 Workshop to Start Earning Today!
 
APRIL2024_UKRAINE_xml_0000000000000 .pdf
APRIL2024_UKRAINE_xml_0000000000000 .pdfAPRIL2024_UKRAINE_xml_0000000000000 .pdf
APRIL2024_UKRAINE_xml_0000000000000 .pdf
 
Youth Involvement in an Innovative Coconut Value Chain by Mwalimu Menza
Youth Involvement in an Innovative Coconut Value Chain by Mwalimu MenzaYouth Involvement in an Innovative Coconut Value Chain by Mwalimu Menza
Youth Involvement in an Innovative Coconut Value Chain by Mwalimu Menza
 
Global Scenario On Sustainable and Resilient Coconut Industry by Dr. Jelfina...
Global Scenario On Sustainable  and Resilient Coconut Industry by Dr. Jelfina...Global Scenario On Sustainable  and Resilient Coconut Industry by Dr. Jelfina...
Global Scenario On Sustainable and Resilient Coconut Industry by Dr. Jelfina...
 
Innovation Conference 5th March 2024.pdf
Innovation Conference 5th March 2024.pdfInnovation Conference 5th March 2024.pdf
Innovation Conference 5th March 2024.pdf
 
FULL ENJOY Call girls in Paharganj Delhi | 8377087607
FULL ENJOY Call girls in Paharganj Delhi | 8377087607FULL ENJOY Call girls in Paharganj Delhi | 8377087607
FULL ENJOY Call girls in Paharganj Delhi | 8377087607
 
Memorándum de Entendimiento (MoU) entre Codelco y SQM
Memorándum de Entendimiento (MoU) entre Codelco y SQMMemorándum de Entendimiento (MoU) entre Codelco y SQM
Memorándum de Entendimiento (MoU) entre Codelco y SQM
 
8447779800, Low rate Call girls in Kotla Mubarakpur Delhi NCR
8447779800, Low rate Call girls in Kotla Mubarakpur Delhi NCR8447779800, Low rate Call girls in Kotla Mubarakpur Delhi NCR
8447779800, Low rate Call girls in Kotla Mubarakpur Delhi NCR
 
Marketplace and Quality Assurance Presentation - Vincent Chirchir
Marketplace and Quality Assurance Presentation - Vincent ChirchirMarketplace and Quality Assurance Presentation - Vincent Chirchir
Marketplace and Quality Assurance Presentation - Vincent Chirchir
 
Japan IT Week 2024 Brochure by 47Billion (English)
Japan IT Week 2024 Brochure by 47Billion (English)Japan IT Week 2024 Brochure by 47Billion (English)
Japan IT Week 2024 Brochure by 47Billion (English)
 
(Best) ENJOY Call Girls in Faridabad Ex | 8377087607
(Best) ENJOY Call Girls in Faridabad Ex | 8377087607(Best) ENJOY Call Girls in Faridabad Ex | 8377087607
(Best) ENJOY Call Girls in Faridabad Ex | 8377087607
 
Call Us ➥9319373153▻Call Girls In North Goa
Call Us ➥9319373153▻Call Girls In North GoaCall Us ➥9319373153▻Call Girls In North Goa
Call Us ➥9319373153▻Call Girls In North Goa
 
Cyber Security Training in Office Environment
Cyber Security Training in Office EnvironmentCyber Security Training in Office Environment
Cyber Security Training in Office Environment
 
8447779800, Low rate Call girls in New Ashok Nagar Delhi NCR
8447779800, Low rate Call girls in New Ashok Nagar Delhi NCR8447779800, Low rate Call girls in New Ashok Nagar Delhi NCR
8447779800, Low rate Call girls in New Ashok Nagar Delhi NCR
 
International Business Environments and Operations 16th Global Edition test b...
International Business Environments and Operations 16th Global Edition test b...International Business Environments and Operations 16th Global Edition test b...
International Business Environments and Operations 16th Global Edition test b...
 

Proyecto final

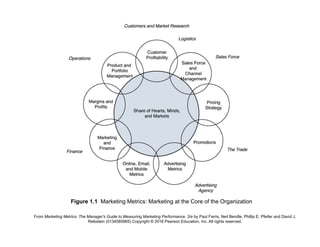
  • 1. Figure 1.1 Marketing Metrics: Marketing at the Core of the Organization From Marketing Metrics: The Manager's Guide to Measuring Marketing Performance, 3/e by Paul Farris, Neil Bendle, Phillip E. Pfeifer and David J. Reibstein (0134085965) Copyright © 2016 Pearson Education, Inc. All rights reserved.
  • 2. From Marketing Metrics: The Manager's Guide to Measuring Marketing Performance, 3/e by Paul Farris, Neil Bendle, Phillip E. Pfeifer and David J. Reibstein (0134085965) Copyright © 2016 Pearson Education, Inc. All rights reserved. Figure 2.1 The BCG Matrix
  • 3. Figure 2.2 Awareness, Attitudes, and Usage: Hierarchy of Effects From Marketing Metrics: The Manager's Guide to Measuring Marketing Performance, 3/e by Paul Farris, Neil Bendle, Phillip E. Pfeifer and David J. Reibstein (0134085965) Copyright © 2016 Pearson Education, Inc. All rights reserved.
  • 4. Figure 2.3 Ratings From Marketing Metrics: The Manager's Guide to Measuring Marketing Performance, 3/e by Paul Farris, Neil Bendle, Phillip E. Pfeifer and David J. Reibstein (0134085965) Copyright © 2016 Pearson Education, Inc. All rights reserved.
  • 5. Figure 2.4 A Typical Five-Point Scale From Marketing Metrics: The Manager's Guide to Measuring Marketing Performance, 3/e by Paul Farris, Neil Bendle, Phillip E. Pfeifer and David J. Reibstein (0134085965) Copyright © 2016 Pearson Education, Inc. All rights reserved.
  • 6. Figure 2.5 Hotel Customer Survey Response From Marketing Metrics: The Manager's Guide to Measuring Marketing Performance, 3/e by Paul Farris, Neil Bendle, Phillip E. Pfeifer and David J. Reibstein (0134085965) Copyright © 2016 Pearson Education, Inc. All rights reserved.
  • 7. Figure 3.1 Example of a Distribution Channel From Marketing Metrics: The Manager's Guide to Measuring Marketing Performance, 3/e by Paul Farris, Neil Bendle, Phillip E. Pfeifer and David J. Reibstein (0134085965) Copyright © 2016 Pearson Education, Inc. All rights reserved.
  • 8. Figure 3.2 Customer Relationships From Marketing Metrics: The Manager's Guide to Measuring Marketing Performance, 3/e by Paul Farris, Neil Bendle, Phillip E. Pfeifer and David J. Reibstein (0134085965) Copyright © 2016 Pearson Education, Inc. All rights reserved.
  • 9. Figure 3.3 Fixed and Variable Costs From Marketing Metrics: The Manager's Guide to Measuring Marketing Performance, 3/e by Paul Farris, Neil Bendle, Phillip E. Pfeifer and David J. Reibstein (0134085965) Copyright © 2016 Pearson Education, Inc. All rights reserved.
  • 10. Figure 3.4 Total Cost Consists of Fixed and Variable Costs From Marketing Metrics: The Manager's Guide to Measuring Marketing Performance, 3/e by Paul Farris, Neil Bendle, Phillip E. Pfeifer and David J. Reibstein (0134085965) Copyright © 2016 Pearson Education, Inc. All rights reserved.
  • 11. Figure 3.5 Total Cost per Unit Falls with Volume (Typical Assumptions) From Marketing Metrics: The Manager's Guide to Measuring Marketing Performance, 3/e by Paul Farris, Neil Bendle, Phillip E. Pfeifer and David J. Reibstein (0134085965) Copyright © 2016 Pearson Education, Inc. All rights reserved.
  • 12. Figure 3.6 At Break-Even, Total Costs = Total Revenues From Marketing Metrics: The Manager's Guide to Measuring Marketing Performance, 3/e by Paul Farris, Neil Bendle, Phillip E. Pfeifer and David J. Reibstein (0134085965) Copyright © 2016 Pearson Education, Inc. All rights reserved.
  • 13. Figure 4.1 Schematic of Simulated Test Market Volume Projection From Marketing Metrics: The Manager's Guide to Measuring Marketing Performance, 3/e by Paul Farris, Neil Bendle, Phillip E. Pfeifer and David J. Reibstein (0134085965) Copyright © 2016 Pearson Education, Inc. All rights reserved.
  • 14. Figure 4.2 Time Horizon Influences Perceived Results From Marketing Metrics: The Manager's Guide to Measuring Marketing Performance, 3/e by Paul Farris, Neil Bendle, Phillip E. Pfeifer and David J. Reibstein (0134085965) Copyright © 2016 Pearson Education, Inc. All rights reserved.
  • 15. Figure 4.3 Brand Equity—Outward Shift of Demand Curve From Marketing Metrics: The Manager's Guide to Measuring Marketing Performance, 3/e by Paul Farris, Neil Bendle, Phillip E. Pfeifer and David J. Reibstein (0134085965) Copyright © 2016 Pearson Education, Inc. All rights reserved.
  • 16. Figure 4.4 Young & Rubicam Brand Asset Valuator Patterns of Brand Equity From Marketing Metrics: The Manager's Guide to Measuring Marketing Performance, 3/e by Paul Farris, Neil Bendle, Phillip E. Pfeifer and David J. Reibstein (0134085965) Copyright © 2016 Pearson Education, Inc. All rights reserved.
  • 17. Figure 5.1 Customer Profitability by Decile From Marketing Metrics: The Manager's Guide to Measuring Marketing Performance, 3/e by Paul Farris, Neil Bendle, Phillip E. Pfeifer and David J. Reibstein (0134085965) Copyright © 2016 Pearson Education, Inc. All rights reserved.
  • 18. Figure 5.2 The Whale Curve From Marketing Metrics: The Manager's Guide to Measuring Marketing Performance, 3/e by Paul Farris, Neil Bendle, Phillip E. Pfeifer and David J. Reibstein (0134085965) Copyright © 2016 Pearson Education, Inc. All rights reserved.
  • 19. Figure 6.1 Sales Resulting from Calls to Customers From Marketing Metrics: The Manager's Guide to Measuring Marketing Performance, 3/e by Paul Farris, Neil Bendle, Phillip E. Pfeifer and David J. Reibstein (0134085965) Copyright © 2016 Pearson Education, Inc. All rights reserved.
  • 20. Figure 6.2 Sales Force Funnel From Marketing Metrics: The Manager's Guide to Measuring Marketing Performance, 3/e by Paul Farris, Neil Bendle, Phillip E. Pfeifer and David J. Reibstein (0134085965) Copyright © 2016 Pearson Education, Inc. All rights reserved.
  • 21. Figure 7.1 Maximum Willing to Buy and Maximum Reservation Price From Marketing Metrics: The Manager's Guide to Measuring Marketing Performance, 3/e by Paul Farris, Neil Bendle, Phillip E. Pfeifer and David J. Reibstein (0134085965) Copyright © 2016 Pearson Education, Inc. All rights reserved.
  • 22. Figure 7.2 Simple Linear Demand (Price-Quantity) Function From Marketing Metrics: The Manager's Guide to Measuring Marketing Performance, 3/e by Paul Farris, Neil Bendle, Phillip E. Pfeifer and David J. Reibstein (0134085965) Copyright © 2016 Pearson Education, Inc. All rights reserved.
  • 23. Figure 7.3 Example of Linear Demand Function From Marketing Metrics: The Manager's Guide to Measuring Marketing Performance, 3/e by Paul Farris, Neil Bendle, Phillip E. Pfeifer and David J. Reibstein (0134085965) Copyright © 2016 Pearson Education, Inc. All rights reserved.
  • 24. Figure 7.4 Linear Demand Function From Marketing Metrics: The Manager's Guide to Measuring Marketing Performance, 3/e by Paul Farris, Neil Bendle, Phillip E. Pfeifer and David J. Reibstein (0134085965) Copyright © 2016 Pearson Education, Inc. All rights reserved.
  • 25. Figure 7.5 Constant Elasticity From Marketing Metrics: The Manager's Guide to Measuring Marketing Performance, 3/e by Paul Farris, Neil Bendle, Phillip E. Pfeifer and David J. Reibstein (0134085965) Copyright © 2016 Pearson Education, Inc. All rights reserved.
  • 26. Figure 7.6 Optimal Price Midway Between Variable Cost and MRP From Marketing Metrics: The Manager's Guide to Measuring Marketing Performance, 3/e by Paul Farris, Neil Bendle, Phillip E. Pfeifer and David J. Reibstein (0134085965) Copyright © 2016 Pearson Education, Inc. All rights reserved.
  • 27. Figure 7.7 Linear Demand Functions with the Same MRP and Variable Cost From Marketing Metrics: The Manager's Guide to Measuring Marketing Performance, 3/e by Paul Farris, Neil Bendle, Phillip E. Pfeifer and David J. Reibstein (0134085965) Copyright © 2016 Pearson Education, Inc. All rights reserved.
  • 28. Figure 7.8 Two Segments Form Demand From Marketing Metrics: The Manager's Guide to Measuring Marketing Performance, 3/e by Paul Farris, Neil Bendle, Phillip E. Pfeifer and David J. Reibstein (0134085965) Copyright © 2016 Pearson Education, Inc. All rights reserved.
  • 29. Figure 7.9 Residual Price Elasticity From Marketing Metrics: The Manager's Guide to Measuring Marketing Performance, 3/e by Paul Farris, Neil Bendle, Phillip E. Pfeifer and David J. Reibstein (0134085965) Copyright © 2016 Pearson Education, Inc. All rights reserved.
  • 30. Figure 7.10 Prisoner’s Dilemma Pay-off Grid From Marketing Metrics: The Manager's Guide to Measuring Marketing Performance, 3/e by Paul Farris, Neil Bendle, Phillip E. Pfeifer and David J. Reibstein (0134085965) Copyright © 2016 Pearson Education, Inc. All rights reserved.
  • 31. Figure 7.11 Pay-off Grid with Arrows Representing Preferences for Prisoners From Marketing Metrics: The Manager's Guide to Measuring Marketing Performance, 3/e by Paul Farris, Neil Bendle, Phillip E. Pfeifer and David J. Reibstein (0134085965) Copyright © 2016 Pearson Education, Inc. All rights reserved.
  • 32. Figure 7.12 Pay-off Grid with Expected Values (Values Are in the Millions of Dollars) From Marketing Metrics: The Manager's Guide to Measuring Marketing Performance, 3/e by Paul Farris, Neil Bendle, Phillip E. Pfeifer and David J. Reibstein (0134085965) Copyright © 2016 Pearson Education, Inc. All rights reserved.
  • 33. Figure 7.13 Pay-off Grid with Expected Values and Preference Arrows (Contribution Values Are in the Millions of Dollars) From Marketing Metrics: The Manager's Guide to Measuring Marketing Performance, 3/e by Paul Farris, Neil Bendle, Phillip E. Pfeifer and David J. Reibstein (0134085965) Copyright © 2016 Pearson Education, Inc. All rights reserved.
  • 34. Figure 8.1 Monthly Sales Patterns From Marketing Metrics: The Manager's Guide to Measuring Marketing Performance, 3/e by Paul Farris, Neil Bendle, Phillip E. Pfeifer and David J. Reibstein (0134085965) Copyright © 2016 Pearson Education, Inc. All rights reserved.
  • 35. Figure 8.2 Downward Spiral—Promotional Effectiveness From Marketing Metrics: The Manager's Guide to Measuring Marketing Performance, 3/e by Paul Farris, Neil Bendle, Phillip E. Pfeifer and David J. Reibstein (0134085965) Copyright © 2016 Pearson Education, Inc. All rights reserved.
  • 36. Figure 8.3 Successful Promotion with Long-Term Benefits From Marketing Metrics: The Manager's Guide to Measuring Marketing Performance, 3/e by Paul Farris, Neil Bendle, Phillip E. Pfeifer and David J. Reibstein (0134085965) Copyright © 2016 Pearson Education, Inc. All rights reserved.
  • 37. Figure 9.1 Venn Diagram Illustration of Net Reach From Marketing Metrics: The Manager's Guide to Measuring Marketing Performance, 3/e by Paul Farris, Neil Bendle, Phillip E. Pfeifer and David J. Reibstein (0134085965) Copyright © 2016 Pearson Education, Inc. All rights reserved.
  • 38. Figure 9.2 Illustration of Cumulative Advertising Effectiveness From Marketing Metrics: The Manager's Guide to Measuring Marketing Performance, 3/e by Paul Farris, Neil Bendle, Phillip E. Pfeifer and David J. Reibstein (0134085965) Copyright © 2016 Pearson Education, Inc. All rights reserved.
  • 39. Figure 10.1 Clickthrough Process From Marketing Metrics: The Manager's Guide to Measuring Marketing Performance, 3/e by Paul Farris, Neil Bendle, Phillip E. Pfeifer and David J. Reibstein (0134085965) Copyright © 2016 Pearson Education, Inc. All rights reserved.
  • 40. Figure 10.2 The Order Acquisition Process From Marketing Metrics: The Manager's Guide to Measuring Marketing Performance, 3/e by Paul Farris, Neil Bendle, Phillip E. Pfeifer and David J. Reibstein (0134085965) Copyright © 2016 Pearson Education, Inc. All rights reserved.
  • 41. Figure 10.3 Relationship of Hits to Pageviews to Visits to Visitors From Marketing Metrics: The Manager's Guide to Measuring Marketing Performance, 3/e by Paul Farris, Neil Bendle, Phillip E. Pfeifer and David J. Reibstein (0134085965) Copyright © 2016 Pearson Education, Inc. All rights reserved.
  • 42. Figure 10.4 Example of Online Newspaper Visitor From Marketing Metrics: The Manager's Guide to Measuring Marketing Performance, 3/e by Paul Farris, Neil Bendle, Phillip E. Pfeifer and David J. Reibstein (0134085965) Copyright © 2016 Pearson Education, Inc. All rights reserved.
  • 43. Figure 10.5 A Clickstream Documented From Marketing Metrics: The Manager's Guide to Measuring Marketing Performance, 3/e by Paul Farris, Neil Bendle, Phillip E. Pfeifer and David J. Reibstein (0134085965) Copyright © 2016 Pearson Education, Inc. All rights reserved.
  • 44. Figure 11.1 Profits = Revenues Less Costs From Marketing Metrics: The Manager's Guide to Measuring Marketing Performance, 3/e by Paul Farris, Neil Bendle, Phillip E. Pfeifer and David J. Reibstein (0134085965) Copyright © 2016 Pearson Education, Inc. All rights reserved.
  • 45. Figure 11.2 EVA Is After-Tax Profit Minus a Charge for Capital Usage From Marketing Metrics: The Manager's Guide to Measuring Marketing Performance, 3/e by Paul Farris, Neil Bendle, Phillip E. Pfeifer and David J. Reibstein (0134085965) Copyright © 2016 Pearson Education, Inc. All rights reserved.
  • 46. Figure 11.3 Evaluating the Return to Marketing From Marketing Metrics: The Manager's Guide to Measuring Marketing Performance, 3/e by Paul Farris, Neil Bendle, Phillip E. Pfeifer and David J. Reibstein (0134085965) Copyright © 2016 Pearson Education, Inc. All rights reserved.
  • 47. Figure 12.1 Prestige Luggage: Marketing Management Dashboard From Marketing Metrics: The Manager's Guide to Measuring Marketing Performance, 3/e by Paul Farris, Neil Bendle, Phillip E. Pfeifer and David J. Reibstein (0134085965) Copyright © 2016 Pearson Education, Inc. All rights reserved.
  • 48. Figure 13.1 An Extended DuPont Model (adapted from http://www.12manage.com/ methods_dupont_model.html) From Marketing Metrics: The Manager's Guide to Measuring Marketing Performance, 3/e by Paul Farris, Neil Bendle, Phillip E. Pfeifer and David J. Reibstein (0134085965) Copyright © 2016 Pearson Education, Inc. All rights reserved.
  • 49. Figure 13.2 A Sales Model From Marketing Metrics: The Manager's Guide to Measuring Marketing Performance, 3/e by Paul Farris, Neil Bendle, Phillip E. Pfeifer and David J. Reibstein (0134085965) Copyright © 2016 Pearson Education, Inc. All rights reserved.
  • 50. Figure 13.3 Empirical Relationships between Marketing Decisions and Objectives From Marketing Metrics: The Manager's Guide to Measuring Marketing Performance, 3/e by Paul Farris, Neil Bendle, Phillip E. Pfeifer and David J. Reibstein (0134085965) Copyright © 2016 Pearson Education, Inc. All rights reserved.
  • 51. Figure 13.4 Empirical Relationship with Components of Marketing Outcomes From Marketing Metrics: The Manager's Guide to Measuring Marketing Performance, 3/e by Paul Farris, Neil Bendle, Phillip E. Pfeifer and David J. Reibstein (0134085965) Copyright © 2016 Pearson Education, Inc. All rights reserved.
  • 52. Figure 13.5 Simulated Test Markets Combine Empirical and Identity Relationships From Marketing Metrics: The Manager's Guide to Measuring Marketing Performance, 3/e by Paul Farris, Neil Bendle, Phillip E. Pfeifer and David J. Reibstein (0134085965) Copyright © 2016 Pearson Education, Inc. All rights reserved.
  • 53. Figure 13.6 Empirical Relationship with Marketing Components and Intermediate Metrics and Constructs From Marketing Metrics: The Manager's Guide to Measuring Marketing Performance, 3/e by Paul Farris, Neil Bendle, Phillip E. Pfeifer and David J. Reibstein (0134085965) Copyright © 2016 Pearson Education, Inc. All rights reserved.