Digital Bristol: Online community in the charity sector
Nonprofit current conditions june 2010
1. July 2010
Nonprofit Current Conditions Report
Analysis of a Minnesota Council of Nonprofits member survey
by Steve Jenkins, information and database specialist and Jon Pratt, executive director
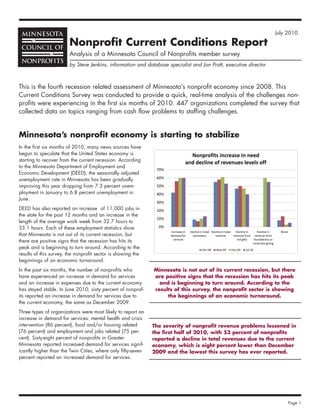
This is the fourth recession related assessment of Minnesota’s nonprofit economy since 2008. This
Current Conditions Survey was conducted to provide a quick, real-time analysis of the challenges non-
profits were experiencing in the first six months of 2010. 447 organizations completed the survey that
collected data on topics ranging from cash flow problems to staffing challenges.
Minnesota’s nonprofit economy is starting to stabilize
In the first six months of 2010, many news sources have
begun to speculate that the United States economy is Nonprofits increase in need
starting to recover from the current recession. According
and decline of revenues levels off
to the Minnesota Department of Employment and
70%
Economic Development (DEED), the seasonally adjusted
unemployment rate in Minnesota has been gradually 60%
improving this year dropping from 7.3 percent unem- 50%
ployment in January to 6.8 percent unemployment in 40%
June.
30%
DEED has also reported an increase of 11,000 jobs in 20%
the state for the past 12 months and an increase in the
10%
length of the average work week from 32.7 hours to
33.1 hours. Each of these employment statistics show 0%
Increase in Decline in total Decline in total Decline in Decline in None
that Minnesota is not out of its current recession, but demand for volunteers revenue revenue from revenue from
services ind gifts foundations or
there are positive signs that the recession has hits its corporate giving
peak and is beginning to turn around. According to the Dec 08 May 09 Dec 09 Jul 10
results of this survey, the nonprofit sector is showing the
beginnings of an economic turnaround.
In the past six months, the number of nonprofits who Minnesota is not out of its current recession, but there
have experienced an increase in demand for services are positive signs that the recession has hits its peak
and an increase in expenses due to the current economy and is beginning to turn around. According to the
has stayed stable. In June 2010, sixty percent of nonprof- results of this survey, the nonprofit sector is showing
its reported an increase in demand for services due to the beginnings of an economic turnaround.
the current economy, the same as December 2009.
Three types of organizations were most likely to report an
increase in demand for services: mental health and crisis
intervention (86 percent), food and/or housing related The severity of nonprofit revenue problems lessened in
(76 percent) and employment and jobs related (75 per- the first half of 2010, with 53 percent of nonprofits
cent). Sixty-eight percent of nonprofits in Greater reported a decline in total revenues due to the current
Minnesota reported increased demand for services signif- economy, which is eight percent lower than December
icantly higher than the Twin Cities, where only fifty-seven 2009 and the lowest this survey has ever reported.
percent reported an increased demand for services.
Page 1
2. Revenue reductions have stabalized
Reduction in revenue was the defining effect of the recession is down seven percentage points from December 2009.
for nonprofits. The severity of nonprofit revenue problems less-
Human Services (35 percent), community building (38 per-
ened in the first half of 2010, with 53 percent of nonprofits
cent), and education (39 percent) were the types of nonprofits
reported a decline in total revenues due to the current econo-
that were least likely to report a decline in revenue from indi-
my, which is eight percent lower than December 2009 and the
vidual gifts, while legal, civil rights, advocacy and/or crime
lowest this survey has ever reported.
nonprofits were the most likely to report a decline in individual
The two activity areas that are doing particularly well are food gifts at sixty-three percent.
and/or housing (42 percent) and arts, culture and humanities
Fifty-five percent of nonprofits reported a decline in revenue
(43 percent). The types of organizations most frequently report-
from foundations, which is five percent less than December
ing decline in total revenue are legal, civil rights, advocacy
2009. Some types of organizations that most frequently report-
and/or crime (63 percent) and community building, volun-
ed declining foundation support were community building (62
teerism and/or philanthropy (62 percent).
percent), mental health (62 percent) and employment related
When looking at particular revenue streams, nonprofits report- (60 percent), while education related nonprofits were the least
ed less of decline in revenue from individual gifts and from likely to report a decline in revenue from foundations (42 per-
foundations. Forty percent of nonprofits reported a decline in cent).
revenue from individual gifts due to the current economy, which
Economic challenges still greatest for smallest organizations
While the sector as a While trying to cope
whole seems to be Smaller organizations struggle the most with fewer resources available with this situation,
Decline in individual Decline in
picking up, small nonprofits have
Decline in total revenue contributions volunteers
Minnesota nonprofits Dec 09 Jun 10 Dec 09 Jun 10 Dec 10 Jun 10 experienced a decline
with budgets less Small organizations 63% 61% 53% 44% 16% 22% in volunteers and a
than $400,000 per Medium organizations 62% 52% 44% 41% 7% 9% decline in their oper-
year are still experi- Large organizations 60% 50% 38% 32% 5% 5% ating reserve. Small
Very large organizations 56% 35% 52% 40% 6% 8%
encing significant nonprofits are com-
challenges. Sixty-one monly dependent
percent of small non- Experienced cash flow Have reserves available Have a line of credit upon volunteers to
profits have experi- troubles to use available to use fundraise, provide
Dec 10 Jun 10 Dec 09 Jun 10 Dec 09 Jun 10
enced a decline in direct services, and a
Small organizations 39% 40% 62% 64% 14% 19%
total revenue due to Medium organizations 36% 24% 73% 80% 37% 37% variety of other tasks,
the economy much Large organizations 25% 21% 74% 85% 59% 51% which makes the
higher than very Very large organizations 23% 18% 69% 83% 55% 60% twenty-two percent
large organizations decline in volunteers
with budgets greater than $10 million (35 percent). compared to nine percent for larger organizations even more
distressing. In tough financial times, nonprofits may have to use
The revenue problems of small nonprofits can be partially
their operating reserve to compensate for declining revenues.
attributed to a reduction in revenue from individual contribu-
tions, their most common primary source of income. Forty- Small organizations are least likely to have operating reserves
seven percent of small nonprofits reported a decrease in rev- or a line of credit. Eleven percent of small nonprofits report that
enue from individual contributions since the beginning of year they have used up their operating reserve in the last two years,
compared to thirty-eight percent for larger nonprofits. Cash leaving thirty-six percent of small nonprofits without an operat-
flow was a problem that affected small nonprofits more than ing reserve. Only 19 percent of small nonprofits report having
larger organizations. Forty percent of small nonprofits have access to a line of credit.
reported cash flow as a problem in the first half of 2010, while
only twenty-seven percent of larger organizations reported hav-
ing cash flow problems.
Page 2
3. Nonprofits have started hiring, but some still laying off
In a recession, staffing is new staff were mental health
one of the key indicators Nonprofits are starting to hire again (29 percent) and health
used to determine how a 30% and/or disease related (26
nonprofit is changing. percent). Not counting
25% replacements, twenty-two per-
Since December 2009,
cent of nonprofits anticipate
twenty-three percent of
20% hiring staff by the end of
nonprofits have eliminated
2010. Health and/or disease
staff positions. The types
15% related (35 percent) and edu-
of organizations that most
cation related (29 percent)
frequently reported elimi-
10% nonprofits most frequently
nating staff were employ-
reported that they anticipate
ment related (40 percent),
hiring new staff, while only 4
human services (35 per- 5%
percent of legal related non-
cent) and legal related
profit anticipate hiring staff by
(33 percent). This con- 0%
Eliminated Staff Positions the end of 2010.
Hired in first six months of 2010 Will hire in final six months of
trasts with only five per- 2010
cent of food and/or hous- Twenty-six percent of nonprof-
ing and seven percent of its in the Twin Cities anticipate
education related organizations reporting reduced staff. hiring new staff by year end, which is twice as much as
Greater Minnesota at 13 percent.
Nonprofits in the Twin Cities (25 percent) were more likely to
eliminate staff positions than nonprofits in Greater Minnesota Larger nonprofits reported they anticipate hiring staff by the
(18 percent). Forty-one percent of nonprofits reported having end of 2010 more often than smaller nonprofits. Forty percent
adopted a hiring freeze, 5 percent instituted voluntary fur- of very large nonprofits (budget size over $10 million) and 34
loughs, 3 percent instituted involuntary furloughs, 8 percent cut percent of large nonprofits (budget size between $2 -10 mil-
staff salaries and 13 percent cut staff benefits. lion) anticipate hiring staff. In contrast, only 14 percent of small
nonprofits (budget size under $400,000) and 17 percent of
While many nonprofits have used staff reduction as a way to
medium size nonprofits (budget size between $400,000 and
weather the recession, other organizations have been hiring
$1,999,999) anticipate hiring new staff.
and even more are planning on hiring by the end of the year.
Eighteen percent of nonprofits have hired additional staff since Of the nonprofits that anticipate hiring new staff by year end,
December 2009. the average number of anticipated new full-time employees per
employer was 3.6 and the median was 2 full-time employees
The types of organizations that most frequently reported adding
per employer.
“Part of our success at weathering the recession is the result of freezing compensation. This strategy works, but
is not sustainable over the long haul.”
-a medium-sized arts organization in Greater Minnesota
“We are surprised that we have had a turn-around after a very difficult 2009. We responded very early to the
threats of the economy in 2008 and began a first round of lay-offs, and then made a smaller second round of
lay-offs in 2009. We are now looking at restoring those staff positions as our admissions and contributed
income rebound.”
-a large arts organization in the Twin Cities
Page 3
4. Revenue streams show mixed anticipated results
Ideally organizations hope for reliability in their revenue cent expect to fall between 81-90 percent and 18 percent
streams, but uncertainty about the near future makes planning expect to fall below 80 percent of their annual revenue goal.
and budgeting grueling. As nonprofits project what percentage While each nonprofit has its own unique situation, some inter-
of their annual revenue goal they will meet, 11 percent report esting trends can be seen when looking at each type of rev-
that they expect to exceed their revenue goal, 46 percent enue stream.
expect to reach between 91-100 percent of their goal, 18 per-
Organizations report their year end Nonprofits Largest Revenue Source
expectations of revenue streams Private
Individual Earned Government Foundation
45% Activity Area Contributions Income Funding Grants Other
Arts, Culture and Humanities 21% 30% 15% 25% 9%
40%
Community Building, Volunteerism and Philanthropy 21% 10% 31% 24% 14%
35% Education related 17% 29% 17% 24% 12%
Employment and/or job related 5% 25% 65% 5% 0%
30% Environment and/or animal related 42% 0% 11% 37% 11%
Food and/or housing related 32% 21% 29% 18% 0%
25% Health and/or disease related 21% 30% 28% 9% 12%
Human services and/or youth development 12% 12% 48% 23% 4%
20% Legal, civil rights, advocacy and/or crime 11% 0% 63% 19% 7%
Mental health and crisis intervention 5% 52% 29% 0% 14%
15%
Location
10% Greater Minnesota 24% 13% 44% 11% 7%
Twin Cities 16% 23% 30% 23% 8%
5% Size
Small organizations 27% 13% 26% 27% 8%
0% Medium organizations 18% 21% 28% 24% 9%
Excellent Good Fair Poor Large organizations 8% 26% 48% 12% 7%
Very large organizations 15% 28% 50% 3% 5%
Earned Income Individual Contributions Corportate and foundation grants
Individual contributions
Individual contributions are the primary source of revenue for One type of individual donation that is the subject of ongoing
18 percent of nonprofits in Minnesota. Environmental (42 per- legislation is charitable rollover contributions from Individual
cent) and food and/or housing (32 percent) organizations Retirement Accounts. The provision allows individuals aged
were the types of organizations that most frequently reported 70½ and older to donate up to $100,000 from their
individual contributions as their primary source of revenue. Individual Retirement Accounts (IRAs) to public charities without
having to count the distributions as taxable income, yet due to
In the past six months, the majority of nonprofits reported indi-
the revenue loss to the Treasury this provision has to be extend-
vidual contributions have decreased (43 percent) or stayed the
ed each year by Congress.
same (33 percent) compared to the first six months of 2009.
Environmental nonprofits were very polarized in their experi- Only four percent of Minnesota nonprofits report receiving any
ences with individual contributions, because they had the high- IRA rollover contributions, with the most likely recipients being
est number of nonprofits reporting an increase (31 percent) large organizations (seven percent report receiving IRA
and one of the highest numbers reporting a decrease (50 per- rollovers) and both $10 million and above organizations and
cent). arts organizations (eight percent report receiving rollovers).
The total amount received by these organizations was
Some other types of organizations that most frequently reported
$91,000 – with a median of $5,000 per organization – a tiny
an increase in individual contributions were food and/or hous-
fraction of their total revenues.
ing (29 percent) and arts organizations (27 percent). Legal
related nonprofits (59 percent) and education related (48 per-
cent) were some other types of organizations that frequently
reported a decrease in individual contributions. While individ-
ual contributions are decreasing, they are not dropping dra-
matically. Fifty-two percent of nonprofits expect to reach over
90 percent of their annual individual contributions.
“Our individual contributions are not down as a whole number, but we are working much harder to identify
new donors. Our returning donors and new donors are all giving at a lower amounts and we are spending
more time and resources on fundraising and less on our programs.”
-a small education related nonprofit in the Twin Cities
Page 4
5. Earned Income
Twenty percent of nonprofits reported earned income as their Mental health (54 percent) and food and/or housing (48 per-
primary source of income. Mental health (52 percent), health cent) organizations most frequently reported an increase in
and/or disease related (30 percent) and arts organizations earned income, while employment related (50 percent) and
most frequently reported earned income as their primary community building (46 percent) organizations most frequently
source of revenue. reported a decrease. Even though earned income has shown
positive growth in the first six months, nonprofits are hesitant
Earned income has been the most stable revenue source in the
when estimating what percentage of their annual goals they
past six months. Thirty-four percent of nonprofits reported an
will reach.
increase in earned income in the past six months compared to
the first half of 2009, while 33 percent reported earned Twelve percent of nonprofits expect to exceed their annual goals,
income has stayed the same and 33 percent reported a while 44 percent expect to reach between 91-100 percent of
decrease. their goal, 22 percent between 81- 90 percent of their goal and
22 percent falling 80 percent or below their annual goal.
Foundation support
Twenty percent of nonprofits reported income from private foun- In particular, environmental (73 percent) and legal (67 percent)
dation grants as their primary source of income. Environmental nonprofits reported a decrease in funding from private founda-
(37 percent), arts (25 percent) and education (24 percent) tion grants. In contrast, twenty-four percent of arts organiza-
related nonprofits most frequently reported grants from private tions, 20 percent of both health and/or disease related and
foundations as their primary source of income. education related organizations reported an increase in private
foundations grants. Expectedly, only nine percent of nonprofits
Revenue from private foundation grants has been the least stable
expect to exceed their annual goals, while 35 percent expect
of nonprofit revenue streams. Fifty-three percent of nonprofits
to reach between 91-100 percent of their goal, 19 percent
reported a decrease in foundation grants in the past six months
between 81- 90 percent of their goal and 37 percent falling
compared to the first half of 2009, while 16 percent reported an
80 percent or below their annual goal.
increase and 32 percent reported grants stayed the same.
Government
The most common primary source of revenue for nonprofits is have reported experiencing delays in payment. Education
government funding. Thirty-four percent of nonprofits report related (43 percent) and mental health (36 percent) nonprofits
government funding as their primary source of revenue. have most frequently experienced delays in government pay-
ments. The State of Minnesota has negotiated a $500 million
The larger an organization’s budget size the more likely they
line of credit for its own use anticipating its own cash flow
are to have government funding as their primary source of rev-
problem, increasing pressure on organizations to time manage
enue. Fifty percent of very large organizations ($10 million +)
payments to vendors
and 48 percent of large organizations ($2 -10 million) report-
ed government funding as their largest funding source com- The Clean Water, Land, and Legacy Amendment passed by
pared to 26 percent for small organizations (less than Minnesota voters in 2008 provided an additional revenue
$400,000) and 28 percent for medium size organizations source for many arts and environmental organizations. Forty-
($400,000-2 million). Employment related (65 percent), legal nine percent of the arts organizations and sixteen percent of
related (63 percent), human services (48 percent) and commu- environmental organizations have received funding from the
nity building (31 percent) nonprofits most frequently reported Clean Water, Land and Legacy Amendment. Of arts organiza-
government funding as their primary source of revenue. tions, 42 percent used the funding to expand upon existing
programs and 39 percent used the funding to create a new
Adding to the management challenges can be cash flow prob-
long term project. Sixty-seven percent of environmental organi-
lems passed down from cash short units of government. Twenty-
zations used the funding from new long term projects.
seven percent of nonprofits that receive government funding
Special events
Many nonprofits have used special fundraising events to com- profits most frequently reported an increase in special events
pensate for the decline in other revenue areas. Fifty-three per- revenue. Comparatively, employment related (50 percent) and
cent of nonprofits have seen an increase in revenue from spe- education related (42 percent) most frequently reported a
cial events in the past six months compared to the first six decrease in revenue from special events. Sixty percent of non-
months of 2009, while 30 percent reported a decrease and profits in Greater Minnesota reported an increase in revenue
17 percent reported revenue stayed the same. Environmental from special events ten percent higher than the Twin Cities (50
related (75 percent ) and community building (64 percent) non- percent).
Page 5
6. Nonprofits are proactive in response to changing economy
In the past six months, Minnesota nonprofits have been deci- cent of food and/or housing reported a reduction.
sive in reacting to the current economic crisis. Eighty-five per-
Twenty percent of nonprofits put expansion plans on hold, the
cent of nonprofits have made operational changes to help in
most common types being mental health (38 percent), legal
the short term and 88 percent have taken steps to plan for the
related (26 percent) and arts organizations (26 percent).
long term future of their organization.
Another common measure taken by seventeen percent of non-
The most common change nonprofits made in order to respond
profits was to reduce programming. Arts organizations (26
to the economy has been to increase their fundraising efforts
percent) and human services organizations (24 percent) were
(49 percent).The types of organizations that most frequently
the most likely to reduce programming. Some other retrench-
reported increased fundraising efforts were food and/or hous-
ment measures taken by nonprofits were to reduce office space
ing (61 percent) and legal related (59 percent).
(7 percent), with this option most common for legal related
The second most common measure to respond to the economy organizations (19 percent); reduce the hours of operation (5
was to reduce the organization’s budget size (39 percent). percent); merge with another nonprofit organization (3 per-
Education related (49 percent), legal related (48 percent) and cent), a strategy most common among employment related
community building (26 percent) nonprofits most frequently organizations (10 percent); and change the mission of the
reported a reduction in budget size, while only twenty-six per- organization a very small 2 percent.
“In 2009 and 2010, we reduced staff in administration and building operations to protect programs. We did this
in anticipation of reduced foundation and United Way revenues. At this point, our staffing capacity is stretched to
the limit. There is no margin, even for staff vacations and illness. We are meeting increased demand but cannot
stretch the rubber band any further before it breaks.”
-a large human services organization in the Twin Cities
Looking toward the future
As the recession begins to turnaround, nonprofits report steps
Larger nonprofits more likely to plan for the future
they continue to take to prepare for the future. including:
90%
• Analysis of financial and programmatic trends over the 80%
past 1 to 3 years (63 percent). The most common types of 70%
organizations: mental health (81 percent) and employment 60%
related (75 percent).
50%
• Projection of revenue over the next 1 to 3 years (63 per- 40%
cent). The most common types of organizations: food 30%
and/or housing related (87 percent), employment related
20%
(80 percent) and mental health (76 percent).
10%
• Development of several scenarios and contingencies based 0%
on various assumptions about funding changes (61 per- Analysis trends Projection of Development of Analysis of Consideration Renegotiation of
revenue contingencies program costs short t
ti i t h t term or terms
t
cent). The most common types of organizations: mental based long term deficit
health (71 percent), food and/or housing related (68 per- Small organizations Medium organizations Large organizations Very large organizations
cent) and human services (68 percent). The least common
type of organization: environment (47 percent).
• Analysis of fully-allocated costs of programs, including indi- cent). The most common types of organizations: mental
rect expenses and the level of support for these programs health (38 percent), health and/or disease related (35 per-
(47 percent). The most common types of organizations: cent) and legal related (33 percent). The least common type
mental health (81 percent), health and/or disease related of organization: education related (20 percent)
(58 percent) and food and/or housing related (58 percent).
• Renegotiation of terms with funding sources (12 percent).
The least common type of organization: arts, culture and
The most common types of organizations: mental health (24
humanities (34 percent)
percent), health and/or disease related (23 percent) and
• Consideration of whether or not the organization should employment related (20 percent). The least common type of
intentionally run a short-term or long-term deficit (27 per- organization: arts, culture and humanities (4 percent).
Page 6
7. Perception on economy improving
While the past six months have shown some signs of
Nonprofits are predicting ongoing challenges
improvement, Minnesota nonprofits have not changed their
70%
outlook on the economy from the last survey. Fifty-eight per-
cent of organizations expect an increase in demand for serv- 60%
ices and 60 percent expect an increase in expenses. 50%
Nonprofits are slightly more optimistic about raising revenue 40%
compared to previous years. Fifty-six percent of organiza-
tions expect a decline in total revenue compared to 62 per- 30%
cent for December 2009 and 60 percent for May 2009. 20%
Forty percent of nonprofits believe their organization will suf-
10%
fer a decline in revenue from individual gifts, which is a 12
percent drop from six months ago. Nonprofits report that 0%
they are less worried about a drop in foundation grants as Increase in Decline in Decline in total Decline in Decline in None
demand for volunteers revenue revenue from revenue from
well with 55 percent expecting a decline compared to 66 services
i individual ift
i di id l gifts foundation
f d ti
grants
percent six months ago.
May 09 Dec 09 Jul 10
*Response to the question: As you look at the next 12 months, what challenges are like-
ly for your organization?
“While 2010 has been a good year so far, we are more concerned about 2011 than the second half of 2010.”
-a large mental health organization in the Twin Cities
“We have weathered the last 12 months with salary freezes and position reductions. The next 12 months look
to be a much bigger challenge as previous cuts aren't sufficient to make up the deficit.”
-a large education organization in the Twin Cities
MCN’s goal to strengthen the economic sustainability of nonprofits
MCN’s member organizations rely on MCN for information, As part of MCN’s 2010-2014 strategic plan, MCN’s board
resources and support to help them navigate the economy. approved four strategies to fortify nonprofit economics:
With a full set of tracking research, seminars and cost saving
a) Create practical tools and applications to increase the oper-
discounts, MCN is positioned to provide resources and tools
ational capacity of small to mid-sized organizations to
and to drive a new investigation of sustainable models, along
deliver effective services.
with partner organizations such as the Nonprofit Assistance
Fund and MAP for Nonprofits. b) Deliver timely fiscal data, revenue trends and projections on
Minnesota’s nonprofit economy.
Nonprofit leaders need access to specific information on cur-
rent conditions facing the sector, how to demonstrate and com- c) Enhance the public dialogue on nonprofit sustainability by
municate their impact and to imagine what a redesigned sector producing practical analyses on the realities of the nonprof-
will look like. it economy and appropriate management strategies.
d) Provide strategic guidance to nonprofit employers to
enhance affordability and purchasing power in health insur-
ance decisionmaking.
Page 5
8. Respondent distribution
This report analyses the results of the fourth Current Conditions This is a higher representation from the metro area than for
Survey. The survey was conducted from June 17-30, 2010 and Minnesota nonprofits as a whole, where the Twin Cities Metro
was sent to approximately 2,000 nonprofits. It was completed Area holds 51 percent of all nonprofits while 49 percent are
by 447 organizations employing roughly 22,664 staff. located in Greater Minnesota.
The participating organizations represent the full range of The survey was completed by 54 percent executive directors, 2
Minnesota nonprofit activity areas, budget sizes and geograph- percent chief operating officers, 8 percent chief financial offi-
ic locations. 74 percent of the respondents were from the Twin cers, 10 percent development directors and 26 percent other
Cities Metro Area and 26 percent from Greater Minnesota. staff positions .
Responses by activity area
Mental health and
Legal, civil rights, crisis intervention
advocacy and/or 5% Community Building,
crime Volunteerism and
6% Arts,
Arts Culture and Philanthropy
py
Humanities 9%
13%
Human services
Education related
and/or youth
9%
development
29%
Health and/or Food and/or housing
disease related related
Employment
10% 9%
and/or job
related
5%
Environment and/or
animal related
4%
2314 University Avenue West, Suite 20, Saint Paul, MN 55114
TeL: 651-642-1904 • 800-289-1904 • Fax: 651-642-1517 • www.mncn.org
About the Minnesota Council of Nonprofits
The Minnesota Council of Nonprofits (MCN) is the statewide association of more than 2,000 Minnesota nonprofit organizations. Through its
Web site, publications, workshops and events, cost-saving programs and advocacy, MCN works to inform, promote, connect and strengthen
individual nonprofits and the nonprofit sector.
Copyright ® 2010 Minnesota Council of Nonprofits. All rights reserved. Short sections of text may be quoted without explicit permission,
provided that full credit is given to the source. Additional copies of this report can be downloaded from MCN’s Web site at
www.mncn.org.