February 2017 REBGV Statistics Package Mike Stewart Realtor
•
0 likes•4,239 views

http://www.mikestewart.ca/real-estate-board-of-greater-vancouver-rebgv-monthly-sales-statistics/

Recommended
Recommended
More Related Content
What's hot
What's hot (20)
Similar to February 2017 REBGV Statistics Package Mike Stewart Realtor
Similar to February 2017 REBGV Statistics Package Mike Stewart Realtor (20)
More from Mike Stewart
More from Mike Stewart (9)
Recently uploaded
Recently uploaded (20)
February 2017 REBGV Statistics Package Mike Stewart Realtor
- 1. News Release FOR IMMEDIATE RELEASE: Low supply continues to limit Metro Vancouver home buyers VANCOUVER, BC – March 2, 2017 – Reluctance amongst Metro Vancouver* home sellers is impacting sale and price activity throughout the region’s housing market. Residential home sales in the region totalled 2,425 in February 2017. This is a 41.9 per cent decrease from the record 4,172 homes sold in February 2016 and an increase of 59.2 per cent compared to January 2017 when 1,523 homes sold. Last month’s sales were 7.7 per cent below the 10-year February sales average. “February home sales were well below the record-breaking activity from one year ago and in line with our long-term historical average for the month,” Dan Morrison, Real Estate Board of Greater Vancouver (REBGV) president said. “Limited supply and snowy weather were two factors hampering this activity.” New listings for detached, attached and apartment properties in Metro Vancouver totalled 3,666 in February 2017. This represents a 36.9 per cent decrease compared to the 5,812 units listed in February 2016 and an 11.4 per cent decrease compared to January 2017 when 4,140 properties were listed. This is the lowest number of new listings registered in February since 2003. The total number of properties currently listed for sale on the Multiple Listing Service® (MLS®) in Metro Vancouver is 7,594, a four per cent increase compared to February 2016 (7,299) and a 4.9 per cent increase compared to January 2017 (7,238). The region’s sales-to-active listings ratio for February 2017 is 31.9 per cent, a 10-point increase from January. Generally, analysts say that downward pressure on home prices occurs when the ratio dips below the 12 per cent mark for a sustained period, while home prices often experience upward pressure when it surpasses 20 per cent over several months. “While home sales are not happening at the pace we experienced last year, home seller supply is still struggling to keep up with today’s demand. This is why we’ve seen little downward pressure on home prices, particularly in the condominium and townhome markets,” Morrison said. The MLS® Home Price Index composite benchmark price for all residential properties in Metro Vancouver is currently $906,700. This represents a 2.8 per cent decrease over the past six months and a 1.2 per cent increase compared to January 2017.
- 2. Sales of detached properties in February 2017 reached 745, a decrease of 58.1 per cent from the 1,778 detached sales recorded in February 2016. The benchmark price for detached properties is $1,474,200. This represents a 6.5 per cent decrease over the past six months and is unchanged compared to January 2017. Sales of apartment properties reached 1,275 in February 2017, a decrease of 28.8 per cent compared to the 1,790 sales in February 2016.The benchmark price of an apartment property is $526,300. This represents a 2.3 per cent increase over the past six months and a 2.7 per cent increase compared to January 2017. Attached property sales in February 2017 totalled 404, a decrease of 33.1 per cent compared to the 604 sales in February 2016. The benchmark price of an attached unit is $675,500. This represents a 0.3 per cent decrease over the past six months and a 1.3 per cent increase compared to January 2017. -30- *Editor’s Note: Areas covered by the Real Estate Board of Greater Vancouver include: Whistler, Sunshine Coast, Squamish, West Vancouver, North Vancouver, Vancouver, Burnaby, New Westminster, Richmond, Port Moody, Port Coquitlam, Coquitlam, Pitt Meadows, Maple Ridge, and South Delta. The real estate industry is a key economic driver in British Columbia. In 2016, 39,943 homes changed ownership in the Board’s area, generating $2.5 billion in economic spin-off activity and an estimated 17,600 jobs. The total dollar value of residential sales transacted through the MLS® system in Greater Vancouver totalled $40 billion in 2016. The Real Estate Board of Greater Vancouver is an association representing more than 13,400 REALTORS® and their companies. The Board provides a variety of member services, including the Multiple Listing Service®. For more information on real estate, statistics, and buying or selling a home, contact a local REALTOR® or visit www.rebgv.org. For more information please contact: Craig Munn Manager, Communication Real Estate Board of Greater Vancouver 604.730.3146 cmunn@rebgv.org
- 3. Property Type Area Benchmark Price Price Index 1 Month Change % 3 Month Change % 6 Month Change % 1 Year Change % 3 Year Change % 5 Year Change % 10 Year Change % Residential / Composite Lower Mainland $811,800 228.9 1.0% -0.1% -2.4% 15.8% 48.2% 48.8% 73.7% Greater Vancouver $906,700 237.3 1.2% -0.2% -2.8% 14.0% 48.5% 48.7% 80.9% Bowen Island $821,000 178.0 -1.1% 0.9% 2.9% 27.4% 47.4% 41.5% 40.7% Burnaby East $838,700 231.5 0.8% 0.3% -3.5% 13.9% 45.7% 50.3% 75.8% Burnaby North $788,200 236.9 2.1% 2.1% 1.0% 19.9% 52.7% 53.2% 80.7% Burnaby South $878,500 248.3 1.2% 3.3% 1.3% 21.4% 53.0% 54.5% 90.9% Coquitlam $748,100 222.0 2.2% -0.6% -4.3% 11.4% 46.4% 51.6% 69.6% Ladner $774,300 215.2 -1.3% -5.0% -7.1% 8.6% 44.0% 42.0% 70.7% Maple Ridge $570,300 192.7 -0.1% -0.6% -0.6% 22.6% 48.3% 46.3% 50.0% New Westminster $539,100 229.6 1.1% 2.4% 0.5% 18.1% 46.1% 47.7% 68.5% North Vancouver $969,300 218.7 0.6% -1.4% -5.6% 13.6% 49.3% 49.5% 73.2% Pitt Meadows $558,800 204.4 0.0% -0.7% 0.6% 22.4% 42.7% 49.5% 55.1% Port Coquitlam $588,400 208.5 3.0% 2.1% -2.4% 14.4% 46.6% 47.0% 57.2% Port Moody $770,000 212.9 0.5% 0.7% -0.8% 12.8% 47.9% 56.3% 63.5% Richmond $862,800 250.0 1.1% 0.5% -2.3% 15.6% 49.8% 44.5% 91.4% Squamish $663,200 216.2 0.7% 5.8% 6.5% 29.5% 77.6% 80.8% 81.2% Sunshine Coast $506,100 177.3 0.1% 3.0% 6.0% 26.6% 49.9% 45.7% 38.2% Tsawwassen $904,200 226.5 -0.8% -5.5% -6.7% 8.9% 49.9% 50.3% 78.6% Vancouver East $951,800 278.8 0.0% -1.4% -4.0% 12.9% 53.2% 58.4% 106.7% Vancouver West $1,210,000 255.0 2.1% -1.4% -3.4% 10.4% 46.2% 48.2% 91.6% West Vancouver $2,463,800 264.4 1.1% -1.9% -11.2% 9.3% 54.1% 58.0% 103.1% Whistler $764,400 177.6 2.2% 7.1% 7.6% 30.3% 74.5% 66.9% 52.2% Single Family Detached Lower Mainland $1,195,400 253.9 0.1% -1.6% -5.4% 15.1% 56.0% 56.7% 95.8% Greater Vancouver $1,474,200 271.9 0.0% -2.4% -6.5% 12.9% 57.6% 55.9% 110.6% Bowen Island $821,000 178.0 -1.1% 0.9% 2.9% 27.4% 47.4% 41.5% 40.7% Burnaby East $1,160,500 259.5 0.9% -1.0% -7.9% 9.4% 54.5% 56.7% 104.0% Burnaby North $1,499,600 290.0 1.3% -1.4% -6.1% 12.7% 61.9% 65.0% 124.3% Burnaby South $1,636,100 313.2 0.1% -0.3% -3.8% 20.7% 66.0% 72.3% 143.0% Coquitlam $1,120,800 248.7 1.2% -3.6% -8.8% 11.3% 55.5% 62.9% 92.8% Ladner $947,900 228.5 -2.1% -6.8% -8.1% 6.8% 52.6% 50.6% 82.5% Maple Ridge $710,400 202.4 -0.2% -0.4% -0.3% 22.8% 55.3% 54.2% 61.1% New Westminster $1,026,700 254.7 0.3% 0.0% -7.0% 11.9% 54.9% 53.1% 99.9% North Vancouver $1,556,600 247.8 -0.5% -4.3% -7.9% 12.6% 63.8% 63.3% 99.5% Pitt Meadows $771,500 217.4 0.2% -2.8% -1.6% 21.0% 55.6% 54.1% 69.6% Port Coquitlam $860,000 229.4 3.2% -0.5% -5.2% 10.7% 54.4% 57.2% 79.4% Port Moody $1,342,900 248.0 -0.1% -2.4% -3.7% 15.3% 54.8% 65.0% 91.7% Richmond $1,561,600 313.2 -0.3% -3.0% -8.4% 14.0% 66.3% 52.6% 138.7% Squamish $810,900 215.6 -0.6% 2.4% 1.4% 26.2% 65.1% 60.2% 78.6% Sunshine Coast $502,400 176.0 -0.1% 2.8% 5.7% 26.2% 49.4% 45.0% 37.2% Tsawwassen $1,151,300 247.9 -1.0% -5.9% -7.7% 7.5% 58.3% 61.1% 95.4% Vancouver East $1,425,600 315.1 -1.0% -3.3% -7.1% 12.6% 62.9% 70.7% 141.1% Vancouver West $3,422,700 351.4 0.1% -2.8% -5.4% 13.9% 59.4% 55.1% 160.1% West Vancouver $2,936,500 279.2 1.0% -2.6% -12.6% 8.3% 54.1% 59.4% 115.1% Whistler $1,363,200 188.7 0.6% 3.1% 3.1% 24.1% 53.0% 54.2% 62.4% HOW TO READ THE TABLE: • Benchmark Price: Estimated sale price of a benchmark property. Benchmarks represent a typical property within each market. • Price Index: Index numbers estimate the percentage change in price on typical and constant quality properties over time. All figures are based on past sales. • x Month/Year Change %: Percentage change of index over a period of x month(s)/year(s) * In January 2005, the indexes are set to 100. Townhome properties are similar to Attached properties, a category that was used in the previous MLSLink HPI, but do not included duplexes. The above info is deemed reliable, but is not guaranteed. All dollar amounts in CDN. February 2017* * MLS®, Multiple Listing Service®, and all related graphics are trademarks of The Canadian Real Estate Association 1 of 14
- 4. Property Type Area Benchmark Price Price Index 1 Month Change % 3 Month Change % 6 Month Change % 1 Year Change % 3 Year Change % 5 Year Change % 10 Year Change % February 2017* Townhouse Lower Mainland $563,600 204.0 1.0% 0.5% 0.1% 20.4% 43.7% 43.3% 57.2% Greater Vancouver $675,500 218.3 1.3% 1.3% -0.3% 18.3% 46.8% 47.2% 68.8% Burnaby East $538,100 193.0 -0.4% 1.5% 5.2% 27.9% 28.0% 31.2% 48.1% Burnaby North $539,500 201.2 3.1% 0.7% 5.0% 17.2% 34.7% 30.0% 53.6% Burnaby South $579,100 207.8 0.7% 0.9% 3.0% 24.1% 42.7% 37.8% 63.5% Coquitlam $527,200 193.7 4.5% 3.3% 2.1% 11.8% 39.2% 40.4% 49.3% Ladner $617,200 204.5 0.5% 3.6% -3.3% 14.3% 33.2% 34.5% 58.9% Maple Ridge $395,600 192.2 -0.2% -1.6% -3.1% 26.5% 45.6% 45.9% 45.1% New Westminster $545,500 204.9 1.8% 6.2% -0.8% 18.5% 37.8% 38.9% 59.2% North Vancouver $854,000 204.4 2.8% 1.6% -5.2% 17.3% 45.0% 43.2% 62.5% Pitt Meadows $480,000 207.7 -0.7% 0.5% 0.1% 24.8% 48.3% 52.0% 57.6% Port Coquitlam $535,100 202.9 1.0% 1.7% -2.7% 15.7% 43.8% 41.0% 52.8% Port Moody $516,300 174.5 0.8% -0.6% -4.1% -1.9% 28.9% 29.8% 33.3% Richmond $733,400 237.1 1.1% 1.5% 0.1% 19.4% 44.3% 47.3% 83.9% Squamish $729,400 265.0 3.6% 16.2% 18.8% 43.6% 119.2% 176.3% 126.7% Tsawwassen $616,700 203.8 1.4% 3.1% -3.8% 16.7% 37.1% 31.2% 58.4% Vancouver East $741,000 244.3 0.2% -3.2% -5.7% 8.4% 48.5% 47.1% 78.3% Vancouver West $1,069,800 242.0 0.3% -1.8% -3.4% 17.9% 53.4% 59.6% 90.1% Whistler $842,800 225.4 4.2% 9.1% 10.5% 33.2% 88.8% 104.9% 100.9% Apartment Lower Mainland $476,000 207.8 2.6% 2.8% 2.9% 16.9% 39.8% 40.3% 53.0% Greater Vancouver $526,300 211.6 2.7% 2.8% 2.3% 15.8% 40.2% 41.6% 58.0% Burnaby East $545,200 207.0 2.2% 1.1% -2.9% 4.8% 33.6% 52.5% 44.5% Burnaby North $503,600 212.9 2.6% 5.8% 7.6% 29.0% 49.5% 51.5% 60.8% Burnaby South $561,600 225.5 1.9% 6.5% 5.0% 22.6% 47.8% 48.5% 71.1% Coquitlam $359,100 197.7 3.1% 4.6% 3.6% 14.9% 38.3% 40.8% 46.8% Ladner $380,400 180.3 -0.1% -5.1% -4.2% 13.5% 25.9% 20.5% 42.5% Maple Ridge $209,100 151.0 0.9% 1.7% 4.4% 22.2% 19.7% 12.9% 8.8% New Westminster $392,400 223.5 1.4% 3.3% 4.5% 21.3% 43.5% 46.7% 59.5% North Vancouver $463,200 188.5 1.7% 2.4% -0.8% 16.1% 33.6% 34.5% 46.6% Pitt Meadows $310,000 183.2 0.1% 0.9% 3.6% 22.2% 23.2% 41.7% 32.0% Port Coquitlam $319,400 189.3 3.9% 5.9% 2.8% 21.2% 41.1% 40.7% 36.2% Port Moody $498,400 207.7 1.0% 5.6% 5.0% 20.7% 50.9% 62.8% 59.3% Richmond $476,000 201.0 3.3% 5.8% 8.1% 20.9% 35.4% 32.9% 53.0% Squamish $369,800 178.1 -0.4% 2.4% 4.3% 24.7% 81.7% 55.8% 49.7% Tsawwassen $403,900 170.3 -0.4% -4.2% -1.8% 17.8% 27.7% 22.2% 34.6% Vancouver East $446,200 246.2 1.7% 1.9% 1.5% 15.9% 43.1% 47.1% 75.0% Vancouver West $688,400 222.8 3.9% 0.3% -0.5% 10.2% 41.4% 45.3% 67.3% West Vancouver $936,000 204.5 2.2% 4.8% 3.2% 22.9% 60.1% 51.7% 55.3% Whistler $406,300 133.2 1.0% 6.1% 8.1% 35.6% 109.8% 68.8% 10.2% HOW TO READ THE TABLE: • Benchmark Price: Estimated sale price of a benchmark property. Benchmarks represent a typical property within each market. • Price Index: Index numbers estimate the percentage change in price on typical and constant quality properties over time. All figures are based on past sales. • x Month/Year Change %: Percentage change of index over a period of x month(s)/year(s) In January 2005, the indexes are set to 100. * Townhome properties are similar to attached properties, a category that was used in the previous MLSLink HPI, but do not included duplexes. Lower Mainland includes areas serviced by both Real Estate Board of Greater Vancouver & Fraser Valley Real Estate Board. The above info is deemed reliable, but is not guaranteed. All dollar amounts in CDN. * MLS®, Multiple Listing Service®, and all related graphics are trademarks of The Canadian Real Estate Association 2 of 14
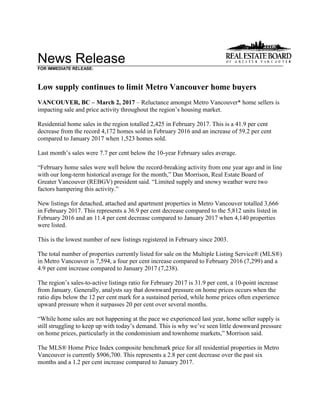
- 5. C:DATAMonthEndHpiexporthi_resgv-hpi2.tifGreaterVancouver 5YearTrend 60 110 160 210 260 310 Feb 2012 Apr 2012 Jun 2012 Aug 2012 Oct 2012 Dec 2012 Feb 2013 Apr 2013 Jun 2013 Aug 2013 Oct 2013 Dec 2013 Feb 2014 Apr 2014 Jun 2014 Aug 2014 Oct 2014 Dec 2014 Feb 2015 Apr 2015 Jun 2015 Aug 2015 Oct 2015 Dec 2015 Feb 2016 Apr 2016 Jun 2016 Aug 2016 Oct 2016 Dec 2016 Feb 2017 Price Index ResidentialDetachedTownhouseApartment Jan2005HPI=100
- 8. Listing & Sales Activity Summary Listings Sales 1 2 3 Col. 2 & 3 5 6 7 Col. 6 & 7 9 10 Col. 9 & 10 Feb Jan Feb Percentage Feb Jan Feb Percentage Dec 2015 - Dec 2016 - Percentage 2016 2017 2017 Variance 2016 2017 2017 Variance Feb 2016 Feb 2017 Variance BURNABY % % % DETACHED 257 178 149 -16.3 150 40 47 17.5 350 129 -63.1 ATTACHED 102 71 74 4.2 78 27 36 33.3 196 90 -54.1 APARTMENTS 281 205 202 -1.5 235 108 137 26.9 626 354 -43.5 COQUITLAM DETACHED 241 115 114 -0.9 177 35 66 88.6 401 148 -63.1 ATTACHED 68 38 33 -13.2 56 19 30 57.9 133 67 -49.6 APARTMENTS 148 123 115 -6.5 136 60 97 61.7 306 219 -28.4 DELTA DETACHED 144 106 67 -36.8 60 19 35 84.2 163 72 -55.8 ATTACHED 10 25 17 -32.0 6 8 23 187.5 14 39 178.6 APARTMENTS 27 26 14 -46.2 20 11 15 36.4 45 36 -20.0 MAPLE RIDGE/PITT MEADOWS DETACHED 247 134 108 -19.4 203 57 79 38.6 426 202 -52.6 ATTACHED 93 62 75 21.0 77 29 52 79.3 163 115 -29.4 APARTMENTS 53 47 73 55.3 48 35 39 11.4 102 102 0.0 NORTH VANCOUVER DETACHED 237 137 136 -0.7 159 34 88 158.8 305 170 -44.3 ATTACHED 76 32 37 15.6 54 13 33 153.8 120 62 -48.3 APARTMENTS 162 126 113 -10.3 129 59 94 59.3 293 226 -22.9 NEW WESTMINSTER DETACHED 69 19 23 21.1 47 11 7 -36.4 93 27 -71.0 ATTACHED 19 17 23 35.3 11 5 14 180.0 32 25 -21.9 APARTMENTS 139 96 99 3.1 101 47 87 85.1 224 202 -9.8 PORT MOODY/BELCARRA DETACHED 68 24 24 0.0 29 8 12 50.0 68 30 -55.9 ATTACHED 25 8 15 87.5 17 13 6 -53.8 41 28 -31.7 APARTMENTS 49 35 43 22.9 34 22 31 40.9 75 75 0.0 PORT COQUITLAM DETACHED 93 44 43 -2.3 80 14 27 92.9 141 64 -54.6 ATTACHED 51 22 32 45.5 32 14 16 14.3 75 40 -46.7 APARTMENTS 84 51 54 5.9 76 31 37 19.4 160 93 -41.9 RICHMOND DETACHED 382 344 190 -44.8 204 55 92 67.3 543 206 -62.1 ATTACHED 97 106 102 -3.8 100 47 69 46.8 266 163 -38.7 APARTMENTS 274 210 207 -1.4 223 123 177 43.9 530 429 -19.1 SUNSHINE COAST DETACHED 103 66 62 -6.1 82 32 44 37.5 180 119 -33.9 ATTACHED 5 10 7 -30.0 10 6 10 66.7 28 19 -32.1 APARTMENTS 17 7 11 57.1 8 7 15 114.3 22 26 18.2 SQUAMISH DETACHED 34 31 35 12.9 27 16 16 0.0 61 39 -36.1 ATTACHED 26 34 23 -32.4 20 11 14 27.3 39 37 -5.1 APARTMENTS 32 14 13 -7.1 17 8 14 75.0 34 38 11.8 VANCOUVER EAST DETACHED 257 219 180 -17.8 167 51 82 60.8 388 196 -49.5 ATTACHED 44 41 60 46.3 36 12 28 133.3 87 65 -25.3 APARTMENTS 206 153 164 7.2 139 75 119 58.7 335 288 -14.0 VANCOUVER WEST DETACHED 412 309 166 -46.3 226 36 93 158.3 493 193 -60.9 ATTACHED 101 73 67 -8.2 75 24 40 66.7 158 87 -44.9 APARTMENTS 684 494 456 -7.7 550 211 369 74.9 1184 817 -31.0 WHISTLER/PEMBERTON DETACHED 26 23 17 -26.1 22 12 18 50.0 47 37 -21.3 ATTACHED 32 26 37 42.3 23 22 27 22.7 74 66 -10.8 APARTMENTS 52 36 33 -8.3 57 15 28 86.7 131 71 -45.8 WEST VANCOUVER/HOWE SOUND DETACHED 241 166 116 -30.1 141 20 35 75.0 295 86 -70.8 ATTACHED 5 10 15 50.0 9 3 6 100.0 20 12 -40.0 APARTMENTS 31 21 18 -14.3 17 13 16 23.1 44 39 -11.4 GRAND TOTALS DETACHED 2811 1915 1430 -25.3 1774 440 741 68.4 3954 1718 -56.6 ATTACHED 754 575 617 7.3 604 253 404 59.7 1446 915 -36.7 APARTMENTS 2239 1644 1615 -1.8 1790 825 1275 54.5 4111 3015 -26.7