SlideShare ist ein Scribd-Unternehmen logo
1 von 32
Downloaden Sie, um offline zu lesen
American Economic Review 2017, 107(8): 2278–2307
https://doi.org/10.1257/aer.20151404
2278
Identifying and Spurring High-Growth Entrepreneurship:
Experimental Evidence from a Business Plan Competition†
By David McKenzie*
Almost all firms in developing countries have fewer than ten work-
ers, with a modal size of one. Are there potential high-growth entre-
preneurs, and can public policy help identify them and facilitate
their growth? A large-scale national business plan competition in
Nigeria provides evidence on these questions. Random assignment
of US$34 million in grants provided each winner with approximately
US$50,000. Surveys tracking applicants over five years show that
winning leads to greater firm entry, more survival, higher profits and
sales, and higher employment, including increases of over 20 per-
centage points in the likelihood of a firm having ten or more workers.
(JEL D22, L11, L26, L53, M13, O14)
The modal firm size in most developing countries is one worker, consisting of
only the owner of the firm. Among the firms that do hire additional workers, most
hire fewer than ten. Hsieh and Olken (2014, p. 93) report that in India and Indonesia
“the fraction of firms with less than 10 workers is almost visually indistinguishable
from 100 percent.” Likewise in Nigeria, survey data indicate that 99.6 percent of
firms have fewer than ten workers.1
This is in sharp contrast to the United States,
where the modal manufacturing firm has 45 workers (Hsieh and Klenow 2014),
and is a puzzle to standard models of the firm size distribution (Lucas 1978) unless
the distribution of entrepreneurial talent is very limited in developing countries.
The move away from self-employment toward wage employment in firms of larger
sizes is a key aspect of the development process (e.g., Gollin 2002). This raises the
key policy questions of whether there are constrained entrepreneurs in developing
1 
Analysis of nonfarm enterprises from the 2012/2013 Living Standards Measurement Study, kindly provided
by Johanne Buba. 
* Development Research Group, the World Bank, MSN MC3-307, 1818 H Street NW, Washington, DC 20433
(email: dmckenzie@worldbank.org). I thank DFID, the World Bank, the WLSME trust fund, and the John
Templeton Foundation for funding this study, Halima Zarma and Yuvraj Pathak for research assistance, Michael
Wong and Anthea Dickie for their work and advice on the operational side of this project, and Muyi Aina and
Olasupo Olusi for their advice on how the program operated in practice. Comments from five anonymous ref-
erees, Lorenzo Casaburi, Giacomo de Giorgi, Antoinette Schoar, and seminar participants at CGD, Columbia,
Georgetown, HBS, HECER, the IPA-SME conference, ITAM, Oxford, the NBER, Stanford, Wharton, the World
Bank, and the Youth Employment Summit in Abuja are greatly appreciated. A pre-analysis plan for this work was
first registered in the J-PAL hypothesis registry on November 14, 2012, and subsequently in the AEA trial reg-
istry (AEA-RCTR-0000078) on September 24, 2013, and in the Registry for International Development Impact
Evaluations (RIDIE) on October 10, 2013 (RIDIE-STUDY-ID-52559be5a72eb). All views expressed are those of
the author and do not necessarily reflect those of the World Bank. 
† 
Go to https://doi.org/10.1257/aer.20151404 to visit the article page for additional materials and author
disclosure statement.
2279McKenzie: Identifying and Spurring EntrepreneurshipVOL. 107 NO. 8
countries with the ability to grow a firm beyond this 10-worker threshold, and if so,
whether policy can identify such individuals in advance and overcome their con-
straints to growth.
I investigate these questions through the context of an evaluation of the impact
of a national business plan competition in Nigeria. The YouWiN! competition was
launched in late 2011 by the president of Nigeria, and in its first year attracted almost
24,000 applications aiming to start a new business or expand an existing one. The
top 6,000 applications were selected for a 4-day business plan training course, and
then winners were chosen to receive awards averaging US$50,000 each, paid out in
four tranche payments conditional on achieving basic milestones. The top-scoring
plans overall and within region were chosen as winners automatically, and then
729 additional winners were randomly selected from a group of 1,841 semifinalists,
providing experimental variation from US$34 million in grants that enables causal
estimation of the program’s impact. Three annual follow-up surveys enable tracking
the trajectory of impacts, with the third survey occurring 27 months after winners
received their first grant payment and 12 to 18 months after the last payment. A final
survey round conducted during an economic crisis in 2016 enables examination of
impacts three years after all payments.
I find that winning this competition has large positive impacts on both applicants
looking to start new firms as well as those aiming to expand existing firms. Three
years after applying, new firm applicant winners were 37 percentage points more
likely than the control group to be operating a business and 23 percentage points
more likely to have a firm with ten or more workers (relative to a control mean of
11 percent), while existing firm winners were 20 percentage points more likely
to have survived, and 21 percentage points more likely to have a firm with ten
or more workers (relative to a control mean of 17 percent). The winners are also
innovating more, and are earning higher sales and profits. There continue to be sig-
nificant impacts more than three years after all payment, during an economic crisis,
although the magnitudes are smaller. Examining the channels of impact, I find the
grants enabled firms to purchase more capital and hire more labor, with no changes
in business networks, mentors, self-efficacy, or uses of other sources of finance.
The results show there is a group of constrained entrepreneurs with the ability to
grow their businesses beyond a small scale, and that the business plan competition
was successful in both attracting such individuals, and in helping them overcome
their constraints.
This paper contributes to three main literatures. The first addresses the sources
and constraints to job growth, which is one of the most fundamental concerns of
policymakers globally. An increasing body of work examines which types of firms
create more jobs, with recent evidence highlighting the importance of business start-
ups and young firms in job creation.2
Related work has found that a small number
of firms, variously termed “gazelles,” “high-growth entrepreneurs,” or “high-impact
firms” represent a tiny fraction of the overall firm population, but make a dispropor-
tionately large contribution to job growth.3
New job creation by firms is of particular
2 
See, for example, Haltiwanger, Jarmin, and Miranda (2013) for the United States, and Ayyagari,
Demirguc-Kunt, and Maksimovic (2014) for evidence from a range of developing countries. 
3 
See reviews by Henrekson and Johannsson (2010) and the OECD (2010). 
2280 THE AMERICAN ECONOMIC REVIEW AUGUST 2017
importance in sub-Saharan Africa given that it currently has the lowest share of the
labor force in wage work of any region in the world, and that demographic forces
result in the working-age population growing 2.8 percent per year (ILO 2012). A
long literature suggests that a perceived lack of high-growth entrepreneurship in
many African countries (e.g., Elkan 1988; Omidyar Network 2013) may be in part
due to multiple market failures that prevent individuals with good ideas from fund-
ing them. This paper provides empirical evidence that there are such potential high
growth entrepreneurs who can grow rapidly if funded.
Business plan competitions are starting to become one popular tool that seeks to
foster high growth entrepreneurship. They seek to identify individuals with prom-
ising ideas and the aspiration to grow, help these individuals formalize these ideas
through getting them to develop a detailed business plan, and then spur the devel-
opment of some of these potentially high growth firms through providing financing
to the winners. While the first such competitions were held for business school stu-
dents in the United States they are now increasingly being used in developing coun-
tries.4
Examples include the MENA 100 business plan ­competition in 14 countries
in the Middle East and North Africa since 2009, the GIST/I-Dare business plan
competition for individuals from 28 developing countries, launched in 2011; and
business plan competitions run by Technoserve throughout Central America since
2002 (Klinger and Schündeln 2011). They are also starting to be used by the World
Bank in several sub-Saharan African countries, including Côte d’Ivoire, Gabon,
Guinea-Bissau, Rwanda, Senegal, Somalia, South Sudan, Tanzania, and Uganda.
However, there is very little evidence as to the effectiveness of these programs.
Many of the programs are small in nature, awarding fewer than ten prizes in any
given year, limiting the sample size for evaluation. Programs explicitly try to select
entrepreneurs with the best growth prospects, so that any comparison of winners and
losers is likely to overstate the effects of the program due to selection bias. Klinger
and Schündeln (2011) and Fafchamps and Quinn (forthcoming) attempt to address
these issues by pooling together competitions run in multiple countries to get larger
sample sizes of winners (although still fewer than 40 cash winners in either study),
and use a regression-discontinuity approach to compare winners to those who just
finished below them in rank. Both studies find impacts on business start-up or expan-
sion, and Fafchamps and Quinn (forthcoming) also find increased job creation in the
first six months. In the one experimental study we are aware of, Fafchamps and
Woodruff (2016) run a small business plan competition in Ghana, in which winners
are selected to receive individualized training, but not cash. They find no significant
impact of this individualized training on firm growth. This paper builds on this lit-
erature through experimental evaluation of a much larger sample, with substantial
prizes, detailed surveys, and a longer time period for tracking winners.
Finally this paper adds to a literature on how to generate entrepreneurship in
developing countries, and in particular the role of capital in alleviating constraints.5
The vast majority of this work has focused on microenterprises, typically with no
4 
Lora Kolodny, “How to Win a Business Plan Competition,” New York Times, June 10, 2009, http://www.
nytimes.com/2009/06/11/business/smallbusiness/11competition.html (accessed March 18, 2014).
5 
The paper also contributes to a related debate in the literature as to whether a lack of capital constrains entre-
preneurs from growing and hiring employees, or whether it is other factors such as labor regulations, management
ability, and the possibility that “transformational” entrepreneurs who aim to create large, vibrant businesses that
2281McKenzie: Identifying and Spurring EntrepreneurshipVOL. 107 NO. 8
employees, with the emphasis on starting such businesses, and/or growing the
incomes of their owners. This is the case with work testing small grants of US$100
to US$200 to existing businesses (e.g., De Mel, McKenzie, and Woodruff 2008;
McKenzie and Woodruff 2008; Fafchamps et al. 2014; Karlan, Knight, and Udry
2015); ultra-poor programs providing grants and training to get very poor people to
start businesses (e.g., Banerjee et al. 2015; Bandiera et al. 2017); and business train-
ing programs for microenterprises (reviewed in McKenzie and Woodruff 2014).
Blattman, Fiala, and Martinez (2014) considers a program in Uganda where groups
received grants of approximately US$382 per member, and finds this generates
increases in skilled self-employment and in incomes for the recipients, but only
minor increases in employment in these firms. Fafchamps and Quinn (forthcoming)
provide grants of US$1,000 to their 39 winners. The grants studied here of almost
US$50,000 per recipient are 50 to 500 times as large as the grants in these earlier
studies.
This difference in size is important for two reasons. First, even a standard concave
production function with a low steady-state optimal size can exhibit high returns to
capital for the first few dollars invested, so the fact that marginal returns from small
grants have been high need not imply that capital is the constraint to growing larger
firms who hire workers. Second, since the lending cost per dollar lent falls with loan
size, credit market frictions are expected to be particularly binding for small loans,
and one therefore might expect credit constraints to be less binding for larger invest-
ments. If credit constraints don’t bind, then theory would predict the grants would
merely supplement the wealth of business owners without changing their production
decisions. Even with credit constraints, there is a question as to whether diminishing
returns to capital results in grants of this size being far more than is needed to move
businesses to their efficient size. The results in this paper show that the business
plan competition is successful in identifying entrepreneurs with the potential to use
these large amounts of capital, and that with this capital, they are able to generate
enterprises that hire employees and exhibit rapid growth.
I.  The Business Plan Competition
The Youth Enterprise With Innovation in Nigeria (YouWiN!) program is a busi-
ness plan competition for young entrepreneurs in Nigeria.6
It is a collaboration
between the Ministry of Finance, the Ministry of Communication Technology,
and the Ministry of Youth Development with support from the Department for
International Development (DFID) and the World Bank. It has the stated objec-
tive of encouraging innovation and job creation through the creation of new busi-
nesses and expansion of existing businesses. It was formally launched on October
11, 2011 by President Goodluck Jonathan in a ceremony aired live over the National
Television network, and advertised through a variety of media events, roadshows,
grow and hire workers are fundamentally different from owners of microenterprises (Schoar 2010). The evidence
here shows that there are individuals for whom capital is the key constraint. 
6 
The business plan competition was run in four consecutive years. My analysis uses the first year of the pro-
gram, which was the only year a randomized experiment was implemented. 
2282 THE AMERICAN ECONOMIC REVIEW AUGUST 2017
and small and medium enterprise (SME) outreach events. Online Appendix 1 details
the timeline of the project.
The program provides a four-day training course on preparation of a business
plan to applicants who make it through a first stage, and then grants to the winning
1,200 submissions, with each winner eligible for an amount up to 10 million naira
(approximately US$64,000), with the amount any winner getting varying between 1
and 10 million naira depending on the funding needs identified in their business plan
and the assessment of independent consultants of what the actual needs are. Winners
also receive ongoing monitoring as the grant is paid in four tranches, coupled with
some potential mentoring and two additional two-day group training events.7
Figure 1 provides a schematic of the different phases of the competition. I sum-
marize the key aspects of these in the text, with additional details provided in online
Appendix 2.
A. Eligibility and the First Stage Application
To be eligible for the program, applicants had to be Nigerian citizens aged 40
or younger, proposing the creation of a new or expansion of an existing business
venture within Nigeria that would employ Nigerians, and which did not involve the
production or distribution of weapons, alcohol, tobacco, or gambling. They then
needed to register on a website and submit an application by November 25, 2011.
This application included basic personal information, proof of age and nationality,
the proposed location of the business, along with information about their business
idea (online Appendix  2 provides further details). Applicants were divided into
six regional pools on the basis of the geopolitical zone in which they wanted to
do business, with training also taking place in these different regional locations.
23,844 applications were received, of which 3,614 (15 percent) were for existing
business expansions and 20,230 were for new businesses. A minority of applicants
were female: 18.5 percent of new business applicants and 14.9 percent of existing
business applicants were female.
B. Application Scoring
Applications were scored by the Enterprise Development Center (EDC) of the
Pan-African University, a sister institution of the Lagos Business School. Names
and other identifying information were removed before scoring to increase the
impartiality of this process. Marks were given for the quality and viability of the
business idea, the amount of job creation likely, the abilities and market understand-
ing of the applicant, and the passion and commitment displayed in the application,
and the likelihood of the proposed business succeeding. This first stage marking was
a rapid assessment (taking approximately ten minutes per plan) given the vast num-
ber of applications and the short window for assessment before training was to start.
There was a conscious decision to favor existing businesses over new ­businesses
7 
A pool of volunteer mentors were available, although as we will see, the winners appear to have received no
more mentoring than the control group. The additional training consisted of two 2-day bootcamps run by the UK
school for start-ups covering cash-flow management, sales, purchasing, and team management. 
2283McKenzie: Identifying and Spurring EntrepreneurshipVOL. 107 NO. 8
throughout the competition given the assumption that they had at least made the first
step of establishing a business. An algorithm was then used to select 6,000 candi-
dates for the business plan training on the basis of location, type of business (new
or existing), and score.
C. Business Plan Training
Business plan training took place between December 6 and December 20, 2011.
Each of the six regions had a local training location. Of the 6,000 individuals selected
to attend training, 4,873 attended (81 percent). The rapid rollout of the program and
short amount of time (1–2 weeks) between notification of selection into the 4-day
training session and it taking place is a likely reason for nonattendance. Biometric
data (iris scans and fingerprints) were collected on all attendees to enable accu-
rate identification of individuals. Candidates who did not attend training were not
Figure 1. Competition Stages and Treatment Assignment
Notes: Regression-discontinuity sample of firms around the cutoff for being chosen for business plan training not
shown. Non-experimental winner sample is only used for matching estimates in online Appendix 5. Survey num-
bers are for having data on firm operation. Online Appendix 8 provides other data on attrition.
First round application
23,844 firms (3,614 existing, 20,230 new)
Top 6,000 chosen for 4-day business plan training with
scoring cutoffs varying by region and new/existing
6,000 firms (1,254 existing, 4,746 new)
4,873 attend training
Submit detailed business plan for scoring
4,510 firms (981 existing, 3,529 new)
Semi-finalists chosen on basis of score, with thresholds varying
by region and new/existing 2,400 firms
(596 existing, 1,804 new)
Non-experimental winners
(selected on highest scores
overall and within region, with
preference for existing)
475 firms
357 existing
118 new
Experimental Sample Dropped if score <30
79 firms
disqualified 5 firms
(randomly selected within
strata defined by region, gender,
and new/existing)
1,841 firms (541 existing, 1,300 new)
729 treatment (278 existing, 451 new)
1,112 control (263 existing, 849 new)
Follow-up surveys
Follow-up 1: 396 firms
Follow-up 2: 439 firms
Follow-up 3: 417 firms
Follow-up surveys
Follow-up 1: 617 treat, 836 control
Follow-up 2: 645 treat, 917 control
Follow-up 3: 674 treat, 1011 control
2284 THE AMERICAN ECONOMIC REVIEW AUGUST 2017
­eligible to submit a business plan. Online Appendix 2 provides detail on the content
of the course.
D. Business Plan Submission and Business Plan Scoring
Applicants who had attended the training had until January 22, 2012 to sub-
mit the business plan. The business plan required much more detail than the first
round ­concept note. In total 4,510 business plan applications were received, which
is 92.5 percent of those who attended the training. The business plans were then
scored by a joint EDC/PricewaterhouseCoopers team, with a team of 20 markers
split evenly between the two organizations. Marking criteria were developed which
focused on the market, management skills, business experience, articulating the
risks and financing needs of the business, and job creation and cash flow prospects.
A typical plan took 30–45 minutes to mark.
E. Selection of Winners
The business plans were narrowed down to 2,400 semifinalists by first selecting
the highest scoring 450 existing businesses and highest scoring 150 new businesses
nationwide, and then selecting the top scoring 300 plans per region after taking out
these national top scores. Then from these 2,400 semifinalists, the following groups
of winners were selected:
•	 300 National Merit Winners: The 225 top-scoring existing business plans and
75 top-scoring new business plans nationwide were selected as national win-
ners. This was done to ensure the highest-scoring proposals on pure merit were
selected.
•	 180 Zonal Merit Winners (30 per region):After removing the 300 national merit
winners, the highest-scoring 45 existing business plans and 15 new business
plans per zone were selected as zonal finalists. Their proposals were reviewed
by panelists of local entrepreneurs and local business leaders in each zone, who
identified the best 30 out of the 60 zonal finalists to be zonal merit award win-
ners. The zonal finalists who were not selected were then placed back into the
pool and were eligible to be selected as ordinary merit winners.
•	 720 Ordinary Merit Winners (120 per region): 120 ordinary winners per region
were randomly selected from among the remaining 1,920 semifinalists using
the lottery procedure described below.
F. Randomization Algorithm
Random selection of the ordinary winners was done for two main reasons. First,
from an operational point of view, a competition run at this scale is not feasible
to do with presentations in front of judges, and it was recognized that there would
be inherent uncertainty in the scoring as to which applicants were best amongst
the semifinalists. Moreover, in many developing countries there are concerns
that programs get captured by individuals with certain political or ethnic ties,
and it was felt randomizing gives people a fair chance and is less subject to this
2285McKenzie: Identifying and Spurring EntrepreneurshipVOL. 107 NO. 8
­perception risk.8
Second, random assignment enabled rigorous measurement of
the program’s impacts.
The randomization procedure was designed as follows. First, among the semifi-
nalists, all those with business plan total scores below 30 were dropped, to ­maintain
a minimum standard. This reduced the pool from 1,920 to 1,841 firms. Then a
two-step stratified randomization was conducted by the author in STATA to choose
the ordinary winners:
	 (i)	 First, within each region, half of the existing firm business plans were ran-
domly chosen to be ordinary winners, with this selection stratified by gender.
This reflected the preference of the government to again oversample existing
business plans.
	 (ii)	 Then, the number of slots for new firm business plans was calculated per
zone as 120 minus the number of existing business ordinary winners. This
was subdivided into a number of slots for new businesses operated by men
and new businesses operated by women in proportion to the share of women
among new businesses in the pool in each region. Then the number of new
firms dictated by the number of remaining slots was randomly chosen from
the number of new firm semifinalists in each region and gender strata.
This gives an ordinary winner treatment group of 720 firms and an ordinary win-
ner control group of 1,121 firms. After quality checking which disqualified some
winners, and redrawing of replacements (see online Appendix 2), of the 1,841 firms
in the ordinary winner pool, we have a treatment group of 729 randomly assigned
to treatment (of which 13 were disqualified). The control group consists of the
1,112 firms randomly assigned to the control group (after the random replacement),
of which 9 were nonrandomly selected to actually receive treatment. In terms of the
impact evaluation, this will be handled through assignment to treat analysis.
G. Award Amounts and Payment
The amounts awarded were payable in four tranche payments. The first pay-
ment was typically around 10 percent of the total amount, with a second tranche
payment averaging 45 percent of the total then payable for the purpose of physi-
cal capital acquisition and working capital. The third and four tranche payments
were made conditional on employment and sales turnover triggers that were set
individually for each firm based on their business plan projections. These triggers
were deliberately set to be quite low, and were intended to ensure the business was
set up and producing. The third tranche payment required sales turnover to have
reached 25 percent of the first-year target annualized turnover set out in the business
plan, with ­firm-specific employment triggers that averaged 3.7 workers. The fourth
tranche payment required sales turnover to have reached 40 percent of the ­first-year
8 
However, the fact that the ordinary winners were randomly chosen from amongst semifinalists was not
announced to applicants; but rather was information that could be used in case of a complaint. 
2286 THE AMERICAN ECONOMIC REVIEW AUGUST 2017
annualized turnover goal, with firm-specific employment triggers that averaged
5.5 workers.
Online Appendix 3 summarizes the award amounts received by the winners. The
mean (median) winner received a total award of US$49,000 (US$57,000). Only 6
of the 1,200 winners received no payment (due to being disqualified, or in one case,
withdrawing). A total of 1,168 winners (97.3 percent), including 96.8 percent of
the experimental winners, received all four tranche payments, but the length of time
taken to receive all four tranches varied across firms: 748 of the firms received their
last tranche payment in June or July 2013, while the last 33 recipients got their last
tranche in January 2014.
II.  Verification of Random Assignment and Data Collection
A. Verification of Randomization and Characteristics of Winning Firms
Table 1 presents summary statistics for the treatment and control groups accord-
ing to assignment to treatment status for new and existing firms, as well as the
characteristics of the non-experimental winners. The goal of the randomization is
to ensure that the treatment and control groups are similar in terms of average char-
acteristics. This is tested formally through an F-test of joint orthogonality, which
tests whether the observable characteristics in Table 1 are jointly unrelated to treat-
ment status. We cannot reject this null hypothesis, confirming that randomization
has delivered balanced groups. In contrast the test rejects that the observable char-
acteristics of the national and zonal winners are similar to those of the experimental
sample, even when excluding the business plan scores used to separate the groups.
Table 1 is also useful for showing some basic characteristics of the experimen-
tal sample. We see the average existing firm owner is male, aged 32, with 4 years
of business experience and running a business with a median of 5 workers. Half
are married, and 10 percent have previously worked or lived abroad, and 65 per-
cent have university education. Only 7 percent have ever had a formal loan before
for their business. New applicants are slightly younger, with an average age of 29,
70 percent have university education, and they have higher business plan scores
than the existing firm applicants on average, reflecting the preference for existing
firm applicants at each stage. We see they come from relatively well-off households,
with 85 percent having a computer at home and two-thirds having a satellite dish.
The most common business sectors are manufacturing and crop and animal produc-
tion, sector is looked at in more detail below. The mean (median) annual turnover
for existing businesses in the experimental sample is 5.6 million naira (1.5 million
naira). The maximum grant of 10 million naira thus represents two years of turnover
for the mean firm and more than six years for the median firm.
Online Appendix 4 summarizes the main sectors that YouWiN! winners propose
to operate their businesses in, based on the self-classification of applicants at the
time of submitting their business plans. Agricultural production activities is the
largest sector, accounting for one-third of winning new business applications and
20 percent of existing business applications. Typical examples include plans to set
up or expand poultry or catfish farms, and production of cashews, palm oil, and
cassava. The second most common sector for existing firms is IT and computer
2287McKenzie: Identifying and Spurring EntrepreneurshipVOL. 107 NO. 8
­services, comprising 17 percent of existing firm winners, but only 7 percent of new
firm winners. Typical examples include software and website development, repairs
and installation, and computer training courses. Manufacturing is the second most
common sector for new firms, comprising 13 percent, and third most common for
existing firms, comprising 14 percent of winners. The products being manufactured
are very heterogeneous, and include processed food products, books and media,
metal products, chemicals and detergents, and a range of other products. Other
industries includes a variety of different activities such as advertising, teaching,
event ­management, photography, and filmmaking, as well as some activities that
were a mix of other categories.
B. Data Collection
The follow-up surveys targeted the 729 individuals selected as ordinary win-
ners of the competition (the experimental treatment group), the 1,112 individu-
als in the experimental control group, as well as also surveying the 475 national
Table 1—Baseline Characteristics and Balance of Experimental Sample
Existing firms New firms
Non-
experimental
winners
Treatment
group
Control
group
Non-
experimental
winners
Treatment
group
Control
group
Applicant characteristics
Female 0.17 0.18 0.17 0.19 0.17 0.18
Age 32.5 32.0 31.8 30.1 29.3 29.6
Married 0.60 0.50 0.56 0.42 0.34 0.36
High school or lower 0.10 0.13 0.12 0.06 0.11 0.10
University education 0.71 0.63 0.67 0.79 0.69 0.71
Postgraduate education 0.12 0.08 0.12 0.13 0.05 0.06
Lived abroad 0.14 0.10 0.11 0.18 0.06 0.09
Choose risky option 0.59 0.56 0.52 0.63 0.57 0.55
Have internet access at home 0.68 0.57 0.61 0.60 0.47 0.48
Own a computer 0.94 0.87 0.88 0.92 0.84 0.86
Satellite dish at home 0.74 0.67 0.71 0.64 0.68 0.64
Freezer at home 0.64 0.57 0.61 0.63 0.51 0.55
Business characteristics
Crop and animal sector 0.14 0.16 0.16 0.22 0.22 0.22
Manufacturing sector 0.28 0.28 0.26 0.23 0.28 0.24
Trade sector 0.05 0.06 0.05 0.06 0.04 0.04
IT sector 0.14 0.15 0.14 0.04 0.07 0.06
First round application score 59.0 57.2 56.6 59.9 59.9 59.9
Business plan score 61.7 45.8 45.4 74.4 53.7 55.5
Number of workers 9.11 7.35 7.73
Ever had formal loan 0.11 0.06 0.09
Sample size 357 278 263 118 451 849
Joint orthogonality test: treatment
  versus control
0.920 0.884
Joint orthogonality test: non-experimental
  versus treatment
0.000 0.000
Joint orthogonality test: non-experimental
  versus treatment (no score)
0.012 0.000
Notes: p-values shown for joint orthogonality tests. Test for comparison of treatment and control conditions on
regional strata. Existing firms and new firms refer to status at time of application. (no score) indicates the joint
orthogonality test is conducted excluding the first round application score and business plan score.
2288 THE AMERICAN ECONOMIC REVIEW AUGUST 2017
and zonal winners (excluding the 5 disqualified), and a sample of 823 applicants
who had scores just on either side of the cutoff used to select people to attend the
4-day ­business training course. These latter two groups are used for propensity
score matching analysis of the impact of the program on non-experimental win-
ners (online Appendix 5), and regression-discontinuity analysis of the impact of the
business plan training alone (online Appendix 6).
Three annual follow-up surveys were taken, followed by a fourth, longer-term
follow-up which is discussed in Section VI. Surveys took place nationwide via
face-to-face interviews, supplemented by telephone interviews and web interviews
when security concerns prevented travel, and to boost response rates. Surveys were
conducted by TNS RMS Nigeria. In addition, an attempt was made through proxy
interviews and two question interviews with refusals to ascertain whether individu-
als who could not be contacted or had refused were currently operating a business,
and if so, the number of employees they had. Online Appendix 7 discusses the
survey methodology in more detail and shows robustness of results to controls for
survey type.
The first follow-up survey took place between November 2012 and May 2013.
This corresponds to approximately one year after individuals had first applied to
the program, 8 months or more after the winners had been announced, and an aver-
age of 5 to 6 months since the winners received their first tranche payment. The
median firm had received 4,000,000 naira ($US25,000) by the time of this survey.
The response rate for the experimental sample was 75.6 percent (81.2 percent for
treatment, 71.9 percent control).
The second follow-up survey took place between October 2013 and February
2014, approximately two years after application and just as firms had received their
last tranche payments. This was an even more intensive effort in data collection,
and achieved an 88.9 percent response rate (91.5 percent for treatment, 87.2 per-
cent for control).9
The third follow-up survey took place between September 2014
and February 2015. This corresponds to 3 years after application, and between 12
and 18 months after firms had received their last tranche payment from the pro-
gram. The response rate was 83.1 percent (87.0 percent for treatment, 80.5 percent
for control).
Online Appendix 8 reports further breakdowns on attrition by applicant type
and treatment status. It then examines robustness to attrition in several ways. First,
it shows that the responding sample remains balanced on baseline observable
characteristics. Then it shows robustness to three different bounding approaches,
to controlling for the application and business plan score, and to filling in missing
data based on past operating status. The main results are robust to all but the worst
case bounds, and even these bounds, which assume that all attritting control firms
would be operating and all attritting treated firms would be closed, still show
a positive treatment impact on business operation and on having more than ten
employees.
9 
Moreover, some of those not interviewed in round 2 were interviewed in round 1, so there are only 4 percent
of the experimental sample for which we have no follow-up data in either of the first two rounds. 
2289McKenzie: Identifying and Spurring EntrepreneurshipVOL. 107 NO. 8
III.  Measuring the Impact of the Business Plan Competition:
Theory and Empirical Approach
The main objective of theYouWiN! program was to generate jobs by encouraging
and supporting aspiring entrepreneurial youth in Nigeria to develop and execute
business ideas. I discuss first what theory suggests the likely impacts of the program
will be, and then the empirical approach to measuring these impacts. Both the theory
and empirical approach set out here were prespecified in advance through a regis-
tered pre-analysis plan.10
A. Theory: How Might Participating in the YouWiN! Program Lead
to More Jobs and Higher Profits?
I consider a simple partial equilibrium model that provides a framework for
understanding how the YouWiN! program might affect the performance of individ-
ual firms. This model is intended as a vehicle for organizing thoughts, rather than
a fully specified model to calibrate. In complementary work, Buera, Kaboski, and
Shin (2014, 2016) specify and calibrate macro models of occupational choice and
entrepreneurship which they use to attempt to explain the impacts of different asset
grant interventions (including this paper). Their results point to the importance of
heterogeneity in talent, and financial frictions, but they are unable to explain the
sustained increases in income seen amongst grants to microenterprises, nor changes
in the size distribution of firms.
Consider a simple model where a firm’s production Y is a function f ( · ) of their
productivity A, their capital stock K, the owner’s entrepreneurial skill E, and outside
labor L.11
The firm owner’s problem is to choose K and L given A and E:12
(1)	 ​Y = f ​(A, K, E, L)​​.
With complete markets the firm production decision will be separable from the
household consumption decision and firms will choose capital and labor such that
their marginal products are equal to the market interest rate and market wage rate,
respectively,
(2)	 ​​f ​K​​​(A, ​K​​ ∗
​, E, ​L​​ ∗
​)​  =  r​,
(3)	 ​​f​   L​​​(A, ​K​​ ∗
​, E, ​L​​ ∗
​)​  =  w​.
10 
See https://www.socialscienceregistry.org/docs/analysisplan/25/document.
11 
This model focuses on the implications for firm size, conditional on running a firm. For a model of the firm
entry decision, see the online Appendix of Blattman, Fiala, and Martinez (2014). Similar to the model here, they
note that an unrestricted grant will have no effect on the entry decision, and there is no permanent impact of a con-
ditional grant on occupational choice without credit constraints. 
12 
In this simple model A, E, and f ( · ) are exogenous. However, some components of these can be chosen by
firms by purchasing new technologies, hiring consultants to implement new processes, etc. For the purposes of this
simple model, I consider these part of the choice of capital stock, and then the implications of the model are similar
for these. 
2290 THE AMERICAN ECONOMIC REVIEW AUGUST 2017
In such a model, firm size is then completely determined by the talents of the firm
owner, as in the seminal model of Lucas (1978). The answer in this simple model to
the puzzle of why there are so many one-person firms in developing countries and
so few larger firms (Hsieh and Olken 2014) is then that single person enterprises are
the optimal scale given the talent of most of those engaging in entrepreneurship in
these countries. I then examine the predictions of such a model for how YouWiN!
should affect the production and firm size of winners.
Case 1 (Perfect Markets, YouWiN! Program Is Just a Grant): If firms are not
credit-constrained and the program just changes the resources firm owners have
available to them, then there is no change in the first-order conditions (2) and (3),
and so no change in employment or output. The grant will merely make the owner
richer, but not change their production decisions. This possibility is often a key
concern of policymakers in any grants program, and is referred to as a lack of addi-
tionality, with the program just funding activities firms were going to do anyway.
Case 2 (Perfect Markets, YouWiN! Program Is a Conditional Grant): The
YouWiN! program does not make a single lump sum grant to firm owners, but instead
is payable in tranches, conditional on the firm owner taking certain actions—with
the first and second tranches typically paying for more working capital and invest-
ment, and the third and fourth tranches being triggered by reaching jobs and turn-
over triggers. This conditionality does not fundamentally change the equilibrium
first-order conditions, but can be viewed as causing a temporary increase in the
returns to capital and labor in the firm. Therefore we would predict a short-term
increase in capital and labor, which would then dissipate once all the tranche pay-
ments have been received. Once the final payments are received, we should see no
difference between treatment and control firms as the treated firms reduce capital
and labor to get back to the equilibrium levels.13
Case 3 (YouWiN! Program is More Than Just a Grant): It is possible that par-
ticipating in, and especially winning, the YouWiN! program may also have other
impacts on the productivity of the firm (A), and the skills of the owner (E ). The
training offered could increase the entrepreneurial skills of the owner, although
since the business plan training was also provided to the control group, this should
change the ­first-order conditions similarly for both groups, and it would only be if
the small amount of additional training increased skills that we should see a treat-
ment effect. If winning enables firm owners to meet other business owners or gain
mentors, this could increase A and E. Winning might also change the confidence
and attitudes, spurring the self-belief of the owner in the business and causing them
to work harder; or alternatively, may dent the confidence of the control group. If
13 
An exception to this prediction will occur if there is a flypaper effect, as in Fafchamps et al. (2014). In this
case, firm owners may have suboptimally low levels of capital invested in their business as a result of self-control
problems or external pressure, and the program may overcome these issues by directing capital into mental accounts
for business use. In this case, there may be a long-term level effect on capital and profits. 
2291McKenzie: Identifying and Spurring EntrepreneurshipVOL. 107 NO. 8
­individuals invest on the basis of their beliefs about their talent (as in Jovanovic
1982) rather than actual talent, this will change the first-order conditions.
Case 4 (YouWiN! Program with Capital and Labor Market Constraints): If firms
are credit-constrained, then they invest less in their firms than optimal according to
(2). Winning the YouWiN! program could reduce credit constraints in three ways:
	 (i)	 Directly by providing a grant to the firm;
	 (ii)	 Indirectly, through providing a signal of quality that leads to more bank lend-
ing and
	 (iii)	 Indirectly, through providing co-financing and a signal of quality that leads to
more outside investments from partners.
The impact of these channels will be to increase capital stock. This may increase
or decrease labor depending on the shape of the production function—a heavily
credit-constrained firm may have previously substituted capital for labor, and so
reduces workers once it can buy machines to replace them. Conversely, if capital and
labor are complements in production, more capital will enable the firm to hire more
workers. Profits should increase in either case.
This simple model offers a lens through which to interpret the results of the exper-
iment, and highlights key mechanisms to examine in understanding these results. If
either markets are complete, or the competition is not very good at identifying a
group of high-ability entrepreneurs who are constrained, then we should expect no
impact of the program unless it succeeds in increasing A and E for participants. In
contrast, if capital constraints are important and the competition is able to attract
entrepreneurs of sufficient ability, it should induce larger firm sizes for those who
win.
B. Experimental Estimation
The main approach used for evaluating the impact of the program is to use the
randomized controlled trial (RCT) based on the random selection of ordinary win-
ners from among the semifinalists. This is done separately for the new and existing
business applicants, and involves regressions of the following form:
(4)	 ​Outcom​e​ i​​  =  a + b × AssignTrea​t​ i​​  +  c × Region × Gende​r​ i​​  + ​ε​i​​.​
Here AssignTreat denotes whether or not applicant i was randomly cho-
sen as an ordinary winner from among the semifinalist experimental pool, and
region × gender controls for the randomization strata. Robust (Huber-White)
standard errors are used. The coefficient b then gives the average effect of being
assigned to receive a grant, the ITT estimate of the program’s impact for firms in
the experimental sample. Recall that 13 of the 729 winners were disqualified and
so did not receive a grant, while 9 of the 1,112 control firms were nonrandomly
selected to replace them. Since these compliance rates with treatment are so high,
2292 THE AMERICAN ECONOMIC REVIEW AUGUST 2017
the local average treatment effects of actually receiving the grant are similar to the
­intent-to-treat effects, and so we report just the ITTs. In order to estimate the trajec-
tory of impacts, I estimate the treatment effects separately by year.
IV.  Results of the Impacts of the Business Plan Competition
The business plan competition had the stated objective of encouraging innovation
and job creation through the creation of new businesses and expansion of existing
businesses. I examine its success in achieving these outcomes by considering the
impact on start-up and survival, the impact on innovation and employment, and then
also examine how this translates into profitability and sales.
Online Appendix 9 provides details on how key outcomes were measured. My
main approach to deal with multiple hypothesis testing is to group the outcomes
into domains or families, and then examine the impact on a natural aggregate
(e.g., total employment, total capital stock) or standardized index measure (e.g.,
index of standardized z-scores for profit and sales outcomes) within each domain.
In online Appendix 10, I also provide sharpened q-values that hold constant the
false discovery rate when reporting results for specific outcomes—all outcomes in
Tables 2–8 that have p-values below 0.10 also have sharpened q-values below 0.05.
A. Impacts on Start-Up and Survival
Table 2 examines the impact of the competition on whether applicants for new
enterprises set up a business and have it subsequently survive (panelA), and whether
applicants with existing enterprises have these businesses survive (panel B). The
first three columns show the extensive margin of whether a firm operates or not,
while the remaining three columns combine the extensive and intensive margins to
consider how many hours a week the owner works in his or her own firm. Consider
first the impacts on new enterprises. Fifty-five percent of those in the control group
were operating a business at the time of the first follow-up survey, and 56.9 percent
Table 2—Impact on Start-Up and Survival
Operates a firm at time of survey
Weekly hours worked in
self-employment
Round 1 Round 2 Round 3 Round 1 Round 2 Round 3
Panel A. New firms
Experimental treatment effect 0.215 0.359 0.373 13.538 21.699 19.526
(0.029) (0.023) (0.024) (1.961) (1.704) (1.748)
Sample size 1,021 1,181 1,085 993 1,071 927
Control mean 0.550 0.569 0.540 24.9 23.9 19.4
Panel B. Existing firms
Experimental treatment effect 0.083 0.130 0.195 9.058 8.643 11.687
(0.027) (0.025) (0.031) (2.653) (2.552) (2.492)
Sample size 432 505 477 423 458 409
Control mean 0.871 0.844 0.759 43.3 40.9 31.6
Notes: Robust standard errors in parentheses. Existing and new refers to firm status at time of application. Rounds 1,
2, and 3 are 1, 2, and 3 years after application. Regressions control for randomization strata.
2293McKenzie: Identifying and Spurring EntrepreneurshipVOL. 107 NO. 8
at the time of the second follow-up survey, and 54 percent in the last survey. The
experimental estimate of the impact is 21.3 percentage points at the time of the first
survey, 35.8 percentage points by the second survey, and 37.3 percentage points
by the third survey. These effects are also large, positive, and strongly statistically
significant ( p < 0.000001). By the second and third follow-ups, the new applicant
winners are spending twice as many hours a week working in self-employment than
the control group.
Panel B shows that winning also increases the survival rates of existing firm own-
ers. Eighty-seven percent of the control firms survived 1 year, 84.4 percent two
years, and 75.9 percent three years. Winners had 8 percentage point higher survival
rates in the first year, 13 percentage point higher survival rates in the second year,
and 20 percentage point higher survival rates in the third year, with these results
again strongly statistically significant. Winners are spending almost 12 more hours
per week working in self-employment than the control group after 3 years.
B. Impacts on Employment
Generating employment was one of the main goals of the program. Our main
measures of employment come from survey reports. The surveys asked detailed
questions on employment in different categories, and questions on the most recent
workers hired. Online Appendix 11 compares these reports to administrative data on
the winners that came from program reports at around the same time as the second
­survey. The employment reported to the program is larger than that reported to our
surveys in the majority of cases, and appears that the administrative data suffers
from over-reporting biases. In contrast, comparison of our survey measures with
physical observation where available suggests more confidence in the survey mea-
sures. I also return to this issue in further robustness checks in Section VII.
Table 3 reports the impact of winning on key employment outcomes, while
Figure 2 shows quantile treatment effect estimates of the impact on total employ-
ment in round 3. These are unconditional estimates, which code employment as zero
for individuals not operating firms. Online Appendix 11 shows the descriptive com-
parison that treated firms are also hiring more workers than the control conditional
on being in operation.
The first column of Table 3 shows a positive impact on the employment status
of the owner. The difference between these estimates and the impacts on start-up
and survival in Table 2 reflects that some individuals would have been employed
as wage workers had they not started or continued with their firms. Column 2 then
considers total employment in the firm, which is the sum of the owner’s employment
in the firm, the number of wage and salary workers, and the number of daily and
casual workers in the firm. The average control group firm among new applicants
has 3.7 workers by the time of the third survey, with the treatment effect of 5.2 work-
ers more than doubling this average. The average control group firm among existing
firm applicants has 5.6 workers by the time of the third survey, with the treatment
effect of 4.4 workers representing an 80 percent increase. Impacts are larger in the
second and third years once all the grants had been received than in the first year.
The quantile treatment effect regressions show positive and significant effects across
most of the distribution, with the effect size similar in magnitude to the regression
2294 THE AMERICAN ECONOMIC REVIEW AUGUST 2017
estimates between the thirtieth and ninetieth percentiles for new firms and the twen-
tieth and ninetieth percentiles for existing firms. Online Appendix 11 shows these
increases in employment come from both more wage and salary workers, and from
more casual and daily workers, with little change in unpaid workers.
Our survey data asks more detailed questions on the three most recently hired
workers each year. Only 5 percent of these are related to the owner, 33 percent
are female, 45 percent have post-secondary education, and their average wage is
22,400 naira/month (approximately US$143). The third-round survey also asked
what these workers were doing before getting hired. Only 36 percent were working
in another job, with the rest either unemployed or students.
Column 3 examines the extent to which winning the competition has enabled
firms to surpass the ten worker threshold.14
Amongst new firm applicants, we see
that only 11 percent of the control group had reached this size three years after
14 
Note this variable was not included in the pre-analysis plan. It was motivated by the definition of ten workers
as a cutoff between micro and small businesses in many countries, and by the work of Hsieh and Olken (2014)
noting this threshold as one that few firms in developing countries exceed. The results would be similar if we instead
chose another binary threshold under 15 or 20 workers. 
Table 3—Impact on Employment and Innovation
Own
employment
Total
employment
Firm of 10+
workers
Firm of 25+
workers
Innovation
index
Panel A. New firms
First follow-up 0.074 1.426 0.024 0.007 0.099
(0.025) (0.732) (0.020) (0.008) (0.019)
Second follow-up 0.128 6.012 0.288 0.022 0.270
(0.017) (0.412) (0.026) (0.009) (0.018)
Third follow-up 0.119 5.227 0.229 0.025 0.219
(0.018) (0.469) (0.028) (0.011) (0.019)
Control mean: first follow-up 0.787 3.618 0.083 0.010 0.225
Control mean: second follow-up 0.841 3.305 0.088 0.009 0.214
Control mean: third follow-up 0.831 3.773 0.114 0.014 0.181
Sample size: first follow-up 1,021 987 987 987 995
Sample size: second follow-up 1,181 1,159 1,159 1,159 1,071
Sample size: third follow-up 1,085 1,044 1,044 1,044 927
Panel B. Existing firms
First follow-up 0.047 1.512 0.057 0.007 0.105
(0.019) (0.795) (0.041) (0.019) (0.029)
Second follow-up 0.066 2.556 0.215 0.009 0.126
(0.018) (1.388) (0.041) (0.018) (0.028)
Third follow-up 0.070 4.425 0.208 0.028 0.141
(0.022) (0.673) (0.040) (0.015) (0.029)
Control mean: first follow-up 0.938 6.852 0.212 0.032 0.390
Control mean: second follow-up 0.922 8.134 0.231 0.038 0.407
Control mean: third follow-up 0.906 5.571 0.170 0.014 0.341
Sample size: first follow-up 432 422 422 422 423
Sample size: second follow-up 505 500 500 500 458
Sample size: third follow-up 477 461 461 461 409
Notes: Robust standard errors in parentheses. Regressions control for randomization strata. Existing and new refers
to firm status at time of application. Rounds 1, 2, and 3 are 1, 2, and 3 years after application. Innovation index is
an index of standardized z-scores of 12 different measures of innovative activity.
2295McKenzie: Identifying and Spurring EntrepreneurshipVOL. 107 NO. 8
applying, with treatment increasing this by 22.9 percentage points. Among existing
firms, 17 percent of the control group were at this size after three years, with the
treatment taking a further 20.6 percent to this level. Few firms have grown to the size
of having 25 workers, but columns 4 and 8 of Table 3 show that by the third round
the treatment has had a statistically significant 2.5–2.7 percentage point increase in
this likelihood, relative to a control mean of only 1.4 percent.
In online Appendix 11, I combine the estimates of the total employment effects
per firm with the number of winning firms to generate an estimate of the overall
difference in employment created between the winners and the control group. The
experimental treated firms report a total of 6,858 workers employed at the time of the
round 3 survey, of which I estimate that 3,579 are the program impact (95 percent CI
is 3,061, 4,161), whereas the remaining workers would have been employed anyway.
Adding in the propensity-score matching estimates for the impact on the national and
zonal winners then gives a total of 7,027 jobs created from all winning firms.
C. Cost Effectiveness for Employment Generation
The first round gave the winners 9,240 million naira (US$58 million) in grants.
The cost of administering the first round of programs, including scoring the applica-
tions, running the 4-day business plan training, and administering the tranche pay-
ments, is estimated at $2 million. At the end of the third year, the estimate from
onlineAppendix 11 is that 7,027 jobs were directly generated in the treated firms as a
result of the program. Thus the cost per job created in the winning firms is US$8,538
(or $9,600 for just the firms in the experimental sample). Online Appendix 12 dis-
cusses the additional assumptions needed for this to represent net job creation for
Figure 2. Quantile Treatment Effects on Total Employment in Round 3
Notes: New firms and existing firms refer to status at time of application. Round 3 is 3 years after application and
12–18 months after all grants have been received.
−5
0
5
10
15
Totalemployment
−5
0
5
10
15
Totalemployment
510 20 30 40 50 60 70 80 90 95 510 20 30 40 50 60 70 80 90 95
Percentile
OLS
Quantile treatment
95% CI
Panel A. New firms
Percentile
Panel B. Existing firms
2296 THE AMERICAN ECONOMIC REVIEW AUGUST 2017
the economy as a whole, and compares this cost to other job creation policy efforts
in developing countries.
D. Impact on Innovation
The other stated objective of the program was to encourage innovation. I measure
12 different types of innovative activities and aggregate these into an index. The last
column of Table 3 shows that winners are also innovating more. By the final survey
round there is a 22 percentage point increase in innovative activities for experimen-
tal winners among new firms, and 14 percentage point increase for existing firms.
Online Appendix 13 shows that the new applicants are innovating more in multiple
dimensions, introducing new products, processes, pricing methods, quality control
systems, using the internet, and using new channels for selling goods. As is standard
in developing countries, most of this innovation involves moving toward the world
frontier by introducing new products or processes that are new for the firm and often
its city or neighborhood, but that are available elsewhere in the country or in the
world. As such, they are similar to capital inputs, for which the alleviation of credit
constraints allows more of these innovation inputs to be purchased.
E. Impacts on Profits and Sales
Table 4 reports the treatment impact on several measures of sales and profitabil-
ity, and Figure 3 shows quantile treatment effects on profits. The quantile treatment
effects for the last survey round show positive and significant impacts on firm profits
for all quantiles between the twentieth and the eighty-fourth for new firm appli-
cants, and for all quantiles between the twelfth and the seventy-sixth for existing
firm applicants. However, there is zero effect at the bottom of the distribution (since
profits are zero for firms that don’t operate), and very wide standard errors for the
top quantiles (reflecting a long upper tail). This results in low statistical power for
looking at impacts on the levels of profits.
I use three prespecified approaches to deal with these issues, and in online
Appendix 14 also examine robustness to several alternative approaches. The first
­prespecified approach was to truncate monthly profits and sales at the ninety-ninth
percentile to reduce the influence of outliers. This transform still leaves a very dis-
persed long tail, and a standard deviation of profits that is two to three times the
mean, resulting in low power. The second alternative prespecified approach was to
consider the inverse hyperbolic sine transformation of profits, which is similar to a
log transformation, but allows for zeros and negative values. Third, I use an overall
index of standardized z-scores which considers multiple profit and sales measures,15
with this latter measure also providing a summary measure to account for multiple
hypothesis testing.
15 
These include other measures like asking for annual sales, whether sales were higher than one year ago, and
profits in the best month. In the first two rounds we also asked for the number of customers and details of sales of
the main product. Firms found these questions difficult to answer, and they were dropped for the third survey round
and are not included in the aggregate index here (but are reported in online Appendix 14). 
2297McKenzie: Identifying and Spurring EntrepreneurshipVOL. 107 NO. 8
The first four columns of Table 5 show the impact for new firms. In the first year
the impact on the inverse hyperbolic sine of profits is positive and significant, but the
impact on the other measures is not statistically significant. The impacts are larger
in the second and third year follow-ups and both the inverse hyperbolic sine and
Table 4—Impacts on Business Sales and Profits
New firms Existing firms
Truncated
sales
Truncated
profits
Inverse
hyperbolic
sine
profits
Aggregate
index of
sales and
profits
Truncated
sales
Truncated
profits
Inverse
hyperbolic
sine
profits
Aggregate
index of
sales and
profits
Experimental impacts
First follow-up 36.160 −24.512 2.156 0.016 50.805 0.074 0.972 0.080
(49.884) (26.330) (0.369) (0.047) (85.662) (49.416) (0.373) (0.070)
Second follow-up 297.783 69.061 4.154 0.298 346.304 69.234 2.183 0.237
(56.494) (15.150) (0.326) (0.036) (134.728) (35.420) (0.401) (0.060)
Third follow-up 64.541 20.137 3.962 0.167 349.228 32.035 2.580 0.211
(92.338) (21.635) (0.346) (0.042) (143.729) (40.956) (0.464) (0.070)
Control mean: first follow-up 271.467 167.705 6.583 −0.005 509.699 257.025 10.772 −0.045
Control mean: second follow-up 278.177 91.061 6.161 −0.096 660.535 206.305 9.646 −0.117
Control mean: third follow-up 438.490 114.099 5.775 −0.050 509.975 192.151 8.565 −0.108
Sample size: first follow-up 995 995 995 995 423 423 423 423
Sample size: second follow-up 1,151 1,150 1,150 1,152 497 497 497 497
Sample size: third follow-up 1,063 1,063 1,063 1,063 468 469 469 470
Notes: Robust standard errors in parentheses. Experimental estimates are ITT estimates and control for randomiza-
tion strata. Sales and profits are in 1,000s of real naira per month. Aggregate index of outcomes includes monthly
sales, truncated monthly sales, annual sales, sales higher than one year ago, monthly profits, truncated monthly prof-
its, profits in the best month, and inverse hyperbolic sine of profits. Existing and new refers to firm status at time of
application. Rounds 1, 2, and 3 are 1, 2, and 3 years after application.
Figure 3. Quantile Treatment Effects on Profits in Round 3
Notes: Profits are in thousands of real naira per month. New firms and existing firms refer to status at time of appli-
cation. Round 3 is 3 years after application and 12–18 months after all grants have been received.
−150
−100
−50
0
50
100
150
200
Totalprofits
Totalprofits
510 20 30 40 50 60 70 80 90 95
Percentile
510 20 30 40 50 60 70 80 90 95
Percentile
Panel A. New firms
−250
−100
−50
0
50
100
250
Panel B. Existing firms
OLS
Quantile treatment effect
95% CI
2298 THE AMERICAN ECONOMIC REVIEW AUGUST 2017
summary index are significant in both years, while the impact on profits and sales
is only statistically significant in the second year. The last four columns of Table 5
show the impacts for existing firms. As with the new firms, the impacts are stronger
in years 2 and 3 than in year 1, and are again significant for the inverse hyperbolic
sine and summary index measures in both years. The impact on the level of sales is
also significant in years 2 and 3, while the impact on profits is only significant in the
second year. Online Appendix 14 shows the round 3 impacts on profits and sales are
also significant for both new and existing firms if we use any of several alternative
transforms that reduce the influence of the top tail of the distribution, as well as
examining robustness to other measures of profits and sales.
The estimated effect size is approximately 0.2 to 0.3 standard deviations in terms
of the aggregate index. The quantile treatment effect on monthly profits in round 3
at the fiftieth percentile is 69,000 naira for new firms and 51,000 naira for new
firms, while the regression estimates of the ITT are 69,000 naira (round 2) and
20,000 naira (round 3) for new firms, and 69,000 naira (round 2) and 32,000 naira
(round 3) for existing firms. Relative to the monthly profit round 3 control means
of 114,000 naira (new firms) and 192,000 naira (existing firms), these estimates are
Table 5—Impact on Capital
Took a
formal
loan
Received
equity
investment
Value of
inventories
Made
large
K purchase
Value of
capital
purchases
Value
of capital
stock
Panel A. New firms
First follow-up −0.003 −0.005 349 0.289 1,062 1,448
(0.006) (0.010) (123) (0.031) (128) (196)
Second follow-up 0.003 0.026 1,869 0.404 1,543 4,568
(0.009) (0.012) (350) (0.029) (143) (464)
Third follow-up 0.015 0.001 697 0.103 155 3,489
(0.012) (0.010) (196) (0.031) (122) (324)
Control mean: first follow-up 0.011 0.029 721 0.211 345 1,024
Control mean: second follow-up 0.018 0.017 925 0.206 252 1,290
Control mean: third follow-up 0.022 0.020 713 0.206 292 984
Sample size: first follow-up 995 995 991 995 991 995
Sample size: second follow-up 1,071 1,071 1,013 1,071 1,013 956
Sample size: third follow-up 857 857 771 857 771 809
Panel B. Existing firms
First follow-up −0.025 0.026 729 0.369 1,356 2,050
(0.017) (0.019) (268) (0.046) (185) (335)
Second follow-up −0.039 0.030 1,320 0.242 1,018 3852
(0.020) (0.023) (579) (0.045) (202) (744)
Third follow-up 0.001 0.001 845 0.115 221 4,295
(0.025) (0.018) (486) (0.052) (340) (713)
Control mean: first follow-up 0.042 0.026 1,223 0.358 537 1,759
Control mean: second follow-up 0.063 0.045 2,226 0.434 596 3,190
Control mean: third follow-up 0.061 0.031 1,645 0.362 668 2,536
Sample size: first follow-up 423 423 422 423 423 422
Sample size: second follow-up 458 458 453 458 453 381
Sample size: third follow-up 372 372 360 372 360 331
Notes: Robust standard errors in parentheses. Experimental estimates are ITT estimates and control for randomiza-
tion strata. Inventories and capital values are in 1,000s of real naira per month. Existing and new refers to firm sta-
tus at time of application. Rounds 1, 2, and 3 are 1, 2, and 3 years after application.
2299McKenzie: Identifying and Spurring EntrepreneurshipVOL. 107 NO. 8
equivalent to a 17 to 60 percent increase (new firms) and 17 to 36 percent increase
(existing firms).
V. Mechanisms
The results show that winning the competition resulted in sizable increases in
employment which persisted after all grant money had been received, and that this
increase in employment was profitable for firms. This contrasts with case 1, which
predicted no employment effect, and case 2, which predicted that any effect would
reverse once all grant money had been received. I therefore turn to examining the
impacts on intermediate channels to help understand the mechanisms behind this
employment effect.
A. Conditionality
The fact that the grants were payable in four tranches, with the third and fourth
tranches requiring progress on sales and hiring workers, may make the impact
­different from that of an unrestricted grant. I can rule out the mechanism in case 2,
whereby conditionality only acts by inducing a short-term increase in the return
to labor and capital, since the impacts persist after all payments were received.
Moreover, if conditionality were the reason for hiring, it would not explain why
the majority of winners hire more workers than needed to be hired to receive the
tranche payment. Seventy-eight percent of the winning firms have more employees
than required at the time of the second survey, and 73 percent at the time of the third
survey. Even without the conditionality, paying the grant in four installments over
time may have different impacts to a single lump-sum grant and I am unable to say
if the impact would be different if paid in a single one-time grant.16
B. Changes in A and E
Next, consider the evidence for case 3, whereby the impact of the program comes
from changing the productivity and entrepreneurial skill of those operating busi-
nesses. Online Appendix 15 provides results. There is no significant change in entre-
preneurial self-efficacy, which measures the owner’s self-confidence in their ability
to carry out 12 business-related actions such as “estimate customer demand for a
new product,” and “identify good employees who can help the business grow.” This
also helps rule out the concern that the control group has become less self-confident
as a result of not winning. There is also no change in the likelihood the firm owner
has a business mentor, or in the number of other firm owner’s they discuss business
with. These suggest the main mechanisms are not through more confidence and
connections. There is a minor improvement in business practices for the new firms
operating, but the magnitude of the effect is likely to explain only a 0.2 percent
increase in the likelihood of operating, and a 4 percent change in profits. There is no
16 
For example, recipients facing borrowing and saving constraints may be less able to buy larger value items if
the payment is made in tranches, but payment in tranches may help them overcome self-control problems and take
longer to plan their investments. 
2300 THE AMERICAN ECONOMIC REVIEW AUGUST 2017
increase in business practices for existing firms. This set of results suggest that the
impact is not coming through the mechanisms of increasing A and E.
C. Changes in Capital
Table 5 examines how winning affected the firm’s use of capital. The first two
columns consider the use of outside finance in the form of formal loans and equity
investment, respectively. The use of both forms of finance is very low, with fewer
than 3 percent of the new firm applicants in the control group receiving either form
of financing in a given year, and only 6 percent of existing firm applicants having
received a formal loan in any given year, and fewer than 5 percent receiving equity
investments. We see relatively little impact on crowd-in or crowd-out of these other
sources of financing. New firm applicants were 2.6 percentage points more likely to
receive equity financing in round 2, and existing firm applicants were 3.9 percentage
points less likely to receive a formal loan in round 2.17
The remaining columns of Table 5, in contrast, show that the grants greatly
increased the amount of capital in the winning firms. Treated firms have higher
inventory levels, are more likely to have made a purchase of business equipment,
land, or buildings of over 100,000 naira, and have spent more on such purchases.
The result is that the total capital stock of the treated firms is 3.5 million naira higher
than the 800,000 naira control mean among new applicants at the time of round 3,
and 4.3 million naira higher than the 2.5 million naira control mean among existing
applicants. The winning firms are therefore substantially higher in terms of capital
stock, as well as in terms of employment.
These results suggest that the main effect of winning is to allow firms to overcome
credit constraints by using the capital grants to purchase more capital inputs, hire
more labor, and use this to produce a wider variety of inputs. In online Appendix 16,
I examine two more pieces of evidence for capital being the main driver of impact. I
use the heterogeneity in the amount of grant received among the experimental win-
ners and find those winners who received larger grants were able to grow larger.18
I also consider heterogeneity in impacts with respect to the potential importance of
capital constraints to the firm at the time of application, finding modest evidence that
more capital-constrained firms benefited more from the grants, but also that almost
everyone says they are capital-constrained.
Under the assumption that the additional workers are paid their marginal product
of labor, and that the only impact of the grants on profits is through the increase in
capital stock, the implied return to capital can be obtained by estimating the follow-
ing equation:
(5)	 ​Profit​s​ i​​  =  a + b × Capita​l​ i​​  +  c × Region × Gende​r​ i​​  + ​ε​i​​​ ,
17 
Online Appendix 16 shows that informal financing from moneylenders, family, and friends is also rare, and
likewise does not appear to have been crowded out by the receipt of the grant. 
18 
Online Appendix 18 considers two other prespecified dimensions of heterogeneity: gender and business plan
score. 
2301McKenzie: Identifying and Spurring EntrepreneurshipVOL. 107 NO. 8
where capital is instrumented with assignment to treatment. I do this first in levels,
and then in a log formulation. Table 6 reports the implied return on capital.19
The
estimated real return to capital for new firms is 1.3 to 3.4 percent per month, while
for existing firms it is 0.4 to 3.3 percent per month. As a comparison, real interest
rates for SME finance are around 20 percent per annum. So the average return on
capital is at the level needed to pay for a loan were credit available. However, these
average returns will include higher returns for some firms and lower returns for
others (including those whose businesses fail). Since loan financing does not allow
banks to capture the high returns in the upside, but results in losses to the bank in
the case of lower returns, in the absence of a way to distinguish well who is likely to
succeed, banks will be reluctant to lend. Moreover, given this variability in returns,
firms may be reluctant to borrow at prevailing interest rates.20
This is seen in the
data, with few control group firms receiving loans.
D. How Do the Additional Businesses Induced to Operate Compare
to the Control Firms?
Winning the competition resulted in many additional firms operating in the treat-
ment group than the control group. If scarce credit is allocated first to the most
productive firms, we might expect the marginal firms to be induced to operate by
the competition to be less efficient and run by less talented individuals than the
firms operating in the control group. Online Appendix 17 examines whether this is
the case. The observable baseline characteristics of the winners operating a firm in
round 3 are similar to the control, with no changes in the sector, nor in the education
of the owner. Using data from the first follow-up survey, I also show owners are
similar in terms of ability measures (digitspan and Raven test), and grit. Finally, in
19 
Note that firms that answered a shortened version of the survey have data on profits, but not capital stock,
available. As a result, the Wald ratio of the impact on profits in Table 4 to the impact on capital in Table 5 will not
be exactly equal to the implied return on capital in Table 6, since Table 6 restricts to a common sample. This also
means the results in Table 6 are specific to those firms answering the full survey. 
20 
Indeed, equity, rather than debt, may be a more suitable way to fund these types of firms, but few firms receive
equity-financing in this market either. 
Table 6—Estimated Monthly Real Return on Capital
New firms Existing firms
Round 2 Round 3 Round 2 Round 3
Panel A. Levels specification: real monthly profits (truncated at 99th percentile)
Capital stock (truncated at 99th percentile) 0.017 0.013 0.023 0.004
(0.003) (0.005) (0.010) (0.010)
Panel B. logs specification: log (real monthly profits + 1)
log (capital stock + 1) 0.410 0.423 0.446 0.411
(0.026) (0.030) (0.057) (0.052)
Implied monthly real return (percent) 3.03 3.38 3.34 2.45
Sample size 956 806 381 331
Notes: Robust standard errors in parentheses. Capital stock is instrumented by assignment to treatment. Implied
monthly return for log specification estimated at median profit to capital ratio.
2302 THE AMERICAN ECONOMIC REVIEW AUGUST 2017
terms of labor productivity, the marginal firms that only operate as a result of win-
ning are not all less productive than the control group firms, but rather come from
across the control group productivity distribution. Moreover, these additional firms
are larger in size than most firms in Nigeria, and are run by youth with human capital
levels that greatly exceed national averages—and as such are expected to be more
productive than the average Nigerian firm.
VI.  Longer-Term Impacts during a Time of Recession
In 2016, Nigeria suffered its worst economic performance in 30 years, driven by
a contraction in the oil sector which is the main export and accounts for 70 percent
of government revenues. The government imposed currency controls and import
restrictions, which led to a parallel exchange rate and inflation reaching 18.5 per-
cent, the highest in over a decade. In this difficult environment for firms, I went back
and conducted a longer-term follow-up survey between July and November 2016.
The survey was answered by 79.7 percent of treatment and 74.5 percent of control
firms, and operating status was obtained for 92.5 percent of treatment and 90.9 per-
cent of control firms.21
Table 7 summarizes the impacts of the program during this time period, which is
five years after applying and more than 3 years since all money has been received
from the program. New firm applicants are still 24.1 percentage points more likely
to be operating a firm, report 2.6 more workers, and are 11.1 percentage points more
likely to have 10 or more workers than control firms. Existing firms are 9.5 percent-
age points more likely to be operating, have 3.0 more workers, and are 12.7 percent-
age points more likely to have 10 or more workers. These impacts are all significant
at the 1 percent levels and large relative to the control means. The impact on the
21 
A joint orthogonality test can not reject balance on baseline characteristics for the sample answering the
survey for either new firms ( p  =  0.857) or existing firms (0.985). 
Table 7—Longer-Term Impacts during a Time of Recession
New firms Existing firms
Outcome
Sample
size
Control
mean
Treatment
effect
Sample
size
Control
mean
Treatment
effect
Operates a firm at time of survey 1,198 0.529 0.241 487 0.761 0.095
(0.028) (0.036)
Total employment 1,125 3.810 2.596 462 5.206 2.997
(0.458) (0.756)
Firm of 10+ workers 1,125 0.117 0.111 462 0.154 0.127
(0.024) (0.038)
Truncated profits 1,085 84.625 −0.866 450 108.978 26.111
(14.970) (24.526)
Inverse hyperbolic sine of profits 1,085 5.055 2.368 450 7.768 1.551
(0.378) (0.521)
Aggregate index of sales and profits 1,085 −0.019 0.081 450 −0.046 0.102
(0.047) (0.070)
Notes: Impacts from round 4 survey taken in July through November 2016, more than three years after all payments
had been received. Regressions control for randomization strata. Robust standard errors in parentheses. Regressions
control for randomization area.
2303McKenzie: Identifying and Spurring EntrepreneurshipVOL. 107 NO. 8
level of profits is insignificant, but there is a positive and significant impact on the
inverse hyperbolic sine of profits for both new and existing firms, and on the aggre-
gate index of sales and profits for new firms. Online Appendix 19 shows the quantile
treatment effect estimates are positive for profits in the middle of the distribution,
but at the lower tail there is no impact with firms closed, and at the upper tail the
variance is large.
These results show that the program has continued to have positive impacts over a
longer time horizon. However, the estimated impacts on firm operation and employ-
ment are smaller in magnitude than seen in round 3. This may reflect some of the
additional firm growth achieved by treated firms being constrained by the weak
economy.
VII.  Robustness to Common Concerns about Firm Experiments
There are several general issues that affect almost all firm experiments in devel-
oping countries: the use of self-reported data, the extent to which impacts arise from
general equilibrium factors, and the extent to which the results generalize. I discuss
each in turn.22
A. Self-Reporting
While the use of self-reported data from surveys is standard for firm experiments
in developing countries, readers may be concerned whether such data are reliable.
A first point to note is that administrative data on firms are rare in most developing
countries, and there is a growing body of evidence to show that firms systemati-
cally misreport their revenues, costs, and wages to the authorities (Pomeranz 2015;
Carrillo, Pomeranz, and Singhal 2017; Kumler, Verhoogen, and Frías 2015), so that
it is not clear that one should prefer administrative data over survey data even if it
were available. Indeed the analysis in online Appendix 11 suggests that the admin-
istrative data on employment for the business plan competition winners is unreliable
in our specific case.
Second, the survey was designed and conducted in a manner to reduce reporting
bias. It was conducted by a well-known independent market research company (TNS
RMS Nigeria) and participants were told its “purpose is to help better understand
the growth process of enterprises being run by Nigerian youth, as well as the devel-
opment process of youths thinking about starting a business,” with participants told
the results would be kept confidential and used for research purposes only. The first
round survey asked about a variety of government programs, and not just YouWiN!
Together these features are likely to make the survey responses less biased than if
the data were collected in an official capacity by the government program imple-
menters. Online Appendix 14 shows treatment does not have significant impacts on
errors in reporting sales and profits.
Finally, although I need to rely on survey data for the majority of the analysis,
there are a couple of checks of business size that are not based on self-reports. In
22 
Note that these robustness checks were not included in the pre-analysis plan, but are a response to commonly
occurring comments raised for almost all firm experiments. 
2304 THE AMERICAN ECONOMIC REVIEW AUGUST 2017
the first and second round follow-ups, approximately 50 percent of the in-person
surveys took place in the business (the rest taking place at the home or at a third
location). In the third round, more emphasis was put on trying to interview at the
business premises, and 90 percent of the in-person surveys of those operating busi-
nesses took place at the business.23
Likewise, in the long-term follow-up round in
2016, 97 percent of the in-person surveys for those operating a business took place
at the business location. For this subsample the interviewers physically counted how
many employees they observed at the place of business. This is an undercount of
true employment because it misses workers who are working in another location
(e.g., in the homes of clients, in other stores, traveling, etc.) or who are temporarily
absent. Nevertheless, it does provide a check of whether observed employment is
larger for the treated firms. Second, throughout the survey rounds information was
collected on whether the firms have a website, along with the URL. On October 4,
2015, and January 10, 2017 I tested to see whether each firm had a functioning URL.
Having a functioning website is a proxy for being of a larger size three-and-a-half
years and five years after winning.
Table 8 reports the results of these checks. YouWiN! winners have significantly
more observed workers and are more likely to have a functioning website for
both new and existing applicants. This is true for both the third follow-up and the
­long-term survey round. At the time of the third follow-up, new firms have approx-
imately three times as many employees observed at the premises among the experi-
mental winners than the control group, and existing firms have almost twice as many
employees observed. While the absolute levels are smaller, these ratios are similar to
those in Table 3. Both new and existing firms are twice as likely to have a function-
ing website among the experimental winners as in the control group. While limited,
these checks do help provide assurance that there is a genuine increase in firm sizes
for the treated firms.
23 
Those whose business had closed down or who had not started businesses were surveyed at their home or in
a third location. 
Table 8—Impacts on Non-Self-Reported Outcomes
New firms Existing firms
Employees
counted
Functioning
website
Employees
counted
Functioning
website
Impact at third follow-up 2.044 0.040 1.746 0.081
(0.263) (0.014) (0.439) (0.030)
Long-term impact 1.173 0.022 1.051 0.097
(0.253) (0.013) (0.370) (0.028)
Sample size: third follow-up 860 1,300 398 541
Sample size: long term follow-up 908 1,300 386 541
Control mean: third follow-up 1.077 0.047 2.175 0.099
Control mean: long term follow-up 1.220 0.045 2.209 0.072
Notes: Robust standard errors in parentheses. Long-term follow-up is five years after applying, and more than three
years after all funding has been received.
2305McKenzie: Identifying and Spurring EntrepreneurshipVOL. 107 NO. 8
B. Competition and Spillovers
A second potential concern may be whether the growth of the winners came at the
expense of other firms. There are two elements of this concern. The first is a concern
about internal validity: if the growth of the winners came at the expense of firms in
the control group, the control group would no longer provide a valid counterfactual.
This seems unlikely to be an important concern in our case, since the experimental
sample is widely scattered over a country of 170 million people, and is not heavily
concentrated in any single industry.As a check, onlineAppendix 20 shows that there
is no heterogeneity in treatment effect, nor difference in control outcomes, with the
number of other firms selected as winners in the same state and industry. As a result,
the estimates should be internally valid, and are informative for showing the con-
straints facing individual businesses.
The second aspect of this concern is then whether the gains to winners came from
taking business from other firms in the economy.24
Often this is seen as a concern in
thinking about scaling up small pilots, whereas hereYouWin! is operating at a scale
of $60 million per year, and is larger than all the other business plan competitions
discussed in the introduction. It seems unlikely that such a program would have
the intensity randomized at the regional level as in the labor market intervention of
Crépon et al. (2013), precluding a randomization approach to measuring these spill-
overs. Rotemberg (2015) uses detailed firm data from India and finds a small busi-
ness subsidy program there did result in competitors losing market share, but not for
those producing internationally traded markets. In the United States, Bronnenberg
and Ellickson (2015) note that online sales have had a market expansion effect, by
increasing convenience and product variety, so that gains to new entrants need not
come from taking market share from incumbents, and they speculate that such chan-
nels may be more important in developing country markets.
We have seen that winners have indeed increased innovation, adding new prod-
ucts and new locations. For example, one of the winners set up a dry-cleaning chain,
which expanded into locations where dry-cleaning services weren’t readily avail-
able. Given how underdeveloped many product markets are in Nigeria, it seems
plausible that the gain in sales is coming from growing the size of the market, not
just undercutting competitors. As an additional check on this, online Appendix 20
shows that winners were no more likely to reduce their product prices than the con-
trol group, suggesting that the channel for expansion was not taking market share
through price competition. This evidence is admittedly indirect and limited, but the
absence of detailed data on other firms in Nigeria precludes any further analysis of
changes for nonprogram firms.
24 
Of course even if the gains to winners all come from taking business from other firms, aggregate efficiency
can still increase if the business plan competition reduces misallocation by taking sales from small, unproductive
firms and directing it toward more efficient firms. Section VD argues that the winners are likely to be more efficient
than the average firm in the economy. 
2306 THE AMERICAN ECONOMIC REVIEW AUGUST 2017
C. External Validity
A final critique that can be raised about any impact evaluation is the extent to which
its results may generalize. The program studied here is a nationwide program to a
large number of firms in Africa’s largest country, and hence should be of intrinsic
interest. Moreover, the competition has already been run in three more rounds in
Nigeria. Nevertheless, there are reasons to believe the findings may generalize beyond
Nigeria. As noted in the introduction, these types of business plan competitions have
become increasingly common, particularly in sub-Saharan Africa. While the amounts
offered in Nigeria are high, they are far from unique—the average grant sizes in the
Somalia business plan competition were $58,000 in round 1 and $67,000 in round
2, and awards of $25,000 were given in Côte d’Ivoire. The key difference here is the
large number of winners and randomized selection provide the ability to evaluate and
learn from this competition, which has not been possible in the other cases. It seems
likely that these competitions in other countries are also inducing applications from
entrepreneurs with high growth potential. Whether such entrepreneurs can be identi-
fied in alternative ways to business plan competitions and/or be supported through
alternative policy instruments to grants are interesting questions for future research.
VIII. Conclusions
The YouWiN! business plan competition has had large impacts on the rate of
business start-up, survival of existing firms, employment, profits, and sales of win-
ning firms. It has succeeded in generating more firms with ten or more employees,
and provides the first experimental evidence of how direct policy action can spur the
growth of such firms. The impacts are not consistent with a model of no market fail-
ures in which the grants would be predicted to increase the incomes of the business
owners without changing their production decisions. Examination of the interme-
diate channels suggests that a main effect of the program has been to enable firms
to buy more capital, innovate more, and hire more workers, with little impact on
business practices, mentoring, or networking. The business plan competition seems
an effective tool for identifying entrepreneurs with much greater scope for growth
than the typical microenterprise.
References
Ayyagari, Meghana, Asli Demirguc-Kunt, and Vojislav Maksimovic. 2014. “Who Creates Jobs in
Developing Countries?” Small Business Economics 43 (1): 75–99.
Bandiera, Oriana, Robin Burgess, Narayan Das, Selim Gulesci, Imran Rasul, and Munshi Sulaiman.
2017. “Labor Markets and Poverty in Village Economies.” Quarterly Journal of Economics 132
(2): 811–70.
Banerjee, Abhijit, Esther Duflo, Nathanael Goldberg, Dean Karlan, Robert Osei, Williwam Parienté,
Jeremy Shapiro, Bram Thuysbaert, and Christopher Udry. 2015. “A Multifacted Program Causes
Lasting Progress for the Very Poor: Evidence from Six Countries.” Science 348 (6236): 772.
Blattman, Christopher, Nathan Fiala, and Sebastian Martinez. 2014. “Generating Skilled Self-Em-
ployment in Developing Countries: Experimental Evidence from Uganda.” Quarterly Journal of
Economics 129 (2): 697–752.
Bronnenberg, Bart J., and Paul B. Ellickson. 2015. “Adolescence and the Path to Maturity in Global
Retail.” Journal of Economic Perspectives 29 (4): 113–34.
Buera, Francisco J., Joseph P. Kaboski, and Yongseok Shin. 2014. “Macro-Perspective on Asset Grants
Programs: Occupational and Wealth Mobility.” American Economic Review 104 (5): 159–64.
2307McKenzie: Identifying and Spurring EntrepreneurshipVOL. 107 NO. 8
Buera, Francisco, Joseph Kaboski, and Yongseok Shin. 2016. “Taking Stock of the Evidence on
Micro-Financial Interventions.” http://www3.nd.edu/~jkaboski/BKS_NBER.pdf (accessed June 2,
2017).
Carrillo, Paul, Dina Pomeranz, and Monica Singhal. 2017. “Dodging the Taxman: Firm Misreporting
and Limits to Tax Enforcement.” American Economic Journal: Applied Economics 9 (2): 144–64.
Crépon, Bruno, Esther Duflo, Marc Gurgand, Roland Rathelot, and Philippe Zamora. 2013. “Do
Labor Market Policies Have Displacement Effects? Evidence from a Clustered Randomized Exper-
iment.” Quarterly Journal of Economics 128 (2): 531–80.
De Mel, Suresh, David McKenzie, and Christopher Woodruff. 2008. “Returns to Capital in Microen-
terprises: Evidence from a Field Experiment.” Quarterly Journal of Economics 123 (4): 1329–72.
Elkan, Walter. 1988. “Entrepreneurs and Entrepreneurship in Africa.” World Bank Research Observer
3 (2): 171–88.
Fafchamps, Marcel, David McKenzie, Simon Quinn, and Christopher Woodruff. 2014. “Microenter-
prise Growth and the Flypaper Effect: Evidence from a Randomized Experiment in Ghana.” Jour-
nal of Development Economics 106: 211–26.
Fafchamps, Marcel, and Simon Quinn. Forthcoming. “Aspire.” Journal of Development Studies.
Fafchamps, Marcel, and Christopher Woodruff. 2016. “Identifying Gazelles: Expert Panels vs. Sur-
veys as a Means to Identify Firms with Rapid Growth Potential.” World Bank Policy Research
Paper WPS 7647.
Gollin, Douglas. 2002. “Getting Income Shares Right.” Journal of Political Economy 110 (2): 458–74.
Haltiwanger, John, Ron S. Jarmin, and Javier Miranda. 2013. “Who Creates Jobs? Small versus Large
versus Young.” Review of Economics and Statistics 95 (2): 347–61.
Henrekson, Magnus, and Dan Johansson. 2010. “Gazelles as Job Creators: A Survey and Interpreta-
tion of the Evidence.” Small Business Economics 35 (2): 227–44.
Hsieh, Chang-Tai, and Peter J. Klenow. 2014. “The Life Cycle of Plants in India and Mexico.” Quar-
terly Journal of Economics 129 (3): 1035–84.
Hsieh, Chang-Tai, and Benjamin A. Olken. 2014. “The Missing ‘Missing Middle’.” Journal of Eco-
nomic Perspectives 28 (3): 89–108.
International Labour Organization (ILO). 2012. Global Employment Trends 2012: Preventing a
Deeper Jobs Crisis. Geneva: International Labour Organization.
Jovanovic, Boyan. 1982. “Selection and the Evolution of Industry.” Econometrica 50 (3): 649–70.
Karlan, Dean, Ryan Knight, and Christopher Udry. 2015. “Consulting and Capital Experiments with
Microenterprise Tailors in Ghana.” Journal of Economic Behavior and Organization 118: 281–302.
Klinger, Bailey, and Matthias Schündeln. 2011. “Can Entrepreneurial Activity Be Taught? Quasi-
experimental Evidence from Central America.” World Development 39 (9): 1592–610.
Kumler, Todd, Eric Verhoogen, and Judith Frías. 2015. “Enlisting Employees in Improving
Payroll-Tax Compliance: Evidence from Mexico.” http://www.columbia.edu/~ev2124/research/
KumlerVerhoogenFriasApril2015.pdf (accessed June 2, 2017).
Lucas, Robert E., Jr. 1978. “On the Size Distribution of Business Firms.” Bell Journal of Economics
9 (2): 508–23.
McKenzie, David. 2017. “Identifying and Spurring High-Growth Entrepreneurship: Experimental
Evidence from a Business Plan Competition: Dataset.” American Economic Review. https://doi.
org/10.1257/aer.20151404.
McKenzie, David, and Christopher Woodruff. 2008. “Experimental Evidence on Returns to Capital
and Access to Finance in Mexico.” World Bank Economic Review 22 (3): 457–82.
McKenzie, David, and Christopher Woodruff. 2014. “What Are We Learning from Business Training
and Entrepreneurship Evaluations around the Developing World?” World Bank Research Observer
29 (1): 48–82.
Organisation for Economic Co-operation and Development (OECD). 2010. High-Growth Enterprises:
What Governments Can Do to Make a Difference. Paris: Organisation for Economic Co-operation
and Development Publishing.
Omidyar Network. 2013. Accelerating Entrepreneurship in Africa: Understanding Africa’s Chal-
lenges to Creating Opportunity-Driven Entrepreneurship. Omidyar Group.
Pomeranz, Dina. 2015. “No Taxation without Information: Deterrence and Self-Enforcement in the
Value Added Tax.” American Economic Review 105 (8): 2539–69.
Rotemberg, Martin. 2015. “Equilibrium Effects of Firm Subsidies.” https://nyu.app.box.com/s/fov48g
qhxjjs843b09drnvbbdqn9v49h (accessed June 2, 2017).
Schoar, Antoinette. 2010. “The Divide between Subsistence and Transformational Entrepreneurship.”
In Innovation Policy and the Economy, Vol. 10, edited by Joshua Lerner and Scott Stern, 57–81.
Chicago: University of Chicago Press.
This article has been cited by:
1. Albert Bravo-Biosca. 2020. Experimental Innovation Policy. Innovation Policy and the Economy 20,
191-232. [Crossref]
2. Stjepan Srhoj, Janette Walde. 2020. Getting ready for EU Single Market: The effect of export-
oriented grant schemes on firm performance. Structural Change and Economic Dynamics 52, 279-293.
[Crossref]
3. Marc F. Bellemare, Casey J. Wichman. 2020. Elasticities and the Inverse Hyperbolic Sine
Transformation. Oxford Bulletin of Economics and Statistics 82:1, 50-61. [Crossref]
4. Jumana Alaref, Stefanie Brodmann, Patrick Premand. 2020. The medium-term impact of
entrepreneurship education on labor market outcomes: Experimental evidence from university
graduates in Tunisia. Labour Economics 62, 101787. [Crossref]
5. . References 453-480. [Crossref]
6. Robert Garlick, Kate Orkin, Simon Quinn. 2019. Call Me Maybe: Experimental Evidence on
Frequency and Medium Effects in Microenterprise Surveys. The World Bank Economic Review 103. .
[Crossref]
7. . Technological Change 136-157. [Crossref]
8. David McKenzie, Dario Sansone. 2019. Predicting entrepreneurial success is hard: Evidence from a
business plan competition in Nigeria. Journal of Development Economics 141, 102369. [Crossref]
9. Saurabh A. Lall, Li‐Wei Chen, Abigayle Davidson. 2019. The Expat Gap: Are Local‐Born
Entrepreneurs in Developing Countries at a Disadvantage When Seeking Grant Funding?. Public
Administration Review 79:6, 880-894. [Crossref]
10. Richard Sedlmayr, Anuj Shah, Munshi Sulaiman. 2019. Cash-plus: Poverty impacts of alternative
transfer-based approaches. Journal of Development Economics 102418. [Crossref]
11. Sabrina T. Howell. 2019. Reducing information frictions in venture capital: The role of new venture
competitions. Journal of Financial Economics . [Crossref]
12. David McKenzie, Anna Luisa Paffhausen. 2019. Small Firm Death in Developing Countries. The
Review of Economics and Statistics 101:4, 645-657. [Crossref]
13. Arielle Bernhardt, Erica Field, Rohini Pande, Natalia Rigol. 2019. Household Matters: Revisiting
the Returns to Capital among Female Microentrepreneurs. American Economic Review: Insights 1:2,
141-160. [Abstract] [View PDF article] [PDF with links]
14. Simon Quinn, Christopher Woodruff. 2019. Experiments and Entrepreneurship in Developing
Countries. Annual Review of Economics 11:1, 225-248. [Crossref]
15. Svetlana Boyarchenko, Piin‐Hueih Chiang. 2019. Industry equilibrium with random exit or default.
Journal of Public Economic Theory 21:4, 650-686. [Crossref]
16. Alex Coad, Stjepan Srhoj. 2019. Catching Gazelles with a Lasso: Big data techniques for the prediction
of high-growth firms. Small Business Economics 34. . [Crossref]
17. Stjepan Srhoj, Bruno Škrinjarić, Sonja Radas. 2019. Bidding against the odds? The impact evaluation
of grants for young micro and small firms during the recession. Small Business Economics 76. .
[Crossref]
18. Ross Brown, Neil Lee. 2019. Strapped for cash? Funding for UK high growth SMEs since the global
financial crisis. Journal of Business Research 99, 37-45. [Crossref]
19. Arti Grover Goswami, Denis Medvedev, Ellen Olafsen. Searching for Winners 117-163. [Crossref]
Identifying and spurring high growth entrepreneurship: Experimental evidence from a business plan competition

Weitere ähnliche Inhalte

Was ist angesagt?

The Deloitte Global Millennial Survey 2019
The Deloitte Global Millennial Survey 2019The Deloitte Global Millennial Survey 2019
The Deloitte Global Millennial Survey 2019Goodbuzz Inc.
 
The World Bank's global practices and climate change cross cutting solutions
The World Bank's global practices and climate change cross cutting solutionsThe World Bank's global practices and climate change cross cutting solutions
The World Bank's global practices and climate change cross cutting solutionsDevex
 
Factors affecting funding of youth group enterprises in kenya a case study of...
Factors affecting funding of youth group enterprises in kenya a case study of...Factors affecting funding of youth group enterprises in kenya a case study of...
Factors affecting funding of youth group enterprises in kenya a case study of...Alexander Decker
 
Giin annual impact investor survey 2017
Giin annual impact investor survey 2017Giin annual impact investor survey 2017
Giin annual impact investor survey 2017Massa Critica
 
Gem powerpoint for mr. steele
Gem powerpoint  for mr. steeleGem powerpoint  for mr. steele
Gem powerpoint for mr. steelePaul Griffith
 
Cesse 2012 Management Institute Nikki Walker - Opportunities & Challenges
Cesse 2012 Management Institute Nikki Walker - Opportunities & ChallengesCesse 2012 Management Institute Nikki Walker - Opportunities & Challenges
Cesse 2012 Management Institute Nikki Walker - Opportunities & ChallengesPeter Turner
 
Financial inclusion-by-margaret-miller-wb
Financial inclusion-by-margaret-miller-wbFinancial inclusion-by-margaret-miller-wb
Financial inclusion-by-margaret-miller-wbDr Lendy Spires
 
B3101016
B3101016B3101016
B3101016aijbm
 
Policy survey report_2013__final
Policy survey report_2013__finalPolicy survey report_2013__final
Policy survey report_2013__finalalialtugkoca
 
Engaging Indian Millennial
Engaging Indian MillennialEngaging Indian Millennial
Engaging Indian MillennialReetu Raina
 
Largest Business Plan Competition in the World
Largest Business Plan Competition in the WorldLargest Business Plan Competition in the World
Largest Business Plan Competition in the WorldTim Rose
 
What are small enterprises finance needs
What are small enterprises finance needsWhat are small enterprises finance needs
What are small enterprises finance needsAlexander Decker
 
Assessing Market-Based Solutions: Lessons from Evaluating a Youth Employment ...
Assessing Market-Based Solutions: Lessons from Evaluating a Youth Employment ...Assessing Market-Based Solutions: Lessons from Evaluating a Youth Employment ...
Assessing Market-Based Solutions: Lessons from Evaluating a Youth Employment ...The Rockefeller Foundation
 
The Barbadian Entrepreneurship Context, A Youth Perspective
The Barbadian Entrepreneurship Context, A Youth PerspectiveThe Barbadian Entrepreneurship Context, A Youth Perspective
The Barbadian Entrepreneurship Context, A Youth PerspectiveKeeley Holder
 
Predicting the Level of Crowdfunding Outcome in Africa A Supervised Machine L...
Predicting the Level of Crowdfunding Outcome in Africa A Supervised Machine L...Predicting the Level of Crowdfunding Outcome in Africa A Supervised Machine L...
Predicting the Level of Crowdfunding Outcome in Africa A Supervised Machine L...ijtsrd
 
Challenges affecting informal business funding in zimbabwe
Challenges affecting informal business funding in zimbabweChallenges affecting informal business funding in zimbabwe
Challenges affecting informal business funding in zimbabweDr Lendy Spires
 

Was ist angesagt? (20)

The Future of Youth Employment
The Future of Youth EmploymentThe Future of Youth Employment
The Future of Youth Employment
 
The Deloitte Global Millennial Survey 2019
The Deloitte Global Millennial Survey 2019The Deloitte Global Millennial Survey 2019
The Deloitte Global Millennial Survey 2019
 
The World Bank's global practices and climate change cross cutting solutions
The World Bank's global practices and climate change cross cutting solutionsThe World Bank's global practices and climate change cross cutting solutions
The World Bank's global practices and climate change cross cutting solutions
 
Factors affecting funding of youth group enterprises in kenya a case study of...
Factors affecting funding of youth group enterprises in kenya a case study of...Factors affecting funding of youth group enterprises in kenya a case study of...
Factors affecting funding of youth group enterprises in kenya a case study of...
 
Giin annual impact investor survey 2017
Giin annual impact investor survey 2017Giin annual impact investor survey 2017
Giin annual impact investor survey 2017
 
Gem powerpoint for mr. steele
Gem powerpoint  for mr. steeleGem powerpoint  for mr. steele
Gem powerpoint for mr. steele
 
Cesse 2012 Management Institute Nikki Walker - Opportunities & Challenges
Cesse 2012 Management Institute Nikki Walker - Opportunities & ChallengesCesse 2012 Management Institute Nikki Walker - Opportunities & Challenges
Cesse 2012 Management Institute Nikki Walker - Opportunities & Challenges
 
Financial inclusion-by-margaret-miller-wb
Financial inclusion-by-margaret-miller-wbFinancial inclusion-by-margaret-miller-wb
Financial inclusion-by-margaret-miller-wb
 
B3101016
B3101016B3101016
B3101016
 
Clarke et al 2009 ICT in Small and Medium Enterprises
Clarke et al 2009 ICT in Small and Medium EnterprisesClarke et al 2009 ICT in Small and Medium Enterprises
Clarke et al 2009 ICT in Small and Medium Enterprises
 
Policy survey report_2013__final
Policy survey report_2013__finalPolicy survey report_2013__final
Policy survey report_2013__final
 
Engaging Indian Millennial
Engaging Indian MillennialEngaging Indian Millennial
Engaging Indian Millennial
 
Largest Business Plan Competition in the World
Largest Business Plan Competition in the WorldLargest Business Plan Competition in the World
Largest Business Plan Competition in the World
 
What are small enterprises finance needs
What are small enterprises finance needsWhat are small enterprises finance needs
What are small enterprises finance needs
 
Assessing Market-Based Solutions: Lessons from Evaluating a Youth Employment ...
Assessing Market-Based Solutions: Lessons from Evaluating a Youth Employment ...Assessing Market-Based Solutions: Lessons from Evaluating a Youth Employment ...
Assessing Market-Based Solutions: Lessons from Evaluating a Youth Employment ...
 
The Barbadian Entrepreneurship Context, A Youth Perspective
The Barbadian Entrepreneurship Context, A Youth PerspectiveThe Barbadian Entrepreneurship Context, A Youth Perspective
The Barbadian Entrepreneurship Context, A Youth Perspective
 
Corporate Social Responsibility’s New Role in the Middle East
Corporate Social Responsibility’s New Role in the Middle EastCorporate Social Responsibility’s New Role in the Middle East
Corporate Social Responsibility’s New Role in the Middle East
 
Predicting the Level of Crowdfunding Outcome in Africa A Supervised Machine L...
Predicting the Level of Crowdfunding Outcome in Africa A Supervised Machine L...Predicting the Level of Crowdfunding Outcome in Africa A Supervised Machine L...
Predicting the Level of Crowdfunding Outcome in Africa A Supervised Machine L...
 
Challenges affecting informal business funding in zimbabwe
Challenges affecting informal business funding in zimbabweChallenges affecting informal business funding in zimbabwe
Challenges affecting informal business funding in zimbabwe
 
Enterprenuaship 1
Enterprenuaship 1Enterprenuaship 1
Enterprenuaship 1
 

Ähnlich wie Identifying and spurring high growth entrepreneurship: Experimental evidence from a business plan competition

Challenges of Small Scale Entrepreneurs in Dodoma Tanzania
Challenges of Small Scale Entrepreneurs in Dodoma TanzaniaChallenges of Small Scale Entrepreneurs in Dodoma Tanzania
Challenges of Small Scale Entrepreneurs in Dodoma Tanzaniainventionjournals
 
Financial inclusion-by-margaret-miller-wb
Financial inclusion-by-margaret-miller-wbFinancial inclusion-by-margaret-miller-wb
Financial inclusion-by-margaret-miller-wbDr Lendy Spires
 
DETERMINANTS OF SMALL BUSINESS PERFORMANCE IN OYE LOCAL GOVERNMENT, EKITI STA...
DETERMINANTS OF SMALL BUSINESS PERFORMANCE IN OYE LOCAL GOVERNMENT, EKITI STA...DETERMINANTS OF SMALL BUSINESS PERFORMANCE IN OYE LOCAL GOVERNMENT, EKITI STA...
DETERMINANTS OF SMALL BUSINESS PERFORMANCE IN OYE LOCAL GOVERNMENT, EKITI STA...AJHSSR Journal
 
An Assessment Of The Impact Of Business Plan Competitions On Enterprise Devel...
An Assessment Of The Impact Of Business Plan Competitions On Enterprise Devel...An Assessment Of The Impact Of Business Plan Competitions On Enterprise Devel...
An Assessment Of The Impact Of Business Plan Competitions On Enterprise Devel...Tony Lisko
 
Strategic Options for Creating Competitive Advantage for Youth Enterprises in...
Strategic Options for Creating Competitive Advantage for Youth Enterprises in...Strategic Options for Creating Competitive Advantage for Youth Enterprises in...
Strategic Options for Creating Competitive Advantage for Youth Enterprises in...paperpublications3
 
Evolving development goals in an evolving world report
Evolving development goals in an evolving world reportEvolving development goals in an evolving world report
Evolving development goals in an evolving world reportThe Economist Media Businesses
 
SMEs and Entrepreneurship: What can and do governments do?
SMEs and Entrepreneurship: What can and do governments do?SMEs and Entrepreneurship: What can and do governments do?
SMEs and Entrepreneurship: What can and do governments do?OECDglobal
 
RAISING THE BAR THROUGH COLLECTIVE ACTION Anti-Corruption Efforts in Action i...
RAISING THE BAR THROUGH COLLECTIVE ACTION Anti-Corruption Efforts in Action i...RAISING THE BAR THROUGH COLLECTIVE ACTION Anti-Corruption Efforts in Action i...
RAISING THE BAR THROUGH COLLECTIVE ACTION Anti-Corruption Efforts in Action i...GlobalCompact
 
GEC 2016: Jonathan Ortmans
GEC 2016: Jonathan OrtmansGEC 2016: Jonathan Ortmans
GEC 2016: Jonathan OrtmansMark Marich
 
An evaluation of legal, legislative and financial factors affecting performan...
An evaluation of legal, legislative and financial factors affecting performan...An evaluation of legal, legislative and financial factors affecting performan...
An evaluation of legal, legislative and financial factors affecting performan...Alexander Decker
 
Ye! Community Impact Report 2019
Ye! Community Impact Report 2019Ye! Community Impact Report 2019
Ye! Community Impact Report 2019Claire Sterngold
 
Entrepreneurship Orientation, Market Orientation, Business Strategy, Managem...
	Entrepreneurship Orientation, Market Orientation, Business Strategy, Managem...	Entrepreneurship Orientation, Market Orientation, Business Strategy, Managem...
Entrepreneurship Orientation, Market Orientation, Business Strategy, Managem...inventionjournals
 
Running Head ECONOMICS AND ADMINISTRATION1ECONOMICS AND ADMI.docx
Running Head ECONOMICS AND ADMINISTRATION1ECONOMICS AND ADMI.docxRunning Head ECONOMICS AND ADMINISTRATION1ECONOMICS AND ADMI.docx
Running Head ECONOMICS AND ADMINISTRATION1ECONOMICS AND ADMI.docxtodd271
 
IFAC-Make-Way-For-Gen-Z.pdf
IFAC-Make-Way-For-Gen-Z.pdfIFAC-Make-Way-For-Gen-Z.pdf
IFAC-Make-Way-For-Gen-Z.pdfSamer Shaheen
 
An entrepreneur’s perspective: Today’s world through the eyes of the young in...
An entrepreneur’s perspective: Today’s world through the eyes of the young in...An entrepreneur’s perspective: Today’s world through the eyes of the young in...
An entrepreneur’s perspective: Today’s world through the eyes of the young in...The Economist Media Businesses
 

Ähnlich wie Identifying and spurring high growth entrepreneurship: Experimental evidence from a business plan competition (20)

Challenges of Small Scale Entrepreneurs in Dodoma Tanzania
Challenges of Small Scale Entrepreneurs in Dodoma TanzaniaChallenges of Small Scale Entrepreneurs in Dodoma Tanzania
Challenges of Small Scale Entrepreneurs in Dodoma Tanzania
 
Financial inclusion-by-margaret-miller-wb
Financial inclusion-by-margaret-miller-wbFinancial inclusion-by-margaret-miller-wb
Financial inclusion-by-margaret-miller-wb
 
29407_Book
29407_Book29407_Book
29407_Book
 
DETERMINANTS OF SMALL BUSINESS PERFORMANCE IN OYE LOCAL GOVERNMENT, EKITI STA...
DETERMINANTS OF SMALL BUSINESS PERFORMANCE IN OYE LOCAL GOVERNMENT, EKITI STA...DETERMINANTS OF SMALL BUSINESS PERFORMANCE IN OYE LOCAL GOVERNMENT, EKITI STA...
DETERMINANTS OF SMALL BUSINESS PERFORMANCE IN OYE LOCAL GOVERNMENT, EKITI STA...
 
An Assessment Of The Impact Of Business Plan Competitions On Enterprise Devel...
An Assessment Of The Impact Of Business Plan Competitions On Enterprise Devel...An Assessment Of The Impact Of Business Plan Competitions On Enterprise Devel...
An Assessment Of The Impact Of Business Plan Competitions On Enterprise Devel...
 
Strategic Options for Creating Competitive Advantage for Youth Enterprises in...
Strategic Options for Creating Competitive Advantage for Youth Enterprises in...Strategic Options for Creating Competitive Advantage for Youth Enterprises in...
Strategic Options for Creating Competitive Advantage for Youth Enterprises in...
 
SME Program 5 Year Report FINAL
SME Program 5 Year Report FINALSME Program 5 Year Report FINAL
SME Program 5 Year Report FINAL
 
Evolving development goals in an evolving world report
Evolving development goals in an evolving world reportEvolving development goals in an evolving world report
Evolving development goals in an evolving world report
 
SMEs and Entrepreneurship: What can and do governments do?
SMEs and Entrepreneurship: What can and do governments do?SMEs and Entrepreneurship: What can and do governments do?
SMEs and Entrepreneurship: What can and do governments do?
 
10120140507002
1012014050700210120140507002
10120140507002
 
10120140507002 2
10120140507002 210120140507002 2
10120140507002 2
 
RAISING THE BAR THROUGH COLLECTIVE ACTION Anti-Corruption Efforts in Action i...
RAISING THE BAR THROUGH COLLECTIVE ACTION Anti-Corruption Efforts in Action i...RAISING THE BAR THROUGH COLLECTIVE ACTION Anti-Corruption Efforts in Action i...
RAISING THE BAR THROUGH COLLECTIVE ACTION Anti-Corruption Efforts in Action i...
 
Financial Literacy amongst Informal Enterprise Owners in Zambia
Financial Literacy amongst Informal Enterprise Owners in ZambiaFinancial Literacy amongst Informal Enterprise Owners in Zambia
Financial Literacy amongst Informal Enterprise Owners in Zambia
 
GEC 2016: Jonathan Ortmans
GEC 2016: Jonathan OrtmansGEC 2016: Jonathan Ortmans
GEC 2016: Jonathan Ortmans
 
An evaluation of legal, legislative and financial factors affecting performan...
An evaluation of legal, legislative and financial factors affecting performan...An evaluation of legal, legislative and financial factors affecting performan...
An evaluation of legal, legislative and financial factors affecting performan...
 
Ye! Community Impact Report 2019
Ye! Community Impact Report 2019Ye! Community Impact Report 2019
Ye! Community Impact Report 2019
 
Entrepreneurship Orientation, Market Orientation, Business Strategy, Managem...
	Entrepreneurship Orientation, Market Orientation, Business Strategy, Managem...	Entrepreneurship Orientation, Market Orientation, Business Strategy, Managem...
Entrepreneurship Orientation, Market Orientation, Business Strategy, Managem...
 
Running Head ECONOMICS AND ADMINISTRATION1ECONOMICS AND ADMI.docx
Running Head ECONOMICS AND ADMINISTRATION1ECONOMICS AND ADMI.docxRunning Head ECONOMICS AND ADMINISTRATION1ECONOMICS AND ADMI.docx
Running Head ECONOMICS AND ADMINISTRATION1ECONOMICS AND ADMI.docx
 
IFAC-Make-Way-For-Gen-Z.pdf
IFAC-Make-Way-For-Gen-Z.pdfIFAC-Make-Way-For-Gen-Z.pdf
IFAC-Make-Way-For-Gen-Z.pdf
 
An entrepreneur’s perspective: Today’s world through the eyes of the young in...
An entrepreneur’s perspective: Today’s world through the eyes of the young in...An entrepreneur’s perspective: Today’s world through the eyes of the young in...
An entrepreneur’s perspective: Today’s world through the eyes of the young in...
 

Mehr von INNOVATION COPILOTS

Pas de risques ? Pas de startup !
Pas de risques ? Pas de startup !Pas de risques ? Pas de startup !
Pas de risques ? Pas de startup !INNOVATION COPILOTS
 
2018 IRU World Congress - Business Models Panel
2018 IRU World Congress - Business Models Panel2018 IRU World Congress - Business Models Panel
2018 IRU World Congress - Business Models PanelINNOVATION COPILOTS
 
Trading Risks - Innovation Copilots
Trading Risks - Innovation CopilotsTrading Risks - Innovation Copilots
Trading Risks - Innovation CopilotsINNOVATION COPILOTS
 
Should Mentors of Entrepreneurs be Trained or their Experience is Enough?
Should Mentors of Entrepreneurs be Trained or their Experience is Enough?Should Mentors of Entrepreneurs be Trained or their Experience is Enough?
Should Mentors of Entrepreneurs be Trained or their Experience is Enough?INNOVATION COPILOTS
 
Should entrepreneurial mentors be trained or is experience enough?
Should entrepreneurial mentors be trained or is experience enough?Should entrepreneurial mentors be trained or is experience enough?
Should entrepreneurial mentors be trained or is experience enough?INNOVATION COPILOTS
 
How to prepare for corporate incubation end of party
How to prepare for corporate incubation end of partyHow to prepare for corporate incubation end of party
How to prepare for corporate incubation end of partyINNOVATION COPILOTS
 
When Corporate Meet Startups - 3 Key Mistakes
When Corporate Meet Startups - 3 Key MistakesWhen Corporate Meet Startups - 3 Key Mistakes
When Corporate Meet Startups - 3 Key MistakesINNOVATION COPILOTS
 
Business Storytelling and Soft Power
Business Storytelling and Soft PowerBusiness Storytelling and Soft Power
Business Storytelling and Soft PowerINNOVATION COPILOTS
 
Keynote "Les effets de bord de l'innovation" - merkapt 2016
Keynote "Les effets de bord de l'innovation" - merkapt 2016Keynote "Les effets de bord de l'innovation" - merkapt 2016
Keynote "Les effets de bord de l'innovation" - merkapt 2016INNOVATION COPILOTS
 
Strategic Mentoring [White Paper]
Strategic Mentoring [White Paper]Strategic Mentoring [White Paper]
Strategic Mentoring [White Paper]INNOVATION COPILOTS
 
Merkapt - Keynote LETI Days- Trading risk with startups
Merkapt - Keynote LETI Days- Trading risk with startupsMerkapt - Keynote LETI Days- Trading risk with startups
Merkapt - Keynote LETI Days- Trading risk with startupsINNOVATION COPILOTS
 
La jeune pousse nouvelle culture d’entreprise - Libération
La jeune pousse nouvelle culture d’entreprise - LibérationLa jeune pousse nouvelle culture d’entreprise - Libération
La jeune pousse nouvelle culture d’entreprise - LibérationINNOVATION COPILOTS
 
Lift14 - Death Awaits You ALL - Open Session - Merkapt
Lift14 - Death Awaits You ALL - Open Session - MerkaptLift14 - Death Awaits You ALL - Open Session - Merkapt
Lift14 - Death Awaits You ALL - Open Session - MerkaptINNOVATION COPILOTS
 

Mehr von INNOVATION COPILOTS (20)

Pas de risques ? Pas de startup !
Pas de risques ? Pas de startup !Pas de risques ? Pas de startup !
Pas de risques ? Pas de startup !
 
2018 IRU World Congress - Business Models Panel
2018 IRU World Congress - Business Models Panel2018 IRU World Congress - Business Models Panel
2018 IRU World Congress - Business Models Panel
 
The 10,000 people startup
The 10,000 people startupThe 10,000 people startup
The 10,000 people startup
 
Trading Risks - Innovation Copilots
Trading Risks - Innovation CopilotsTrading Risks - Innovation Copilots
Trading Risks - Innovation Copilots
 
Fab Mob livre 2017
Fab Mob livre 2017Fab Mob livre 2017
Fab Mob livre 2017
 
Should Mentors of Entrepreneurs be Trained or their Experience is Enough?
Should Mentors of Entrepreneurs be Trained or their Experience is Enough?Should Mentors of Entrepreneurs be Trained or their Experience is Enough?
Should Mentors of Entrepreneurs be Trained or their Experience is Enough?
 
Should entrepreneurial mentors be trained or is experience enough?
Should entrepreneurial mentors be trained or is experience enough?Should entrepreneurial mentors be trained or is experience enough?
Should entrepreneurial mentors be trained or is experience enough?
 
How to prepare for corporate incubation end of party
How to prepare for corporate incubation end of partyHow to prepare for corporate incubation end of party
How to prepare for corporate incubation end of party
 
When Corporate Meet Startups - 3 Key Mistakes
When Corporate Meet Startups - 3 Key MistakesWhen Corporate Meet Startups - 3 Key Mistakes
When Corporate Meet Startups - 3 Key Mistakes
 
Business Storytelling and Soft Power
Business Storytelling and Soft PowerBusiness Storytelling and Soft Power
Business Storytelling and Soft Power
 
Keynote "Les effets de bord de l'innovation" - merkapt 2016
Keynote "Les effets de bord de l'innovation" - merkapt 2016Keynote "Les effets de bord de l'innovation" - merkapt 2016
Keynote "Les effets de bord de l'innovation" - merkapt 2016
 
Strategic Mentoring [White Paper]
Strategic Mentoring [White Paper]Strategic Mentoring [White Paper]
Strategic Mentoring [White Paper]
 
Merkapt - Keynote LETI Days- Trading risk with startups
Merkapt - Keynote LETI Days- Trading risk with startupsMerkapt - Keynote LETI Days- Trading risk with startups
Merkapt - Keynote LETI Days- Trading risk with startups
 
From Manager to Entrepreneur
From Manager to EntrepreneurFrom Manager to Entrepreneur
From Manager to Entrepreneur
 
Manuel d'Oslo 2005
Manuel d'Oslo 2005Manuel d'Oslo 2005
Manuel d'Oslo 2005
 
Mechanics of Emotions
Mechanics of EmotionsMechanics of Emotions
Mechanics of Emotions
 
Le hold-up numérique
Le hold-up numériqueLe hold-up numérique
Le hold-up numérique
 
La jeune pousse nouvelle culture d’entreprise - Libération
La jeune pousse nouvelle culture d’entreprise - LibérationLa jeune pousse nouvelle culture d’entreprise - Libération
La jeune pousse nouvelle culture d’entreprise - Libération
 
TEDx Toulon Emotions at Work
TEDx Toulon Emotions at WorkTEDx Toulon Emotions at Work
TEDx Toulon Emotions at Work
 
Lift14 - Death Awaits You ALL - Open Session - Merkapt
Lift14 - Death Awaits You ALL - Open Session - MerkaptLift14 - Death Awaits You ALL - Open Session - Merkapt
Lift14 - Death Awaits You ALL - Open Session - Merkapt
 

Kürzlich hochgeladen

8447779800, Low rate Call girls in Kotla Mubarakpur Delhi NCR
8447779800, Low rate Call girls in Kotla Mubarakpur Delhi NCR8447779800, Low rate Call girls in Kotla Mubarakpur Delhi NCR
8447779800, Low rate Call girls in Kotla Mubarakpur Delhi NCRashishs7044
 
Enjoy ➥8448380779▻ Call Girls In Sector 18 Noida Escorts Delhi NCR
Enjoy ➥8448380779▻ Call Girls In Sector 18 Noida Escorts Delhi NCREnjoy ➥8448380779▻ Call Girls In Sector 18 Noida Escorts Delhi NCR
Enjoy ➥8448380779▻ Call Girls In Sector 18 Noida Escorts Delhi NCRalexsharmaa01
 
Innovation Conference 5th March 2024.pdf
Innovation Conference 5th March 2024.pdfInnovation Conference 5th March 2024.pdf
Innovation Conference 5th March 2024.pdfrichard876048
 
Organizational Structure Running A Successful Business
Organizational Structure Running A Successful BusinessOrganizational Structure Running A Successful Business
Organizational Structure Running A Successful BusinessSeta Wicaksana
 
Call US-88OO1O2216 Call Girls In Mahipalpur Female Escort Service
Call US-88OO1O2216 Call Girls In Mahipalpur Female Escort ServiceCall US-88OO1O2216 Call Girls In Mahipalpur Female Escort Service
Call US-88OO1O2216 Call Girls In Mahipalpur Female Escort Servicecallgirls2057
 
8447779800, Low rate Call girls in Shivaji Enclave Delhi NCR
8447779800, Low rate Call girls in Shivaji Enclave Delhi NCR8447779800, Low rate Call girls in Shivaji Enclave Delhi NCR
8447779800, Low rate Call girls in Shivaji Enclave Delhi NCRashishs7044
 
MAHA Global and IPR: Do Actions Speak Louder Than Words?
MAHA Global and IPR: Do Actions Speak Louder Than Words?MAHA Global and IPR: Do Actions Speak Louder Than Words?
MAHA Global and IPR: Do Actions Speak Louder Than Words?Olivia Kresic
 
Ten Organizational Design Models to align structure and operations to busines...
Ten Organizational Design Models to align structure and operations to busines...Ten Organizational Design Models to align structure and operations to busines...
Ten Organizational Design Models to align structure and operations to busines...Seta Wicaksana
 
Darshan Hiranandani [News About Next CEO].pdf
Darshan Hiranandani [News About Next CEO].pdfDarshan Hiranandani [News About Next CEO].pdf
Darshan Hiranandani [News About Next CEO].pdfShashank Mehta
 
8447779800, Low rate Call girls in New Ashok Nagar Delhi NCR
8447779800, Low rate Call girls in New Ashok Nagar Delhi NCR8447779800, Low rate Call girls in New Ashok Nagar Delhi NCR
8447779800, Low rate Call girls in New Ashok Nagar Delhi NCRashishs7044
 
Entrepreneurship lessons in Philippines
Entrepreneurship lessons in  PhilippinesEntrepreneurship lessons in  Philippines
Entrepreneurship lessons in PhilippinesDavidSamuel525586
 
Unlocking the Future: Explore Web 3.0 Workshop to Start Earning Today!
Unlocking the Future: Explore Web 3.0 Workshop to Start Earning Today!Unlocking the Future: Explore Web 3.0 Workshop to Start Earning Today!
Unlocking the Future: Explore Web 3.0 Workshop to Start Earning Today!Doge Mining Website
 
Cybersecurity Awareness Training Presentation v2024.03
Cybersecurity Awareness Training Presentation v2024.03Cybersecurity Awareness Training Presentation v2024.03
Cybersecurity Awareness Training Presentation v2024.03DallasHaselhorst
 
8447779800, Low rate Call girls in Uttam Nagar Delhi NCR
8447779800, Low rate Call girls in Uttam Nagar Delhi NCR8447779800, Low rate Call girls in Uttam Nagar Delhi NCR
8447779800, Low rate Call girls in Uttam Nagar Delhi NCRashishs7044
 
FULL ENJOY Call girls in Paharganj Delhi | 8377087607
FULL ENJOY Call girls in Paharganj Delhi | 8377087607FULL ENJOY Call girls in Paharganj Delhi | 8377087607
FULL ENJOY Call girls in Paharganj Delhi | 8377087607dollysharma2066
 
Guide Complete Set of Residential Architectural Drawings PDF
Guide Complete Set of Residential Architectural Drawings PDFGuide Complete Set of Residential Architectural Drawings PDF
Guide Complete Set of Residential Architectural Drawings PDFChandresh Chudasama
 
Chapter 9 PPT 4th edition.pdf internal audit
Chapter 9 PPT 4th edition.pdf internal auditChapter 9 PPT 4th edition.pdf internal audit
Chapter 9 PPT 4th edition.pdf internal auditNhtLNguyn9
 
Church Building Grants To Assist With New Construction, Additions, And Restor...
Church Building Grants To Assist With New Construction, Additions, And Restor...Church Building Grants To Assist With New Construction, Additions, And Restor...
Church Building Grants To Assist With New Construction, Additions, And Restor...Americas Got Grants
 
8447779800, Low rate Call girls in Saket Delhi NCR
8447779800, Low rate Call girls in Saket Delhi NCR8447779800, Low rate Call girls in Saket Delhi NCR
8447779800, Low rate Call girls in Saket Delhi NCRashishs7044
 

Kürzlich hochgeladen (20)

8447779800, Low rate Call girls in Kotla Mubarakpur Delhi NCR
8447779800, Low rate Call girls in Kotla Mubarakpur Delhi NCR8447779800, Low rate Call girls in Kotla Mubarakpur Delhi NCR
8447779800, Low rate Call girls in Kotla Mubarakpur Delhi NCR
 
Enjoy ➥8448380779▻ Call Girls In Sector 18 Noida Escorts Delhi NCR
Enjoy ➥8448380779▻ Call Girls In Sector 18 Noida Escorts Delhi NCREnjoy ➥8448380779▻ Call Girls In Sector 18 Noida Escorts Delhi NCR
Enjoy ➥8448380779▻ Call Girls In Sector 18 Noida Escorts Delhi NCR
 
Innovation Conference 5th March 2024.pdf
Innovation Conference 5th March 2024.pdfInnovation Conference 5th March 2024.pdf
Innovation Conference 5th March 2024.pdf
 
Organizational Structure Running A Successful Business
Organizational Structure Running A Successful BusinessOrganizational Structure Running A Successful Business
Organizational Structure Running A Successful Business
 
Call US-88OO1O2216 Call Girls In Mahipalpur Female Escort Service
Call US-88OO1O2216 Call Girls In Mahipalpur Female Escort ServiceCall US-88OO1O2216 Call Girls In Mahipalpur Female Escort Service
Call US-88OO1O2216 Call Girls In Mahipalpur Female Escort Service
 
Corporate Profile 47Billion Information Technology
Corporate Profile 47Billion Information TechnologyCorporate Profile 47Billion Information Technology
Corporate Profile 47Billion Information Technology
 
8447779800, Low rate Call girls in Shivaji Enclave Delhi NCR
8447779800, Low rate Call girls in Shivaji Enclave Delhi NCR8447779800, Low rate Call girls in Shivaji Enclave Delhi NCR
8447779800, Low rate Call girls in Shivaji Enclave Delhi NCR
 
MAHA Global and IPR: Do Actions Speak Louder Than Words?
MAHA Global and IPR: Do Actions Speak Louder Than Words?MAHA Global and IPR: Do Actions Speak Louder Than Words?
MAHA Global and IPR: Do Actions Speak Louder Than Words?
 
Ten Organizational Design Models to align structure and operations to busines...
Ten Organizational Design Models to align structure and operations to busines...Ten Organizational Design Models to align structure and operations to busines...
Ten Organizational Design Models to align structure and operations to busines...
 
Darshan Hiranandani [News About Next CEO].pdf
Darshan Hiranandani [News About Next CEO].pdfDarshan Hiranandani [News About Next CEO].pdf
Darshan Hiranandani [News About Next CEO].pdf
 
8447779800, Low rate Call girls in New Ashok Nagar Delhi NCR
8447779800, Low rate Call girls in New Ashok Nagar Delhi NCR8447779800, Low rate Call girls in New Ashok Nagar Delhi NCR
8447779800, Low rate Call girls in New Ashok Nagar Delhi NCR
 
Entrepreneurship lessons in Philippines
Entrepreneurship lessons in  PhilippinesEntrepreneurship lessons in  Philippines
Entrepreneurship lessons in Philippines
 
Unlocking the Future: Explore Web 3.0 Workshop to Start Earning Today!
Unlocking the Future: Explore Web 3.0 Workshop to Start Earning Today!Unlocking the Future: Explore Web 3.0 Workshop to Start Earning Today!
Unlocking the Future: Explore Web 3.0 Workshop to Start Earning Today!
 
Cybersecurity Awareness Training Presentation v2024.03
Cybersecurity Awareness Training Presentation v2024.03Cybersecurity Awareness Training Presentation v2024.03
Cybersecurity Awareness Training Presentation v2024.03
 
8447779800, Low rate Call girls in Uttam Nagar Delhi NCR
8447779800, Low rate Call girls in Uttam Nagar Delhi NCR8447779800, Low rate Call girls in Uttam Nagar Delhi NCR
8447779800, Low rate Call girls in Uttam Nagar Delhi NCR
 
FULL ENJOY Call girls in Paharganj Delhi | 8377087607
FULL ENJOY Call girls in Paharganj Delhi | 8377087607FULL ENJOY Call girls in Paharganj Delhi | 8377087607
FULL ENJOY Call girls in Paharganj Delhi | 8377087607
 
Guide Complete Set of Residential Architectural Drawings PDF
Guide Complete Set of Residential Architectural Drawings PDFGuide Complete Set of Residential Architectural Drawings PDF
Guide Complete Set of Residential Architectural Drawings PDF
 
Chapter 9 PPT 4th edition.pdf internal audit
Chapter 9 PPT 4th edition.pdf internal auditChapter 9 PPT 4th edition.pdf internal audit
Chapter 9 PPT 4th edition.pdf internal audit
 
Church Building Grants To Assist With New Construction, Additions, And Restor...
Church Building Grants To Assist With New Construction, Additions, And Restor...Church Building Grants To Assist With New Construction, Additions, And Restor...
Church Building Grants To Assist With New Construction, Additions, And Restor...
 
8447779800, Low rate Call girls in Saket Delhi NCR
8447779800, Low rate Call girls in Saket Delhi NCR8447779800, Low rate Call girls in Saket Delhi NCR
8447779800, Low rate Call girls in Saket Delhi NCR
 

Identifying and spurring high growth entrepreneurship: Experimental evidence from a business plan competition

  • 1. American Economic Review 2017, 107(8): 2278–2307 https://doi.org/10.1257/aer.20151404 2278 Identifying and Spurring High-Growth Entrepreneurship: Experimental Evidence from a Business Plan Competition† By David McKenzie* Almost all firms in developing countries have fewer than ten work- ers, with a modal size of one. Are there potential high-growth entre- preneurs, and can public policy help identify them and facilitate their growth? A large-scale national business plan competition in Nigeria provides evidence on these questions. Random assignment of US$34 million in grants provided each winner with approximately US$50,000. Surveys tracking applicants over five years show that winning leads to greater firm entry, more survival, higher profits and sales, and higher employment, including increases of over 20 per- centage points in the likelihood of a firm having ten or more workers. (JEL D22, L11, L26, L53, M13, O14) The modal firm size in most developing countries is one worker, consisting of only the owner of the firm. Among the firms that do hire additional workers, most hire fewer than ten. Hsieh and Olken (2014, p. 93) report that in India and Indonesia “the fraction of firms with less than 10 workers is almost visually indistinguishable from 100 percent.” Likewise in Nigeria, survey data indicate that 99.6 percent of firms have fewer than ten workers.1 This is in sharp contrast to the United States, where the modal manufacturing firm has 45 workers (Hsieh and Klenow 2014), and is a puzzle to standard models of the firm size distribution (Lucas 1978) unless the distribution of entrepreneurial talent is very limited in developing countries. The move away from self-employment toward wage employment in firms of larger sizes is a key aspect of the development process (e.g., Gollin 2002). This raises the key policy questions of whether there are constrained entrepreneurs in developing 1  Analysis of nonfarm enterprises from the 2012/2013 Living Standards Measurement Study, kindly provided by Johanne Buba.  * Development Research Group, the World Bank, MSN MC3-307, 1818 H Street NW, Washington, DC 20433 (email: dmckenzie@worldbank.org). I thank DFID, the World Bank, the WLSME trust fund, and the John Templeton Foundation for funding this study, Halima Zarma and Yuvraj Pathak for research assistance, Michael Wong and Anthea Dickie for their work and advice on the operational side of this project, and Muyi Aina and Olasupo Olusi for their advice on how the program operated in practice. Comments from five anonymous ref- erees, Lorenzo Casaburi, Giacomo de Giorgi, Antoinette Schoar, and seminar participants at CGD, Columbia, Georgetown, HBS, HECER, the IPA-SME conference, ITAM, Oxford, the NBER, Stanford, Wharton, the World Bank, and the Youth Employment Summit in Abuja are greatly appreciated. A pre-analysis plan for this work was first registered in the J-PAL hypothesis registry on November 14, 2012, and subsequently in the AEA trial reg- istry (AEA-RCTR-0000078) on September 24, 2013, and in the Registry for International Development Impact Evaluations (RIDIE) on October 10, 2013 (RIDIE-STUDY-ID-52559be5a72eb). All views expressed are those of the author and do not necessarily reflect those of the World Bank.  †  Go to https://doi.org/10.1257/aer.20151404 to visit the article page for additional materials and author disclosure statement.
  • 2. 2279McKenzie: Identifying and Spurring EntrepreneurshipVOL. 107 NO. 8 countries with the ability to grow a firm beyond this 10-worker threshold, and if so, whether policy can identify such individuals in advance and overcome their con- straints to growth. I investigate these questions through the context of an evaluation of the impact of a national business plan competition in Nigeria. The YouWiN! competition was launched in late 2011 by the president of Nigeria, and in its first year attracted almost 24,000 applications aiming to start a new business or expand an existing one. The top 6,000 applications were selected for a 4-day business plan training course, and then winners were chosen to receive awards averaging US$50,000 each, paid out in four tranche payments conditional on achieving basic milestones. The top-scoring plans overall and within region were chosen as winners automatically, and then 729 additional winners were randomly selected from a group of 1,841 semifinalists, providing experimental variation from US$34 million in grants that enables causal estimation of the program’s impact. Three annual follow-up surveys enable tracking the trajectory of impacts, with the third survey occurring 27 months after winners received their first grant payment and 12 to 18 months after the last payment. A final survey round conducted during an economic crisis in 2016 enables examination of impacts three years after all payments. I find that winning this competition has large positive impacts on both applicants looking to start new firms as well as those aiming to expand existing firms. Three years after applying, new firm applicant winners were 37 percentage points more likely than the control group to be operating a business and 23 percentage points more likely to have a firm with ten or more workers (relative to a control mean of 11 percent), while existing firm winners were 20 percentage points more likely to have survived, and 21 percentage points more likely to have a firm with ten or more workers (relative to a control mean of 17 percent). The winners are also innovating more, and are earning higher sales and profits. There continue to be sig- nificant impacts more than three years after all payment, during an economic crisis, although the magnitudes are smaller. Examining the channels of impact, I find the grants enabled firms to purchase more capital and hire more labor, with no changes in business networks, mentors, self-efficacy, or uses of other sources of finance. The results show there is a group of constrained entrepreneurs with the ability to grow their businesses beyond a small scale, and that the business plan competition was successful in both attracting such individuals, and in helping them overcome their constraints. This paper contributes to three main literatures. The first addresses the sources and constraints to job growth, which is one of the most fundamental concerns of policymakers globally. An increasing body of work examines which types of firms create more jobs, with recent evidence highlighting the importance of business start- ups and young firms in job creation.2 Related work has found that a small number of firms, variously termed “gazelles,” “high-growth entrepreneurs,” or “high-impact firms” represent a tiny fraction of the overall firm population, but make a dispropor- tionately large contribution to job growth.3 New job creation by firms is of particular 2  See, for example, Haltiwanger, Jarmin, and Miranda (2013) for the United States, and Ayyagari, Demirguc-Kunt, and Maksimovic (2014) for evidence from a range of developing countries.  3  See reviews by Henrekson and Johannsson (2010) and the OECD (2010). 
  • 3. 2280 THE AMERICAN ECONOMIC REVIEW AUGUST 2017 importance in sub-Saharan Africa given that it currently has the lowest share of the labor force in wage work of any region in the world, and that demographic forces result in the working-age population growing 2.8 percent per year (ILO 2012). A long literature suggests that a perceived lack of high-growth entrepreneurship in many African countries (e.g., Elkan 1988; Omidyar Network 2013) may be in part due to multiple market failures that prevent individuals with good ideas from fund- ing them. This paper provides empirical evidence that there are such potential high growth entrepreneurs who can grow rapidly if funded. Business plan competitions are starting to become one popular tool that seeks to foster high growth entrepreneurship. They seek to identify individuals with prom- ising ideas and the aspiration to grow, help these individuals formalize these ideas through getting them to develop a detailed business plan, and then spur the devel- opment of some of these potentially high growth firms through providing financing to the winners. While the first such competitions were held for business school stu- dents in the United States they are now increasingly being used in developing coun- tries.4 Examples include the MENA 100 business plan ­competition in 14 countries in the Middle East and North Africa since 2009, the GIST/I-Dare business plan competition for individuals from 28 developing countries, launched in 2011; and business plan competitions run by Technoserve throughout Central America since 2002 (Klinger and Schündeln 2011). They are also starting to be used by the World Bank in several sub-Saharan African countries, including Côte d’Ivoire, Gabon, Guinea-Bissau, Rwanda, Senegal, Somalia, South Sudan, Tanzania, and Uganda. However, there is very little evidence as to the effectiveness of these programs. Many of the programs are small in nature, awarding fewer than ten prizes in any given year, limiting the sample size for evaluation. Programs explicitly try to select entrepreneurs with the best growth prospects, so that any comparison of winners and losers is likely to overstate the effects of the program due to selection bias. Klinger and Schündeln (2011) and Fafchamps and Quinn (forthcoming) attempt to address these issues by pooling together competitions run in multiple countries to get larger sample sizes of winners (although still fewer than 40 cash winners in either study), and use a regression-discontinuity approach to compare winners to those who just finished below them in rank. Both studies find impacts on business start-up or expan- sion, and Fafchamps and Quinn (forthcoming) also find increased job creation in the first six months. In the one experimental study we are aware of, Fafchamps and Woodruff (2016) run a small business plan competition in Ghana, in which winners are selected to receive individualized training, but not cash. They find no significant impact of this individualized training on firm growth. This paper builds on this lit- erature through experimental evaluation of a much larger sample, with substantial prizes, detailed surveys, and a longer time period for tracking winners. Finally this paper adds to a literature on how to generate entrepreneurship in developing countries, and in particular the role of capital in alleviating constraints.5 The vast majority of this work has focused on microenterprises, typically with no 4  Lora Kolodny, “How to Win a Business Plan Competition,” New York Times, June 10, 2009, http://www. nytimes.com/2009/06/11/business/smallbusiness/11competition.html (accessed March 18, 2014). 5  The paper also contributes to a related debate in the literature as to whether a lack of capital constrains entre- preneurs from growing and hiring employees, or whether it is other factors such as labor regulations, management ability, and the possibility that “transformational” entrepreneurs who aim to create large, vibrant businesses that
  • 4. 2281McKenzie: Identifying and Spurring EntrepreneurshipVOL. 107 NO. 8 employees, with the emphasis on starting such businesses, and/or growing the incomes of their owners. This is the case with work testing small grants of US$100 to US$200 to existing businesses (e.g., De Mel, McKenzie, and Woodruff 2008; McKenzie and Woodruff 2008; Fafchamps et al. 2014; Karlan, Knight, and Udry 2015); ultra-poor programs providing grants and training to get very poor people to start businesses (e.g., Banerjee et al. 2015; Bandiera et al. 2017); and business train- ing programs for microenterprises (reviewed in McKenzie and Woodruff 2014). Blattman, Fiala, and Martinez (2014) considers a program in Uganda where groups received grants of approximately US$382 per member, and finds this generates increases in skilled self-employment and in incomes for the recipients, but only minor increases in employment in these firms. Fafchamps and Quinn (forthcoming) provide grants of US$1,000 to their 39 winners. The grants studied here of almost US$50,000 per recipient are 50 to 500 times as large as the grants in these earlier studies. This difference in size is important for two reasons. First, even a standard concave production function with a low steady-state optimal size can exhibit high returns to capital for the first few dollars invested, so the fact that marginal returns from small grants have been high need not imply that capital is the constraint to growing larger firms who hire workers. Second, since the lending cost per dollar lent falls with loan size, credit market frictions are expected to be particularly binding for small loans, and one therefore might expect credit constraints to be less binding for larger invest- ments. If credit constraints don’t bind, then theory would predict the grants would merely supplement the wealth of business owners without changing their production decisions. Even with credit constraints, there is a question as to whether diminishing returns to capital results in grants of this size being far more than is needed to move businesses to their efficient size. The results in this paper show that the business plan competition is successful in identifying entrepreneurs with the potential to use these large amounts of capital, and that with this capital, they are able to generate enterprises that hire employees and exhibit rapid growth. I.  The Business Plan Competition The Youth Enterprise With Innovation in Nigeria (YouWiN!) program is a busi- ness plan competition for young entrepreneurs in Nigeria.6 It is a collaboration between the Ministry of Finance, the Ministry of Communication Technology, and the Ministry of Youth Development with support from the Department for International Development (DFID) and the World Bank. It has the stated objec- tive of encouraging innovation and job creation through the creation of new busi- nesses and expansion of existing businesses. It was formally launched on October 11, 2011 by President Goodluck Jonathan in a ceremony aired live over the National Television network, and advertised through a variety of media events, roadshows, grow and hire workers are fundamentally different from owners of microenterprises (Schoar 2010). The evidence here shows that there are individuals for whom capital is the key constraint.  6  The business plan competition was run in four consecutive years. My analysis uses the first year of the pro- gram, which was the only year a randomized experiment was implemented. 
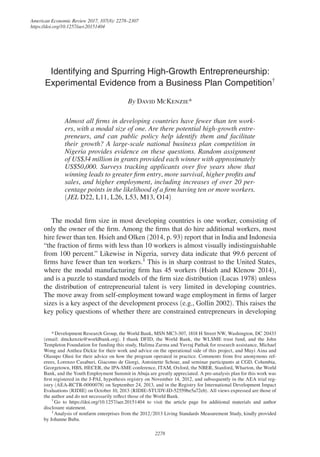
  • 5. 2282 THE AMERICAN ECONOMIC REVIEW AUGUST 2017 and small and medium enterprise (SME) outreach events. Online Appendix 1 details the timeline of the project. The program provides a four-day training course on preparation of a business plan to applicants who make it through a first stage, and then grants to the winning 1,200 submissions, with each winner eligible for an amount up to 10 million naira (approximately US$64,000), with the amount any winner getting varying between 1 and 10 million naira depending on the funding needs identified in their business plan and the assessment of independent consultants of what the actual needs are. Winners also receive ongoing monitoring as the grant is paid in four tranches, coupled with some potential mentoring and two additional two-day group training events.7 Figure 1 provides a schematic of the different phases of the competition. I sum- marize the key aspects of these in the text, with additional details provided in online Appendix 2. A. Eligibility and the First Stage Application To be eligible for the program, applicants had to be Nigerian citizens aged 40 or younger, proposing the creation of a new or expansion of an existing business venture within Nigeria that would employ Nigerians, and which did not involve the production or distribution of weapons, alcohol, tobacco, or gambling. They then needed to register on a website and submit an application by November 25, 2011. This application included basic personal information, proof of age and nationality, the proposed location of the business, along with information about their business idea (online Appendix  2 provides further details). Applicants were divided into six regional pools on the basis of the geopolitical zone in which they wanted to do business, with training also taking place in these different regional locations. 23,844 applications were received, of which 3,614 (15 percent) were for existing business expansions and 20,230 were for new businesses. A minority of applicants were female: 18.5 percent of new business applicants and 14.9 percent of existing business applicants were female. B. Application Scoring Applications were scored by the Enterprise Development Center (EDC) of the Pan-African University, a sister institution of the Lagos Business School. Names and other identifying information were removed before scoring to increase the impartiality of this process. Marks were given for the quality and viability of the business idea, the amount of job creation likely, the abilities and market understand- ing of the applicant, and the passion and commitment displayed in the application, and the likelihood of the proposed business succeeding. This first stage marking was a rapid assessment (taking approximately ten minutes per plan) given the vast num- ber of applications and the short window for assessment before training was to start. There was a conscious decision to favor existing businesses over new ­businesses 7  A pool of volunteer mentors were available, although as we will see, the winners appear to have received no more mentoring than the control group. The additional training consisted of two 2-day bootcamps run by the UK school for start-ups covering cash-flow management, sales, purchasing, and team management. 
  • 6. 2283McKenzie: Identifying and Spurring EntrepreneurshipVOL. 107 NO. 8 throughout the competition given the assumption that they had at least made the first step of establishing a business. An algorithm was then used to select 6,000 candi- dates for the business plan training on the basis of location, type of business (new or existing), and score. C. Business Plan Training Business plan training took place between December 6 and December 20, 2011. Each of the six regions had a local training location. Of the 6,000 individuals selected to attend training, 4,873 attended (81 percent). The rapid rollout of the program and short amount of time (1–2 weeks) between notification of selection into the 4-day training session and it taking place is a likely reason for nonattendance. Biometric data (iris scans and fingerprints) were collected on all attendees to enable accu- rate identification of individuals. Candidates who did not attend training were not Figure 1. Competition Stages and Treatment Assignment Notes: Regression-discontinuity sample of firms around the cutoff for being chosen for business plan training not shown. Non-experimental winner sample is only used for matching estimates in online Appendix 5. Survey num- bers are for having data on firm operation. Online Appendix 8 provides other data on attrition. First round application 23,844 firms (3,614 existing, 20,230 new) Top 6,000 chosen for 4-day business plan training with scoring cutoffs varying by region and new/existing 6,000 firms (1,254 existing, 4,746 new) 4,873 attend training Submit detailed business plan for scoring 4,510 firms (981 existing, 3,529 new) Semi-finalists chosen on basis of score, with thresholds varying by region and new/existing 2,400 firms (596 existing, 1,804 new) Non-experimental winners (selected on highest scores overall and within region, with preference for existing) 475 firms 357 existing 118 new Experimental Sample Dropped if score <30 79 firms disqualified 5 firms (randomly selected within strata defined by region, gender, and new/existing) 1,841 firms (541 existing, 1,300 new) 729 treatment (278 existing, 451 new) 1,112 control (263 existing, 849 new) Follow-up surveys Follow-up 1: 396 firms Follow-up 2: 439 firms Follow-up 3: 417 firms Follow-up surveys Follow-up 1: 617 treat, 836 control Follow-up 2: 645 treat, 917 control Follow-up 3: 674 treat, 1011 control
  • 7. 2284 THE AMERICAN ECONOMIC REVIEW AUGUST 2017 ­eligible to submit a business plan. Online Appendix 2 provides detail on the content of the course. D. Business Plan Submission and Business Plan Scoring Applicants who had attended the training had until January 22, 2012 to sub- mit the business plan. The business plan required much more detail than the first round ­concept note. In total 4,510 business plan applications were received, which is 92.5 percent of those who attended the training. The business plans were then scored by a joint EDC/PricewaterhouseCoopers team, with a team of 20 markers split evenly between the two organizations. Marking criteria were developed which focused on the market, management skills, business experience, articulating the risks and financing needs of the business, and job creation and cash flow prospects. A typical plan took 30–45 minutes to mark. E. Selection of Winners The business plans were narrowed down to 2,400 semifinalists by first selecting the highest scoring 450 existing businesses and highest scoring 150 new businesses nationwide, and then selecting the top scoring 300 plans per region after taking out these national top scores. Then from these 2,400 semifinalists, the following groups of winners were selected: • 300 National Merit Winners: The 225 top-scoring existing business plans and 75 top-scoring new business plans nationwide were selected as national win- ners. This was done to ensure the highest-scoring proposals on pure merit were selected. • 180 Zonal Merit Winners (30 per region):After removing the 300 national merit winners, the highest-scoring 45 existing business plans and 15 new business plans per zone were selected as zonal finalists. Their proposals were reviewed by panelists of local entrepreneurs and local business leaders in each zone, who identified the best 30 out of the 60 zonal finalists to be zonal merit award win- ners. The zonal finalists who were not selected were then placed back into the pool and were eligible to be selected as ordinary merit winners. • 720 Ordinary Merit Winners (120 per region): 120 ordinary winners per region were randomly selected from among the remaining 1,920 semifinalists using the lottery procedure described below. F. Randomization Algorithm Random selection of the ordinary winners was done for two main reasons. First, from an operational point of view, a competition run at this scale is not feasible to do with presentations in front of judges, and it was recognized that there would be inherent uncertainty in the scoring as to which applicants were best amongst the semifinalists. Moreover, in many developing countries there are concerns that programs get captured by individuals with certain political or ethnic ties, and it was felt randomizing gives people a fair chance and is less subject to this
  • 8. 2285McKenzie: Identifying and Spurring EntrepreneurshipVOL. 107 NO. 8 ­perception risk.8 Second, random assignment enabled rigorous measurement of the program’s impacts. The randomization procedure was designed as follows. First, among the semifi- nalists, all those with business plan total scores below 30 were dropped, to ­maintain a minimum standard. This reduced the pool from 1,920 to 1,841 firms. Then a two-step stratified randomization was conducted by the author in STATA to choose the ordinary winners: (i) First, within each region, half of the existing firm business plans were ran- domly chosen to be ordinary winners, with this selection stratified by gender. This reflected the preference of the government to again oversample existing business plans. (ii) Then, the number of slots for new firm business plans was calculated per zone as 120 minus the number of existing business ordinary winners. This was subdivided into a number of slots for new businesses operated by men and new businesses operated by women in proportion to the share of women among new businesses in the pool in each region. Then the number of new firms dictated by the number of remaining slots was randomly chosen from the number of new firm semifinalists in each region and gender strata. This gives an ordinary winner treatment group of 720 firms and an ordinary win- ner control group of 1,121 firms. After quality checking which disqualified some winners, and redrawing of replacements (see online Appendix 2), of the 1,841 firms in the ordinary winner pool, we have a treatment group of 729 randomly assigned to treatment (of which 13 were disqualified). The control group consists of the 1,112 firms randomly assigned to the control group (after the random replacement), of which 9 were nonrandomly selected to actually receive treatment. In terms of the impact evaluation, this will be handled through assignment to treat analysis. G. Award Amounts and Payment The amounts awarded were payable in four tranche payments. The first pay- ment was typically around 10 percent of the total amount, with a second tranche payment averaging 45 percent of the total then payable for the purpose of physi- cal capital acquisition and working capital. The third and four tranche payments were made conditional on employment and sales turnover triggers that were set individually for each firm based on their business plan projections. These triggers were deliberately set to be quite low, and were intended to ensure the business was set up and producing. The third tranche payment required sales turnover to have reached 25 percent of the first-year target annualized turnover set out in the business plan, with ­firm-specific employment triggers that averaged 3.7 workers. The fourth tranche payment required sales turnover to have reached 40 percent of the ­first-year 8  However, the fact that the ordinary winners were randomly chosen from amongst semifinalists was not announced to applicants; but rather was information that could be used in case of a complaint. 
  • 9. 2286 THE AMERICAN ECONOMIC REVIEW AUGUST 2017 annualized turnover goal, with firm-specific employment triggers that averaged 5.5 workers. Online Appendix 3 summarizes the award amounts received by the winners. The mean (median) winner received a total award of US$49,000 (US$57,000). Only 6 of the 1,200 winners received no payment (due to being disqualified, or in one case, withdrawing). A total of 1,168 winners (97.3 percent), including 96.8 percent of the experimental winners, received all four tranche payments, but the length of time taken to receive all four tranches varied across firms: 748 of the firms received their last tranche payment in June or July 2013, while the last 33 recipients got their last tranche in January 2014. II.  Verification of Random Assignment and Data Collection A. Verification of Randomization and Characteristics of Winning Firms Table 1 presents summary statistics for the treatment and control groups accord- ing to assignment to treatment status for new and existing firms, as well as the characteristics of the non-experimental winners. The goal of the randomization is to ensure that the treatment and control groups are similar in terms of average char- acteristics. This is tested formally through an F-test of joint orthogonality, which tests whether the observable characteristics in Table 1 are jointly unrelated to treat- ment status. We cannot reject this null hypothesis, confirming that randomization has delivered balanced groups. In contrast the test rejects that the observable char- acteristics of the national and zonal winners are similar to those of the experimental sample, even when excluding the business plan scores used to separate the groups. Table 1 is also useful for showing some basic characteristics of the experimen- tal sample. We see the average existing firm owner is male, aged 32, with 4 years of business experience and running a business with a median of 5 workers. Half are married, and 10 percent have previously worked or lived abroad, and 65 per- cent have university education. Only 7 percent have ever had a formal loan before for their business. New applicants are slightly younger, with an average age of 29, 70 percent have university education, and they have higher business plan scores than the existing firm applicants on average, reflecting the preference for existing firm applicants at each stage. We see they come from relatively well-off households, with 85 percent having a computer at home and two-thirds having a satellite dish. The most common business sectors are manufacturing and crop and animal produc- tion, sector is looked at in more detail below. The mean (median) annual turnover for existing businesses in the experimental sample is 5.6 million naira (1.5 million naira). The maximum grant of 10 million naira thus represents two years of turnover for the mean firm and more than six years for the median firm. Online Appendix 4 summarizes the main sectors that YouWiN! winners propose to operate their businesses in, based on the self-classification of applicants at the time of submitting their business plans. Agricultural production activities is the largest sector, accounting for one-third of winning new business applications and 20 percent of existing business applications. Typical examples include plans to set up or expand poultry or catfish farms, and production of cashews, palm oil, and cassava. The second most common sector for existing firms is IT and computer
  • 10. 2287McKenzie: Identifying and Spurring EntrepreneurshipVOL. 107 NO. 8 ­services, comprising 17 percent of existing firm winners, but only 7 percent of new firm winners. Typical examples include software and website development, repairs and installation, and computer training courses. Manufacturing is the second most common sector for new firms, comprising 13 percent, and third most common for existing firms, comprising 14 percent of winners. The products being manufactured are very heterogeneous, and include processed food products, books and media, metal products, chemicals and detergents, and a range of other products. Other industries includes a variety of different activities such as advertising, teaching, event ­management, photography, and filmmaking, as well as some activities that were a mix of other categories. B. Data Collection The follow-up surveys targeted the 729 individuals selected as ordinary win- ners of the competition (the experimental treatment group), the 1,112 individu- als in the experimental control group, as well as also surveying the 475 national Table 1—Baseline Characteristics and Balance of Experimental Sample Existing firms New firms Non- experimental winners Treatment group Control group Non- experimental winners Treatment group Control group Applicant characteristics Female 0.17 0.18 0.17 0.19 0.17 0.18 Age 32.5 32.0 31.8 30.1 29.3 29.6 Married 0.60 0.50 0.56 0.42 0.34 0.36 High school or lower 0.10 0.13 0.12 0.06 0.11 0.10 University education 0.71 0.63 0.67 0.79 0.69 0.71 Postgraduate education 0.12 0.08 0.12 0.13 0.05 0.06 Lived abroad 0.14 0.10 0.11 0.18 0.06 0.09 Choose risky option 0.59 0.56 0.52 0.63 0.57 0.55 Have internet access at home 0.68 0.57 0.61 0.60 0.47 0.48 Own a computer 0.94 0.87 0.88 0.92 0.84 0.86 Satellite dish at home 0.74 0.67 0.71 0.64 0.68 0.64 Freezer at home 0.64 0.57 0.61 0.63 0.51 0.55 Business characteristics Crop and animal sector 0.14 0.16 0.16 0.22 0.22 0.22 Manufacturing sector 0.28 0.28 0.26 0.23 0.28 0.24 Trade sector 0.05 0.06 0.05 0.06 0.04 0.04 IT sector 0.14 0.15 0.14 0.04 0.07 0.06 First round application score 59.0 57.2 56.6 59.9 59.9 59.9 Business plan score 61.7 45.8 45.4 74.4 53.7 55.5 Number of workers 9.11 7.35 7.73 Ever had formal loan 0.11 0.06 0.09 Sample size 357 278 263 118 451 849 Joint orthogonality test: treatment   versus control 0.920 0.884 Joint orthogonality test: non-experimental   versus treatment 0.000 0.000 Joint orthogonality test: non-experimental   versus treatment (no score) 0.012 0.000 Notes: p-values shown for joint orthogonality tests. Test for comparison of treatment and control conditions on regional strata. Existing firms and new firms refer to status at time of application. (no score) indicates the joint orthogonality test is conducted excluding the first round application score and business plan score.
  • 11. 2288 THE AMERICAN ECONOMIC REVIEW AUGUST 2017 and zonal winners (excluding the 5 disqualified), and a sample of 823 applicants who had scores just on either side of the cutoff used to select people to attend the 4-day ­business training course. These latter two groups are used for propensity score matching analysis of the impact of the program on non-experimental win- ners (online Appendix 5), and regression-discontinuity analysis of the impact of the business plan training alone (online Appendix 6). Three annual follow-up surveys were taken, followed by a fourth, longer-term follow-up which is discussed in Section VI. Surveys took place nationwide via face-to-face interviews, supplemented by telephone interviews and web interviews when security concerns prevented travel, and to boost response rates. Surveys were conducted by TNS RMS Nigeria. In addition, an attempt was made through proxy interviews and two question interviews with refusals to ascertain whether individu- als who could not be contacted or had refused were currently operating a business, and if so, the number of employees they had. Online Appendix 7 discusses the survey methodology in more detail and shows robustness of results to controls for survey type. The first follow-up survey took place between November 2012 and May 2013. This corresponds to approximately one year after individuals had first applied to the program, 8 months or more after the winners had been announced, and an aver- age of 5 to 6 months since the winners received their first tranche payment. The median firm had received 4,000,000 naira ($US25,000) by the time of this survey. The response rate for the experimental sample was 75.6 percent (81.2 percent for treatment, 71.9 percent control). The second follow-up survey took place between October 2013 and February 2014, approximately two years after application and just as firms had received their last tranche payments. This was an even more intensive effort in data collection, and achieved an 88.9 percent response rate (91.5 percent for treatment, 87.2 per- cent for control).9 The third follow-up survey took place between September 2014 and February 2015. This corresponds to 3 years after application, and between 12 and 18 months after firms had received their last tranche payment from the pro- gram. The response rate was 83.1 percent (87.0 percent for treatment, 80.5 percent for control). Online Appendix 8 reports further breakdowns on attrition by applicant type and treatment status. It then examines robustness to attrition in several ways. First, it shows that the responding sample remains balanced on baseline observable characteristics. Then it shows robustness to three different bounding approaches, to controlling for the application and business plan score, and to filling in missing data based on past operating status. The main results are robust to all but the worst case bounds, and even these bounds, which assume that all attritting control firms would be operating and all attritting treated firms would be closed, still show a positive treatment impact on business operation and on having more than ten employees. 9  Moreover, some of those not interviewed in round 2 were interviewed in round 1, so there are only 4 percent of the experimental sample for which we have no follow-up data in either of the first two rounds. 
  • 12. 2289McKenzie: Identifying and Spurring EntrepreneurshipVOL. 107 NO. 8 III.  Measuring the Impact of the Business Plan Competition: Theory and Empirical Approach The main objective of theYouWiN! program was to generate jobs by encouraging and supporting aspiring entrepreneurial youth in Nigeria to develop and execute business ideas. I discuss first what theory suggests the likely impacts of the program will be, and then the empirical approach to measuring these impacts. Both the theory and empirical approach set out here were prespecified in advance through a regis- tered pre-analysis plan.10 A. Theory: How Might Participating in the YouWiN! Program Lead to More Jobs and Higher Profits? I consider a simple partial equilibrium model that provides a framework for understanding how the YouWiN! program might affect the performance of individ- ual firms. This model is intended as a vehicle for organizing thoughts, rather than a fully specified model to calibrate. In complementary work, Buera, Kaboski, and Shin (2014, 2016) specify and calibrate macro models of occupational choice and entrepreneurship which they use to attempt to explain the impacts of different asset grant interventions (including this paper). Their results point to the importance of heterogeneity in talent, and financial frictions, but they are unable to explain the sustained increases in income seen amongst grants to microenterprises, nor changes in the size distribution of firms. Consider a simple model where a firm’s production Y is a function f ( · ) of their productivity A, their capital stock K, the owner’s entrepreneurial skill E, and outside labor L.11 The firm owner’s problem is to choose K and L given A and E:12 (1) ​Y = f ​(A, K, E, L)​​. With complete markets the firm production decision will be separable from the household consumption decision and firms will choose capital and labor such that their marginal products are equal to the market interest rate and market wage rate, respectively, (2) ​​f ​K​​​(A, ​K​​ ∗ ​, E, ​L​​ ∗ ​)​  =  r​, (3) ​​f​   L​​​(A, ​K​​ ∗ ​, E, ​L​​ ∗ ​)​  =  w​. 10  See https://www.socialscienceregistry.org/docs/analysisplan/25/document. 11  This model focuses on the implications for firm size, conditional on running a firm. For a model of the firm entry decision, see the online Appendix of Blattman, Fiala, and Martinez (2014). Similar to the model here, they note that an unrestricted grant will have no effect on the entry decision, and there is no permanent impact of a con- ditional grant on occupational choice without credit constraints.  12  In this simple model A, E, and f ( · ) are exogenous. However, some components of these can be chosen by firms by purchasing new technologies, hiring consultants to implement new processes, etc. For the purposes of this simple model, I consider these part of the choice of capital stock, and then the implications of the model are similar for these. 
  • 13. 2290 THE AMERICAN ECONOMIC REVIEW AUGUST 2017 In such a model, firm size is then completely determined by the talents of the firm owner, as in the seminal model of Lucas (1978). The answer in this simple model to the puzzle of why there are so many one-person firms in developing countries and so few larger firms (Hsieh and Olken 2014) is then that single person enterprises are the optimal scale given the talent of most of those engaging in entrepreneurship in these countries. I then examine the predictions of such a model for how YouWiN! should affect the production and firm size of winners. Case 1 (Perfect Markets, YouWiN! Program Is Just a Grant): If firms are not credit-constrained and the program just changes the resources firm owners have available to them, then there is no change in the first-order conditions (2) and (3), and so no change in employment or output. The grant will merely make the owner richer, but not change their production decisions. This possibility is often a key concern of policymakers in any grants program, and is referred to as a lack of addi- tionality, with the program just funding activities firms were going to do anyway. Case 2 (Perfect Markets, YouWiN! Program Is a Conditional Grant): The YouWiN! program does not make a single lump sum grant to firm owners, but instead is payable in tranches, conditional on the firm owner taking certain actions—with the first and second tranches typically paying for more working capital and invest- ment, and the third and fourth tranches being triggered by reaching jobs and turn- over triggers. This conditionality does not fundamentally change the equilibrium first-order conditions, but can be viewed as causing a temporary increase in the returns to capital and labor in the firm. Therefore we would predict a short-term increase in capital and labor, which would then dissipate once all the tranche pay- ments have been received. Once the final payments are received, we should see no difference between treatment and control firms as the treated firms reduce capital and labor to get back to the equilibrium levels.13 Case 3 (YouWiN! Program is More Than Just a Grant): It is possible that par- ticipating in, and especially winning, the YouWiN! program may also have other impacts on the productivity of the firm (A), and the skills of the owner (E ). The training offered could increase the entrepreneurial skills of the owner, although since the business plan training was also provided to the control group, this should change the ­first-order conditions similarly for both groups, and it would only be if the small amount of additional training increased skills that we should see a treat- ment effect. If winning enables firm owners to meet other business owners or gain mentors, this could increase A and E. Winning might also change the confidence and attitudes, spurring the self-belief of the owner in the business and causing them to work harder; or alternatively, may dent the confidence of the control group. If 13  An exception to this prediction will occur if there is a flypaper effect, as in Fafchamps et al. (2014). In this case, firm owners may have suboptimally low levels of capital invested in their business as a result of self-control problems or external pressure, and the program may overcome these issues by directing capital into mental accounts for business use. In this case, there may be a long-term level effect on capital and profits. 
  • 14. 2291McKenzie: Identifying and Spurring EntrepreneurshipVOL. 107 NO. 8 ­individuals invest on the basis of their beliefs about their talent (as in Jovanovic 1982) rather than actual talent, this will change the first-order conditions. Case 4 (YouWiN! Program with Capital and Labor Market Constraints): If firms are credit-constrained, then they invest less in their firms than optimal according to (2). Winning the YouWiN! program could reduce credit constraints in three ways: (i) Directly by providing a grant to the firm; (ii) Indirectly, through providing a signal of quality that leads to more bank lend- ing and (iii) Indirectly, through providing co-financing and a signal of quality that leads to more outside investments from partners. The impact of these channels will be to increase capital stock. This may increase or decrease labor depending on the shape of the production function—a heavily credit-constrained firm may have previously substituted capital for labor, and so reduces workers once it can buy machines to replace them. Conversely, if capital and labor are complements in production, more capital will enable the firm to hire more workers. Profits should increase in either case. This simple model offers a lens through which to interpret the results of the exper- iment, and highlights key mechanisms to examine in understanding these results. If either markets are complete, or the competition is not very good at identifying a group of high-ability entrepreneurs who are constrained, then we should expect no impact of the program unless it succeeds in increasing A and E for participants. In contrast, if capital constraints are important and the competition is able to attract entrepreneurs of sufficient ability, it should induce larger firm sizes for those who win. B. Experimental Estimation The main approach used for evaluating the impact of the program is to use the randomized controlled trial (RCT) based on the random selection of ordinary win- ners from among the semifinalists. This is done separately for the new and existing business applicants, and involves regressions of the following form: (4) ​Outcom​e​ i​​  =  a + b × AssignTrea​t​ i​​  +  c × Region × Gende​r​ i​​  + ​ε​i​​.​ Here AssignTreat denotes whether or not applicant i was randomly cho- sen as an ordinary winner from among the semifinalist experimental pool, and region × gender controls for the randomization strata. Robust (Huber-White) standard errors are used. The coefficient b then gives the average effect of being assigned to receive a grant, the ITT estimate of the program’s impact for firms in the experimental sample. Recall that 13 of the 729 winners were disqualified and so did not receive a grant, while 9 of the 1,112 control firms were nonrandomly selected to replace them. Since these compliance rates with treatment are so high,
  • 15. 2292 THE AMERICAN ECONOMIC REVIEW AUGUST 2017 the local average treatment effects of actually receiving the grant are similar to the ­intent-to-treat effects, and so we report just the ITTs. In order to estimate the trajec- tory of impacts, I estimate the treatment effects separately by year. IV.  Results of the Impacts of the Business Plan Competition The business plan competition had the stated objective of encouraging innovation and job creation through the creation of new businesses and expansion of existing businesses. I examine its success in achieving these outcomes by considering the impact on start-up and survival, the impact on innovation and employment, and then also examine how this translates into profitability and sales. Online Appendix 9 provides details on how key outcomes were measured. My main approach to deal with multiple hypothesis testing is to group the outcomes into domains or families, and then examine the impact on a natural aggregate (e.g., total employment, total capital stock) or standardized index measure (e.g., index of standardized z-scores for profit and sales outcomes) within each domain. In online Appendix 10, I also provide sharpened q-values that hold constant the false discovery rate when reporting results for specific outcomes—all outcomes in Tables 2–8 that have p-values below 0.10 also have sharpened q-values below 0.05. A. Impacts on Start-Up and Survival Table 2 examines the impact of the competition on whether applicants for new enterprises set up a business and have it subsequently survive (panelA), and whether applicants with existing enterprises have these businesses survive (panel B). The first three columns show the extensive margin of whether a firm operates or not, while the remaining three columns combine the extensive and intensive margins to consider how many hours a week the owner works in his or her own firm. Consider first the impacts on new enterprises. Fifty-five percent of those in the control group were operating a business at the time of the first follow-up survey, and 56.9 percent Table 2—Impact on Start-Up and Survival Operates a firm at time of survey Weekly hours worked in self-employment Round 1 Round 2 Round 3 Round 1 Round 2 Round 3 Panel A. New firms Experimental treatment effect 0.215 0.359 0.373 13.538 21.699 19.526 (0.029) (0.023) (0.024) (1.961) (1.704) (1.748) Sample size 1,021 1,181 1,085 993 1,071 927 Control mean 0.550 0.569 0.540 24.9 23.9 19.4 Panel B. Existing firms Experimental treatment effect 0.083 0.130 0.195 9.058 8.643 11.687 (0.027) (0.025) (0.031) (2.653) (2.552) (2.492) Sample size 432 505 477 423 458 409 Control mean 0.871 0.844 0.759 43.3 40.9 31.6 Notes: Robust standard errors in parentheses. Existing and new refers to firm status at time of application. Rounds 1, 2, and 3 are 1, 2, and 3 years after application. Regressions control for randomization strata.
  • 16. 2293McKenzie: Identifying and Spurring EntrepreneurshipVOL. 107 NO. 8 at the time of the second follow-up survey, and 54 percent in the last survey. The experimental estimate of the impact is 21.3 percentage points at the time of the first survey, 35.8 percentage points by the second survey, and 37.3 percentage points by the third survey. These effects are also large, positive, and strongly statistically significant ( p < 0.000001). By the second and third follow-ups, the new applicant winners are spending twice as many hours a week working in self-employment than the control group. Panel B shows that winning also increases the survival rates of existing firm own- ers. Eighty-seven percent of the control firms survived 1 year, 84.4 percent two years, and 75.9 percent three years. Winners had 8 percentage point higher survival rates in the first year, 13 percentage point higher survival rates in the second year, and 20 percentage point higher survival rates in the third year, with these results again strongly statistically significant. Winners are spending almost 12 more hours per week working in self-employment than the control group after 3 years. B. Impacts on Employment Generating employment was one of the main goals of the program. Our main measures of employment come from survey reports. The surveys asked detailed questions on employment in different categories, and questions on the most recent workers hired. Online Appendix 11 compares these reports to administrative data on the winners that came from program reports at around the same time as the second ­survey. The employment reported to the program is larger than that reported to our surveys in the majority of cases, and appears that the administrative data suffers from over-reporting biases. In contrast, comparison of our survey measures with physical observation where available suggests more confidence in the survey mea- sures. I also return to this issue in further robustness checks in Section VII. Table 3 reports the impact of winning on key employment outcomes, while Figure 2 shows quantile treatment effect estimates of the impact on total employ- ment in round 3. These are unconditional estimates, which code employment as zero for individuals not operating firms. Online Appendix 11 shows the descriptive com- parison that treated firms are also hiring more workers than the control conditional on being in operation. The first column of Table 3 shows a positive impact on the employment status of the owner. The difference between these estimates and the impacts on start-up and survival in Table 2 reflects that some individuals would have been employed as wage workers had they not started or continued with their firms. Column 2 then considers total employment in the firm, which is the sum of the owner’s employment in the firm, the number of wage and salary workers, and the number of daily and casual workers in the firm. The average control group firm among new applicants has 3.7 workers by the time of the third survey, with the treatment effect of 5.2 work- ers more than doubling this average. The average control group firm among existing firm applicants has 5.6 workers by the time of the third survey, with the treatment effect of 4.4 workers representing an 80 percent increase. Impacts are larger in the second and third years once all the grants had been received than in the first year. The quantile treatment effect regressions show positive and significant effects across most of the distribution, with the effect size similar in magnitude to the regression
  • 17. 2294 THE AMERICAN ECONOMIC REVIEW AUGUST 2017 estimates between the thirtieth and ninetieth percentiles for new firms and the twen- tieth and ninetieth percentiles for existing firms. Online Appendix 11 shows these increases in employment come from both more wage and salary workers, and from more casual and daily workers, with little change in unpaid workers. Our survey data asks more detailed questions on the three most recently hired workers each year. Only 5 percent of these are related to the owner, 33 percent are female, 45 percent have post-secondary education, and their average wage is 22,400 naira/month (approximately US$143). The third-round survey also asked what these workers were doing before getting hired. Only 36 percent were working in another job, with the rest either unemployed or students. Column 3 examines the extent to which winning the competition has enabled firms to surpass the ten worker threshold.14 Amongst new firm applicants, we see that only 11 percent of the control group had reached this size three years after 14  Note this variable was not included in the pre-analysis plan. It was motivated by the definition of ten workers as a cutoff between micro and small businesses in many countries, and by the work of Hsieh and Olken (2014) noting this threshold as one that few firms in developing countries exceed. The results would be similar if we instead chose another binary threshold under 15 or 20 workers.  Table 3—Impact on Employment and Innovation Own employment Total employment Firm of 10+ workers Firm of 25+ workers Innovation index Panel A. New firms First follow-up 0.074 1.426 0.024 0.007 0.099 (0.025) (0.732) (0.020) (0.008) (0.019) Second follow-up 0.128 6.012 0.288 0.022 0.270 (0.017) (0.412) (0.026) (0.009) (0.018) Third follow-up 0.119 5.227 0.229 0.025 0.219 (0.018) (0.469) (0.028) (0.011) (0.019) Control mean: first follow-up 0.787 3.618 0.083 0.010 0.225 Control mean: second follow-up 0.841 3.305 0.088 0.009 0.214 Control mean: third follow-up 0.831 3.773 0.114 0.014 0.181 Sample size: first follow-up 1,021 987 987 987 995 Sample size: second follow-up 1,181 1,159 1,159 1,159 1,071 Sample size: third follow-up 1,085 1,044 1,044 1,044 927 Panel B. Existing firms First follow-up 0.047 1.512 0.057 0.007 0.105 (0.019) (0.795) (0.041) (0.019) (0.029) Second follow-up 0.066 2.556 0.215 0.009 0.126 (0.018) (1.388) (0.041) (0.018) (0.028) Third follow-up 0.070 4.425 0.208 0.028 0.141 (0.022) (0.673) (0.040) (0.015) (0.029) Control mean: first follow-up 0.938 6.852 0.212 0.032 0.390 Control mean: second follow-up 0.922 8.134 0.231 0.038 0.407 Control mean: third follow-up 0.906 5.571 0.170 0.014 0.341 Sample size: first follow-up 432 422 422 422 423 Sample size: second follow-up 505 500 500 500 458 Sample size: third follow-up 477 461 461 461 409 Notes: Robust standard errors in parentheses. Regressions control for randomization strata. Existing and new refers to firm status at time of application. Rounds 1, 2, and 3 are 1, 2, and 3 years after application. Innovation index is an index of standardized z-scores of 12 different measures of innovative activity.
  • 18. 2295McKenzie: Identifying and Spurring EntrepreneurshipVOL. 107 NO. 8 applying, with treatment increasing this by 22.9 percentage points. Among existing firms, 17 percent of the control group were at this size after three years, with the treatment taking a further 20.6 percent to this level. Few firms have grown to the size of having 25 workers, but columns 4 and 8 of Table 3 show that by the third round the treatment has had a statistically significant 2.5–2.7 percentage point increase in this likelihood, relative to a control mean of only 1.4 percent. In online Appendix 11, I combine the estimates of the total employment effects per firm with the number of winning firms to generate an estimate of the overall difference in employment created between the winners and the control group. The experimental treated firms report a total of 6,858 workers employed at the time of the round 3 survey, of which I estimate that 3,579 are the program impact (95 percent CI is 3,061, 4,161), whereas the remaining workers would have been employed anyway. Adding in the propensity-score matching estimates for the impact on the national and zonal winners then gives a total of 7,027 jobs created from all winning firms. C. Cost Effectiveness for Employment Generation The first round gave the winners 9,240 million naira (US$58 million) in grants. The cost of administering the first round of programs, including scoring the applica- tions, running the 4-day business plan training, and administering the tranche pay- ments, is estimated at $2 million. At the end of the third year, the estimate from onlineAppendix 11 is that 7,027 jobs were directly generated in the treated firms as a result of the program. Thus the cost per job created in the winning firms is US$8,538 (or $9,600 for just the firms in the experimental sample). Online Appendix 12 dis- cusses the additional assumptions needed for this to represent net job creation for Figure 2. Quantile Treatment Effects on Total Employment in Round 3 Notes: New firms and existing firms refer to status at time of application. Round 3 is 3 years after application and 12–18 months after all grants have been received. −5 0 5 10 15 Totalemployment −5 0 5 10 15 Totalemployment 510 20 30 40 50 60 70 80 90 95 510 20 30 40 50 60 70 80 90 95 Percentile OLS Quantile treatment 95% CI Panel A. New firms Percentile Panel B. Existing firms
  • 19. 2296 THE AMERICAN ECONOMIC REVIEW AUGUST 2017 the economy as a whole, and compares this cost to other job creation policy efforts in developing countries. D. Impact on Innovation The other stated objective of the program was to encourage innovation. I measure 12 different types of innovative activities and aggregate these into an index. The last column of Table 3 shows that winners are also innovating more. By the final survey round there is a 22 percentage point increase in innovative activities for experimen- tal winners among new firms, and 14 percentage point increase for existing firms. Online Appendix 13 shows that the new applicants are innovating more in multiple dimensions, introducing new products, processes, pricing methods, quality control systems, using the internet, and using new channels for selling goods. As is standard in developing countries, most of this innovation involves moving toward the world frontier by introducing new products or processes that are new for the firm and often its city or neighborhood, but that are available elsewhere in the country or in the world. As such, they are similar to capital inputs, for which the alleviation of credit constraints allows more of these innovation inputs to be purchased. E. Impacts on Profits and Sales Table 4 reports the treatment impact on several measures of sales and profitabil- ity, and Figure 3 shows quantile treatment effects on profits. The quantile treatment effects for the last survey round show positive and significant impacts on firm profits for all quantiles between the twentieth and the eighty-fourth for new firm appli- cants, and for all quantiles between the twelfth and the seventy-sixth for existing firm applicants. However, there is zero effect at the bottom of the distribution (since profits are zero for firms that don’t operate), and very wide standard errors for the top quantiles (reflecting a long upper tail). This results in low statistical power for looking at impacts on the levels of profits. I use three prespecified approaches to deal with these issues, and in online Appendix 14 also examine robustness to several alternative approaches. The first ­prespecified approach was to truncate monthly profits and sales at the ninety-ninth percentile to reduce the influence of outliers. This transform still leaves a very dis- persed long tail, and a standard deviation of profits that is two to three times the mean, resulting in low power. The second alternative prespecified approach was to consider the inverse hyperbolic sine transformation of profits, which is similar to a log transformation, but allows for zeros and negative values. Third, I use an overall index of standardized z-scores which considers multiple profit and sales measures,15 with this latter measure also providing a summary measure to account for multiple hypothesis testing. 15  These include other measures like asking for annual sales, whether sales were higher than one year ago, and profits in the best month. In the first two rounds we also asked for the number of customers and details of sales of the main product. Firms found these questions difficult to answer, and they were dropped for the third survey round and are not included in the aggregate index here (but are reported in online Appendix 14). 
  • 20. 2297McKenzie: Identifying and Spurring EntrepreneurshipVOL. 107 NO. 8 The first four columns of Table 5 show the impact for new firms. In the first year the impact on the inverse hyperbolic sine of profits is positive and significant, but the impact on the other measures is not statistically significant. The impacts are larger in the second and third year follow-ups and both the inverse hyperbolic sine and Table 4—Impacts on Business Sales and Profits New firms Existing firms Truncated sales Truncated profits Inverse hyperbolic sine profits Aggregate index of sales and profits Truncated sales Truncated profits Inverse hyperbolic sine profits Aggregate index of sales and profits Experimental impacts First follow-up 36.160 −24.512 2.156 0.016 50.805 0.074 0.972 0.080 (49.884) (26.330) (0.369) (0.047) (85.662) (49.416) (0.373) (0.070) Second follow-up 297.783 69.061 4.154 0.298 346.304 69.234 2.183 0.237 (56.494) (15.150) (0.326) (0.036) (134.728) (35.420) (0.401) (0.060) Third follow-up 64.541 20.137 3.962 0.167 349.228 32.035 2.580 0.211 (92.338) (21.635) (0.346) (0.042) (143.729) (40.956) (0.464) (0.070) Control mean: first follow-up 271.467 167.705 6.583 −0.005 509.699 257.025 10.772 −0.045 Control mean: second follow-up 278.177 91.061 6.161 −0.096 660.535 206.305 9.646 −0.117 Control mean: third follow-up 438.490 114.099 5.775 −0.050 509.975 192.151 8.565 −0.108 Sample size: first follow-up 995 995 995 995 423 423 423 423 Sample size: second follow-up 1,151 1,150 1,150 1,152 497 497 497 497 Sample size: third follow-up 1,063 1,063 1,063 1,063 468 469 469 470 Notes: Robust standard errors in parentheses. Experimental estimates are ITT estimates and control for randomiza- tion strata. Sales and profits are in 1,000s of real naira per month. Aggregate index of outcomes includes monthly sales, truncated monthly sales, annual sales, sales higher than one year ago, monthly profits, truncated monthly prof- its, profits in the best month, and inverse hyperbolic sine of profits. Existing and new refers to firm status at time of application. Rounds 1, 2, and 3 are 1, 2, and 3 years after application. Figure 3. Quantile Treatment Effects on Profits in Round 3 Notes: Profits are in thousands of real naira per month. New firms and existing firms refer to status at time of appli- cation. Round 3 is 3 years after application and 12–18 months after all grants have been received. −150 −100 −50 0 50 100 150 200 Totalprofits Totalprofits 510 20 30 40 50 60 70 80 90 95 Percentile 510 20 30 40 50 60 70 80 90 95 Percentile Panel A. New firms −250 −100 −50 0 50 100 250 Panel B. Existing firms OLS Quantile treatment effect 95% CI
  • 21. 2298 THE AMERICAN ECONOMIC REVIEW AUGUST 2017 summary index are significant in both years, while the impact on profits and sales is only statistically significant in the second year. The last four columns of Table 5 show the impacts for existing firms. As with the new firms, the impacts are stronger in years 2 and 3 than in year 1, and are again significant for the inverse hyperbolic sine and summary index measures in both years. The impact on the level of sales is also significant in years 2 and 3, while the impact on profits is only significant in the second year. Online Appendix 14 shows the round 3 impacts on profits and sales are also significant for both new and existing firms if we use any of several alternative transforms that reduce the influence of the top tail of the distribution, as well as examining robustness to other measures of profits and sales. The estimated effect size is approximately 0.2 to 0.3 standard deviations in terms of the aggregate index. The quantile treatment effect on monthly profits in round 3 at the fiftieth percentile is 69,000 naira for new firms and 51,000 naira for new firms, while the regression estimates of the ITT are 69,000 naira (round 2) and 20,000 naira (round 3) for new firms, and 69,000 naira (round 2) and 32,000 naira (round 3) for existing firms. Relative to the monthly profit round 3 control means of 114,000 naira (new firms) and 192,000 naira (existing firms), these estimates are Table 5—Impact on Capital Took a formal loan Received equity investment Value of inventories Made large K purchase Value of capital purchases Value of capital stock Panel A. New firms First follow-up −0.003 −0.005 349 0.289 1,062 1,448 (0.006) (0.010) (123) (0.031) (128) (196) Second follow-up 0.003 0.026 1,869 0.404 1,543 4,568 (0.009) (0.012) (350) (0.029) (143) (464) Third follow-up 0.015 0.001 697 0.103 155 3,489 (0.012) (0.010) (196) (0.031) (122) (324) Control mean: first follow-up 0.011 0.029 721 0.211 345 1,024 Control mean: second follow-up 0.018 0.017 925 0.206 252 1,290 Control mean: third follow-up 0.022 0.020 713 0.206 292 984 Sample size: first follow-up 995 995 991 995 991 995 Sample size: second follow-up 1,071 1,071 1,013 1,071 1,013 956 Sample size: third follow-up 857 857 771 857 771 809 Panel B. Existing firms First follow-up −0.025 0.026 729 0.369 1,356 2,050 (0.017) (0.019) (268) (0.046) (185) (335) Second follow-up −0.039 0.030 1,320 0.242 1,018 3852 (0.020) (0.023) (579) (0.045) (202) (744) Third follow-up 0.001 0.001 845 0.115 221 4,295 (0.025) (0.018) (486) (0.052) (340) (713) Control mean: first follow-up 0.042 0.026 1,223 0.358 537 1,759 Control mean: second follow-up 0.063 0.045 2,226 0.434 596 3,190 Control mean: third follow-up 0.061 0.031 1,645 0.362 668 2,536 Sample size: first follow-up 423 423 422 423 423 422 Sample size: second follow-up 458 458 453 458 453 381 Sample size: third follow-up 372 372 360 372 360 331 Notes: Robust standard errors in parentheses. Experimental estimates are ITT estimates and control for randomiza- tion strata. Inventories and capital values are in 1,000s of real naira per month. Existing and new refers to firm sta- tus at time of application. Rounds 1, 2, and 3 are 1, 2, and 3 years after application.
  • 22. 2299McKenzie: Identifying and Spurring EntrepreneurshipVOL. 107 NO. 8 equivalent to a 17 to 60 percent increase (new firms) and 17 to 36 percent increase (existing firms). V. Mechanisms The results show that winning the competition resulted in sizable increases in employment which persisted after all grant money had been received, and that this increase in employment was profitable for firms. This contrasts with case 1, which predicted no employment effect, and case 2, which predicted that any effect would reverse once all grant money had been received. I therefore turn to examining the impacts on intermediate channels to help understand the mechanisms behind this employment effect. A. Conditionality The fact that the grants were payable in four tranches, with the third and fourth tranches requiring progress on sales and hiring workers, may make the impact ­different from that of an unrestricted grant. I can rule out the mechanism in case 2, whereby conditionality only acts by inducing a short-term increase in the return to labor and capital, since the impacts persist after all payments were received. Moreover, if conditionality were the reason for hiring, it would not explain why the majority of winners hire more workers than needed to be hired to receive the tranche payment. Seventy-eight percent of the winning firms have more employees than required at the time of the second survey, and 73 percent at the time of the third survey. Even without the conditionality, paying the grant in four installments over time may have different impacts to a single lump-sum grant and I am unable to say if the impact would be different if paid in a single one-time grant.16 B. Changes in A and E Next, consider the evidence for case 3, whereby the impact of the program comes from changing the productivity and entrepreneurial skill of those operating busi- nesses. Online Appendix 15 provides results. There is no significant change in entre- preneurial self-efficacy, which measures the owner’s self-confidence in their ability to carry out 12 business-related actions such as “estimate customer demand for a new product,” and “identify good employees who can help the business grow.” This also helps rule out the concern that the control group has become less self-confident as a result of not winning. There is also no change in the likelihood the firm owner has a business mentor, or in the number of other firm owner’s they discuss business with. These suggest the main mechanisms are not through more confidence and connections. There is a minor improvement in business practices for the new firms operating, but the magnitude of the effect is likely to explain only a 0.2 percent increase in the likelihood of operating, and a 4 percent change in profits. There is no 16  For example, recipients facing borrowing and saving constraints may be less able to buy larger value items if the payment is made in tranches, but payment in tranches may help them overcome self-control problems and take longer to plan their investments. 
  • 23. 2300 THE AMERICAN ECONOMIC REVIEW AUGUST 2017 increase in business practices for existing firms. This set of results suggest that the impact is not coming through the mechanisms of increasing A and E. C. Changes in Capital Table 5 examines how winning affected the firm’s use of capital. The first two columns consider the use of outside finance in the form of formal loans and equity investment, respectively. The use of both forms of finance is very low, with fewer than 3 percent of the new firm applicants in the control group receiving either form of financing in a given year, and only 6 percent of existing firm applicants having received a formal loan in any given year, and fewer than 5 percent receiving equity investments. We see relatively little impact on crowd-in or crowd-out of these other sources of financing. New firm applicants were 2.6 percentage points more likely to receive equity financing in round 2, and existing firm applicants were 3.9 percentage points less likely to receive a formal loan in round 2.17 The remaining columns of Table 5, in contrast, show that the grants greatly increased the amount of capital in the winning firms. Treated firms have higher inventory levels, are more likely to have made a purchase of business equipment, land, or buildings of over 100,000 naira, and have spent more on such purchases. The result is that the total capital stock of the treated firms is 3.5 million naira higher than the 800,000 naira control mean among new applicants at the time of round 3, and 4.3 million naira higher than the 2.5 million naira control mean among existing applicants. The winning firms are therefore substantially higher in terms of capital stock, as well as in terms of employment. These results suggest that the main effect of winning is to allow firms to overcome credit constraints by using the capital grants to purchase more capital inputs, hire more labor, and use this to produce a wider variety of inputs. In online Appendix 16, I examine two more pieces of evidence for capital being the main driver of impact. I use the heterogeneity in the amount of grant received among the experimental win- ners and find those winners who received larger grants were able to grow larger.18 I also consider heterogeneity in impacts with respect to the potential importance of capital constraints to the firm at the time of application, finding modest evidence that more capital-constrained firms benefited more from the grants, but also that almost everyone says they are capital-constrained. Under the assumption that the additional workers are paid their marginal product of labor, and that the only impact of the grants on profits is through the increase in capital stock, the implied return to capital can be obtained by estimating the follow- ing equation: (5) ​Profit​s​ i​​  =  a + b × Capita​l​ i​​  +  c × Region × Gende​r​ i​​  + ​ε​i​​​ , 17  Online Appendix 16 shows that informal financing from moneylenders, family, and friends is also rare, and likewise does not appear to have been crowded out by the receipt of the grant.  18  Online Appendix 18 considers two other prespecified dimensions of heterogeneity: gender and business plan score. 
  • 24. 2301McKenzie: Identifying and Spurring EntrepreneurshipVOL. 107 NO. 8 where capital is instrumented with assignment to treatment. I do this first in levels, and then in a log formulation. Table 6 reports the implied return on capital.19 The estimated real return to capital for new firms is 1.3 to 3.4 percent per month, while for existing firms it is 0.4 to 3.3 percent per month. As a comparison, real interest rates for SME finance are around 20 percent per annum. So the average return on capital is at the level needed to pay for a loan were credit available. However, these average returns will include higher returns for some firms and lower returns for others (including those whose businesses fail). Since loan financing does not allow banks to capture the high returns in the upside, but results in losses to the bank in the case of lower returns, in the absence of a way to distinguish well who is likely to succeed, banks will be reluctant to lend. Moreover, given this variability in returns, firms may be reluctant to borrow at prevailing interest rates.20 This is seen in the data, with few control group firms receiving loans. D. How Do the Additional Businesses Induced to Operate Compare to the Control Firms? Winning the competition resulted in many additional firms operating in the treat- ment group than the control group. If scarce credit is allocated first to the most productive firms, we might expect the marginal firms to be induced to operate by the competition to be less efficient and run by less talented individuals than the firms operating in the control group. Online Appendix 17 examines whether this is the case. The observable baseline characteristics of the winners operating a firm in round 3 are similar to the control, with no changes in the sector, nor in the education of the owner. Using data from the first follow-up survey, I also show owners are similar in terms of ability measures (digitspan and Raven test), and grit. Finally, in 19  Note that firms that answered a shortened version of the survey have data on profits, but not capital stock, available. As a result, the Wald ratio of the impact on profits in Table 4 to the impact on capital in Table 5 will not be exactly equal to the implied return on capital in Table 6, since Table 6 restricts to a common sample. This also means the results in Table 6 are specific to those firms answering the full survey.  20  Indeed, equity, rather than debt, may be a more suitable way to fund these types of firms, but few firms receive equity-financing in this market either.  Table 6—Estimated Monthly Real Return on Capital New firms Existing firms Round 2 Round 3 Round 2 Round 3 Panel A. Levels specification: real monthly profits (truncated at 99th percentile) Capital stock (truncated at 99th percentile) 0.017 0.013 0.023 0.004 (0.003) (0.005) (0.010) (0.010) Panel B. logs specification: log (real monthly profits + 1) log (capital stock + 1) 0.410 0.423 0.446 0.411 (0.026) (0.030) (0.057) (0.052) Implied monthly real return (percent) 3.03 3.38 3.34 2.45 Sample size 956 806 381 331 Notes: Robust standard errors in parentheses. Capital stock is instrumented by assignment to treatment. Implied monthly return for log specification estimated at median profit to capital ratio.
  • 25. 2302 THE AMERICAN ECONOMIC REVIEW AUGUST 2017 terms of labor productivity, the marginal firms that only operate as a result of win- ning are not all less productive than the control group firms, but rather come from across the control group productivity distribution. Moreover, these additional firms are larger in size than most firms in Nigeria, and are run by youth with human capital levels that greatly exceed national averages—and as such are expected to be more productive than the average Nigerian firm. VI.  Longer-Term Impacts during a Time of Recession In 2016, Nigeria suffered its worst economic performance in 30 years, driven by a contraction in the oil sector which is the main export and accounts for 70 percent of government revenues. The government imposed currency controls and import restrictions, which led to a parallel exchange rate and inflation reaching 18.5 per- cent, the highest in over a decade. In this difficult environment for firms, I went back and conducted a longer-term follow-up survey between July and November 2016. The survey was answered by 79.7 percent of treatment and 74.5 percent of control firms, and operating status was obtained for 92.5 percent of treatment and 90.9 per- cent of control firms.21 Table 7 summarizes the impacts of the program during this time period, which is five years after applying and more than 3 years since all money has been received from the program. New firm applicants are still 24.1 percentage points more likely to be operating a firm, report 2.6 more workers, and are 11.1 percentage points more likely to have 10 or more workers than control firms. Existing firms are 9.5 percent- age points more likely to be operating, have 3.0 more workers, and are 12.7 percent- age points more likely to have 10 or more workers. These impacts are all significant at the 1 percent levels and large relative to the control means. The impact on the 21  A joint orthogonality test can not reject balance on baseline characteristics for the sample answering the survey for either new firms ( p  =  0.857) or existing firms (0.985).  Table 7—Longer-Term Impacts during a Time of Recession New firms Existing firms Outcome Sample size Control mean Treatment effect Sample size Control mean Treatment effect Operates a firm at time of survey 1,198 0.529 0.241 487 0.761 0.095 (0.028) (0.036) Total employment 1,125 3.810 2.596 462 5.206 2.997 (0.458) (0.756) Firm of 10+ workers 1,125 0.117 0.111 462 0.154 0.127 (0.024) (0.038) Truncated profits 1,085 84.625 −0.866 450 108.978 26.111 (14.970) (24.526) Inverse hyperbolic sine of profits 1,085 5.055 2.368 450 7.768 1.551 (0.378) (0.521) Aggregate index of sales and profits 1,085 −0.019 0.081 450 −0.046 0.102 (0.047) (0.070) Notes: Impacts from round 4 survey taken in July through November 2016, more than three years after all payments had been received. Regressions control for randomization strata. Robust standard errors in parentheses. Regressions control for randomization area.
  • 26. 2303McKenzie: Identifying and Spurring EntrepreneurshipVOL. 107 NO. 8 level of profits is insignificant, but there is a positive and significant impact on the inverse hyperbolic sine of profits for both new and existing firms, and on the aggre- gate index of sales and profits for new firms. Online Appendix 19 shows the quantile treatment effect estimates are positive for profits in the middle of the distribution, but at the lower tail there is no impact with firms closed, and at the upper tail the variance is large. These results show that the program has continued to have positive impacts over a longer time horizon. However, the estimated impacts on firm operation and employ- ment are smaller in magnitude than seen in round 3. This may reflect some of the additional firm growth achieved by treated firms being constrained by the weak economy. VII.  Robustness to Common Concerns about Firm Experiments There are several general issues that affect almost all firm experiments in devel- oping countries: the use of self-reported data, the extent to which impacts arise from general equilibrium factors, and the extent to which the results generalize. I discuss each in turn.22 A. Self-Reporting While the use of self-reported data from surveys is standard for firm experiments in developing countries, readers may be concerned whether such data are reliable. A first point to note is that administrative data on firms are rare in most developing countries, and there is a growing body of evidence to show that firms systemati- cally misreport their revenues, costs, and wages to the authorities (Pomeranz 2015; Carrillo, Pomeranz, and Singhal 2017; Kumler, Verhoogen, and Frías 2015), so that it is not clear that one should prefer administrative data over survey data even if it were available. Indeed the analysis in online Appendix 11 suggests that the admin- istrative data on employment for the business plan competition winners is unreliable in our specific case. Second, the survey was designed and conducted in a manner to reduce reporting bias. It was conducted by a well-known independent market research company (TNS RMS Nigeria) and participants were told its “purpose is to help better understand the growth process of enterprises being run by Nigerian youth, as well as the devel- opment process of youths thinking about starting a business,” with participants told the results would be kept confidential and used for research purposes only. The first round survey asked about a variety of government programs, and not just YouWiN! Together these features are likely to make the survey responses less biased than if the data were collected in an official capacity by the government program imple- menters. Online Appendix 14 shows treatment does not have significant impacts on errors in reporting sales and profits. Finally, although I need to rely on survey data for the majority of the analysis, there are a couple of checks of business size that are not based on self-reports. In 22  Note that these robustness checks were not included in the pre-analysis plan, but are a response to commonly occurring comments raised for almost all firm experiments. 
  • 27. 2304 THE AMERICAN ECONOMIC REVIEW AUGUST 2017 the first and second round follow-ups, approximately 50 percent of the in-person surveys took place in the business (the rest taking place at the home or at a third location). In the third round, more emphasis was put on trying to interview at the business premises, and 90 percent of the in-person surveys of those operating busi- nesses took place at the business.23 Likewise, in the long-term follow-up round in 2016, 97 percent of the in-person surveys for those operating a business took place at the business location. For this subsample the interviewers physically counted how many employees they observed at the place of business. This is an undercount of true employment because it misses workers who are working in another location (e.g., in the homes of clients, in other stores, traveling, etc.) or who are temporarily absent. Nevertheless, it does provide a check of whether observed employment is larger for the treated firms. Second, throughout the survey rounds information was collected on whether the firms have a website, along with the URL. On October 4, 2015, and January 10, 2017 I tested to see whether each firm had a functioning URL. Having a functioning website is a proxy for being of a larger size three-and-a-half years and five years after winning. Table 8 reports the results of these checks. YouWiN! winners have significantly more observed workers and are more likely to have a functioning website for both new and existing applicants. This is true for both the third follow-up and the ­long-term survey round. At the time of the third follow-up, new firms have approx- imately three times as many employees observed at the premises among the experi- mental winners than the control group, and existing firms have almost twice as many employees observed. While the absolute levels are smaller, these ratios are similar to those in Table 3. Both new and existing firms are twice as likely to have a function- ing website among the experimental winners as in the control group. While limited, these checks do help provide assurance that there is a genuine increase in firm sizes for the treated firms. 23  Those whose business had closed down or who had not started businesses were surveyed at their home or in a third location.  Table 8—Impacts on Non-Self-Reported Outcomes New firms Existing firms Employees counted Functioning website Employees counted Functioning website Impact at third follow-up 2.044 0.040 1.746 0.081 (0.263) (0.014) (0.439) (0.030) Long-term impact 1.173 0.022 1.051 0.097 (0.253) (0.013) (0.370) (0.028) Sample size: third follow-up 860 1,300 398 541 Sample size: long term follow-up 908 1,300 386 541 Control mean: third follow-up 1.077 0.047 2.175 0.099 Control mean: long term follow-up 1.220 0.045 2.209 0.072 Notes: Robust standard errors in parentheses. Long-term follow-up is five years after applying, and more than three years after all funding has been received.
  • 28. 2305McKenzie: Identifying and Spurring EntrepreneurshipVOL. 107 NO. 8 B. Competition and Spillovers A second potential concern may be whether the growth of the winners came at the expense of other firms. There are two elements of this concern. The first is a concern about internal validity: if the growth of the winners came at the expense of firms in the control group, the control group would no longer provide a valid counterfactual. This seems unlikely to be an important concern in our case, since the experimental sample is widely scattered over a country of 170 million people, and is not heavily concentrated in any single industry.As a check, onlineAppendix 20 shows that there is no heterogeneity in treatment effect, nor difference in control outcomes, with the number of other firms selected as winners in the same state and industry. As a result, the estimates should be internally valid, and are informative for showing the con- straints facing individual businesses. The second aspect of this concern is then whether the gains to winners came from taking business from other firms in the economy.24 Often this is seen as a concern in thinking about scaling up small pilots, whereas hereYouWin! is operating at a scale of $60 million per year, and is larger than all the other business plan competitions discussed in the introduction. It seems unlikely that such a program would have the intensity randomized at the regional level as in the labor market intervention of Crépon et al. (2013), precluding a randomization approach to measuring these spill- overs. Rotemberg (2015) uses detailed firm data from India and finds a small busi- ness subsidy program there did result in competitors losing market share, but not for those producing internationally traded markets. In the United States, Bronnenberg and Ellickson (2015) note that online sales have had a market expansion effect, by increasing convenience and product variety, so that gains to new entrants need not come from taking market share from incumbents, and they speculate that such chan- nels may be more important in developing country markets. We have seen that winners have indeed increased innovation, adding new prod- ucts and new locations. For example, one of the winners set up a dry-cleaning chain, which expanded into locations where dry-cleaning services weren’t readily avail- able. Given how underdeveloped many product markets are in Nigeria, it seems plausible that the gain in sales is coming from growing the size of the market, not just undercutting competitors. As an additional check on this, online Appendix 20 shows that winners were no more likely to reduce their product prices than the con- trol group, suggesting that the channel for expansion was not taking market share through price competition. This evidence is admittedly indirect and limited, but the absence of detailed data on other firms in Nigeria precludes any further analysis of changes for nonprogram firms. 24  Of course even if the gains to winners all come from taking business from other firms, aggregate efficiency can still increase if the business plan competition reduces misallocation by taking sales from small, unproductive firms and directing it toward more efficient firms. Section VD argues that the winners are likely to be more efficient than the average firm in the economy. 
  • 29. 2306 THE AMERICAN ECONOMIC REVIEW AUGUST 2017 C. External Validity A final critique that can be raised about any impact evaluation is the extent to which its results may generalize. The program studied here is a nationwide program to a large number of firms in Africa’s largest country, and hence should be of intrinsic interest. Moreover, the competition has already been run in three more rounds in Nigeria. Nevertheless, there are reasons to believe the findings may generalize beyond Nigeria. As noted in the introduction, these types of business plan competitions have become increasingly common, particularly in sub-Saharan Africa. While the amounts offered in Nigeria are high, they are far from unique—the average grant sizes in the Somalia business plan competition were $58,000 in round 1 and $67,000 in round 2, and awards of $25,000 were given in Côte d’Ivoire. The key difference here is the large number of winners and randomized selection provide the ability to evaluate and learn from this competition, which has not been possible in the other cases. It seems likely that these competitions in other countries are also inducing applications from entrepreneurs with high growth potential. Whether such entrepreneurs can be identi- fied in alternative ways to business plan competitions and/or be supported through alternative policy instruments to grants are interesting questions for future research. VIII. Conclusions The YouWiN! business plan competition has had large impacts on the rate of business start-up, survival of existing firms, employment, profits, and sales of win- ning firms. It has succeeded in generating more firms with ten or more employees, and provides the first experimental evidence of how direct policy action can spur the growth of such firms. The impacts are not consistent with a model of no market fail- ures in which the grants would be predicted to increase the incomes of the business owners without changing their production decisions. Examination of the interme- diate channels suggests that a main effect of the program has been to enable firms to buy more capital, innovate more, and hire more workers, with little impact on business practices, mentoring, or networking. The business plan competition seems an effective tool for identifying entrepreneurs with much greater scope for growth than the typical microenterprise. References Ayyagari, Meghana, Asli Demirguc-Kunt, and Vojislav Maksimovic. 2014. “Who Creates Jobs in Developing Countries?” Small Business Economics 43 (1): 75–99. Bandiera, Oriana, Robin Burgess, Narayan Das, Selim Gulesci, Imran Rasul, and Munshi Sulaiman. 2017. “Labor Markets and Poverty in Village Economies.” Quarterly Journal of Economics 132 (2): 811–70. Banerjee, Abhijit, Esther Duflo, Nathanael Goldberg, Dean Karlan, Robert Osei, Williwam Parienté, Jeremy Shapiro, Bram Thuysbaert, and Christopher Udry. 2015. “A Multifacted Program Causes Lasting Progress for the Very Poor: Evidence from Six Countries.” Science 348 (6236): 772. Blattman, Christopher, Nathan Fiala, and Sebastian Martinez. 2014. “Generating Skilled Self-Em- ployment in Developing Countries: Experimental Evidence from Uganda.” Quarterly Journal of Economics 129 (2): 697–752. Bronnenberg, Bart J., and Paul B. Ellickson. 2015. “Adolescence and the Path to Maturity in Global Retail.” Journal of Economic Perspectives 29 (4): 113–34. Buera, Francisco J., Joseph P. Kaboski, and Yongseok Shin. 2014. “Macro-Perspective on Asset Grants Programs: Occupational and Wealth Mobility.” American Economic Review 104 (5): 159–64.
  • 30. 2307McKenzie: Identifying and Spurring EntrepreneurshipVOL. 107 NO. 8 Buera, Francisco, Joseph Kaboski, and Yongseok Shin. 2016. “Taking Stock of the Evidence on Micro-Financial Interventions.” http://www3.nd.edu/~jkaboski/BKS_NBER.pdf (accessed June 2, 2017). Carrillo, Paul, Dina Pomeranz, and Monica Singhal. 2017. “Dodging the Taxman: Firm Misreporting and Limits to Tax Enforcement.” American Economic Journal: Applied Economics 9 (2): 144–64. Crépon, Bruno, Esther Duflo, Marc Gurgand, Roland Rathelot, and Philippe Zamora. 2013. “Do Labor Market Policies Have Displacement Effects? Evidence from a Clustered Randomized Exper- iment.” Quarterly Journal of Economics 128 (2): 531–80. De Mel, Suresh, David McKenzie, and Christopher Woodruff. 2008. “Returns to Capital in Microen- terprises: Evidence from a Field Experiment.” Quarterly Journal of Economics 123 (4): 1329–72. Elkan, Walter. 1988. “Entrepreneurs and Entrepreneurship in Africa.” World Bank Research Observer 3 (2): 171–88. Fafchamps, Marcel, David McKenzie, Simon Quinn, and Christopher Woodruff. 2014. “Microenter- prise Growth and the Flypaper Effect: Evidence from a Randomized Experiment in Ghana.” Jour- nal of Development Economics 106: 211–26. Fafchamps, Marcel, and Simon Quinn. Forthcoming. “Aspire.” Journal of Development Studies. Fafchamps, Marcel, and Christopher Woodruff. 2016. “Identifying Gazelles: Expert Panels vs. Sur- veys as a Means to Identify Firms with Rapid Growth Potential.” World Bank Policy Research Paper WPS 7647. Gollin, Douglas. 2002. “Getting Income Shares Right.” Journal of Political Economy 110 (2): 458–74. Haltiwanger, John, Ron S. Jarmin, and Javier Miranda. 2013. “Who Creates Jobs? Small versus Large versus Young.” Review of Economics and Statistics 95 (2): 347–61. Henrekson, Magnus, and Dan Johansson. 2010. “Gazelles as Job Creators: A Survey and Interpreta- tion of the Evidence.” Small Business Economics 35 (2): 227–44. Hsieh, Chang-Tai, and Peter J. Klenow. 2014. “The Life Cycle of Plants in India and Mexico.” Quar- terly Journal of Economics 129 (3): 1035–84. Hsieh, Chang-Tai, and Benjamin A. Olken. 2014. “The Missing ‘Missing Middle’.” Journal of Eco- nomic Perspectives 28 (3): 89–108. International Labour Organization (ILO). 2012. Global Employment Trends 2012: Preventing a Deeper Jobs Crisis. Geneva: International Labour Organization. Jovanovic, Boyan. 1982. “Selection and the Evolution of Industry.” Econometrica 50 (3): 649–70. Karlan, Dean, Ryan Knight, and Christopher Udry. 2015. “Consulting and Capital Experiments with Microenterprise Tailors in Ghana.” Journal of Economic Behavior and Organization 118: 281–302. Klinger, Bailey, and Matthias Schündeln. 2011. “Can Entrepreneurial Activity Be Taught? Quasi- experimental Evidence from Central America.” World Development 39 (9): 1592–610. Kumler, Todd, Eric Verhoogen, and Judith Frías. 2015. “Enlisting Employees in Improving Payroll-Tax Compliance: Evidence from Mexico.” http://www.columbia.edu/~ev2124/research/ KumlerVerhoogenFriasApril2015.pdf (accessed June 2, 2017). Lucas, Robert E., Jr. 1978. “On the Size Distribution of Business Firms.” Bell Journal of Economics 9 (2): 508–23. McKenzie, David. 2017. “Identifying and Spurring High-Growth Entrepreneurship: Experimental Evidence from a Business Plan Competition: Dataset.” American Economic Review. https://doi. org/10.1257/aer.20151404. McKenzie, David, and Christopher Woodruff. 2008. “Experimental Evidence on Returns to Capital and Access to Finance in Mexico.” World Bank Economic Review 22 (3): 457–82. McKenzie, David, and Christopher Woodruff. 2014. “What Are We Learning from Business Training and Entrepreneurship Evaluations around the Developing World?” World Bank Research Observer 29 (1): 48–82. Organisation for Economic Co-operation and Development (OECD). 2010. High-Growth Enterprises: What Governments Can Do to Make a Difference. Paris: Organisation for Economic Co-operation and Development Publishing. Omidyar Network. 2013. Accelerating Entrepreneurship in Africa: Understanding Africa’s Chal- lenges to Creating Opportunity-Driven Entrepreneurship. Omidyar Group. Pomeranz, Dina. 2015. “No Taxation without Information: Deterrence and Self-Enforcement in the Value Added Tax.” American Economic Review 105 (8): 2539–69. Rotemberg, Martin. 2015. “Equilibrium Effects of Firm Subsidies.” https://nyu.app.box.com/s/fov48g qhxjjs843b09drnvbbdqn9v49h (accessed June 2, 2017). Schoar, Antoinette. 2010. “The Divide between Subsistence and Transformational Entrepreneurship.” In Innovation Policy and the Economy, Vol. 10, edited by Joshua Lerner and Scott Stern, 57–81. Chicago: University of Chicago Press.
  • 31. This article has been cited by: 1. Albert Bravo-Biosca. 2020. Experimental Innovation Policy. Innovation Policy and the Economy 20, 191-232. [Crossref] 2. Stjepan Srhoj, Janette Walde. 2020. Getting ready for EU Single Market: The effect of export- oriented grant schemes on firm performance. Structural Change and Economic Dynamics 52, 279-293. [Crossref] 3. Marc F. Bellemare, Casey J. Wichman. 2020. Elasticities and the Inverse Hyperbolic Sine Transformation. Oxford Bulletin of Economics and Statistics 82:1, 50-61. [Crossref] 4. Jumana Alaref, Stefanie Brodmann, Patrick Premand. 2020. The medium-term impact of entrepreneurship education on labor market outcomes: Experimental evidence from university graduates in Tunisia. Labour Economics 62, 101787. [Crossref] 5. . References 453-480. [Crossref] 6. Robert Garlick, Kate Orkin, Simon Quinn. 2019. Call Me Maybe: Experimental Evidence on Frequency and Medium Effects in Microenterprise Surveys. The World Bank Economic Review 103. . [Crossref] 7. . Technological Change 136-157. [Crossref] 8. David McKenzie, Dario Sansone. 2019. Predicting entrepreneurial success is hard: Evidence from a business plan competition in Nigeria. Journal of Development Economics 141, 102369. [Crossref] 9. Saurabh A. Lall, Li‐Wei Chen, Abigayle Davidson. 2019. The Expat Gap: Are Local‐Born Entrepreneurs in Developing Countries at a Disadvantage When Seeking Grant Funding?. Public Administration Review 79:6, 880-894. [Crossref] 10. Richard Sedlmayr, Anuj Shah, Munshi Sulaiman. 2019. Cash-plus: Poverty impacts of alternative transfer-based approaches. Journal of Development Economics 102418. [Crossref] 11. Sabrina T. Howell. 2019. Reducing information frictions in venture capital: The role of new venture competitions. Journal of Financial Economics . [Crossref] 12. David McKenzie, Anna Luisa Paffhausen. 2019. Small Firm Death in Developing Countries. The Review of Economics and Statistics 101:4, 645-657. [Crossref] 13. Arielle Bernhardt, Erica Field, Rohini Pande, Natalia Rigol. 2019. Household Matters: Revisiting the Returns to Capital among Female Microentrepreneurs. American Economic Review: Insights 1:2, 141-160. [Abstract] [View PDF article] [PDF with links] 14. Simon Quinn, Christopher Woodruff. 2019. Experiments and Entrepreneurship in Developing Countries. Annual Review of Economics 11:1, 225-248. [Crossref] 15. Svetlana Boyarchenko, Piin‐Hueih Chiang. 2019. Industry equilibrium with random exit or default. Journal of Public Economic Theory 21:4, 650-686. [Crossref] 16. Alex Coad, Stjepan Srhoj. 2019. Catching Gazelles with a Lasso: Big data techniques for the prediction of high-growth firms. Small Business Economics 34. . [Crossref] 17. Stjepan Srhoj, Bruno Škrinjarić, Sonja Radas. 2019. Bidding against the odds? The impact evaluation of grants for young micro and small firms during the recession. Small Business Economics 76. . [Crossref] 18. Ross Brown, Neil Lee. 2019. Strapped for cash? Funding for UK high growth SMEs since the global financial crisis. Journal of Business Research 99, 37-45. [Crossref] 19. Arti Grover Goswami, Denis Medvedev, Ellen Olafsen. Searching for Winners 117-163. [Crossref]