Yaroslav Rozhankivskyy: Три складові і три передумови максимальної продуктивн...
May Strong for VC Backed IPOs
1. Emily Mendell, NVCA, 610-565-3904, emendell@nvca.org
Matthew Toole, Thomson Financial, 646-822-7560, matthew.toole@thomson.com
Venture-Backed IPOs Record Strongest Month Since 2004
Month of May Saw Highest Volume and Dollars Raised; Further Momentum Could
Be Sign of Recovery
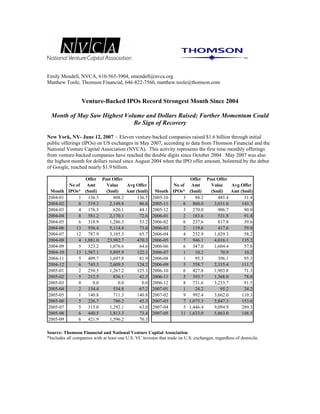
New York, NY- June 12, 2007 – Eleven venture-backed companies raised $1.6 billion through initial
public offerings (IPOs) on US exchanges in May 2007, according to data from Thomson Financial and the
National Venture Capital Association (NVCA). This activity represents the first time monthly offerings
from venture-backed companies have reached the double digits since October 2004. May 2007 was also
the highest month for dollars raised since August 2004 when the IPO offer amount, bolstered by the debut
of Google, reached nearly $1.9 billion.
Offer Post Offer Offer Post Offer
No of Amt Value Avg Offer No of Amt Value Avg Offer
Month IPOs* ($mil) ($mil) Amt ($mil) Month IPOs* ($mil) ($mil) Amt ($mil)
2004-01 1 136.5 808.2 136.5 2005-10 3 94.2 485.4 31.4
2004-02 6 519.3 2,149.8 86.6 2005-11 6 860.0 3,031.0 143.3
2004-03 4 176.3 620.1 44.1 2005-12 3 270.0 906.7 90.0
2004-04 8 581.2 2,170.1 72.6 2006-01 2 183.6 531.8 91.8
2004-05 6 318.9 1,286.3 53.2 2006-02 6 237.6 817.8 39.6
2004-06 13 956.4 5,114.4 73.6 2006-03 2 119.6 417.6 59.8
2004-07 12 787.9 3,185.3 65.7 2006-04 4 232.9 1,029.3 58.2
2004-08 4 1,881.0 23,982.7 470.3 2006-05 7 946.1 4,016.1 135.2
2004-09 5 323.2 1,076.6 64.6 2006-06 6 347.0 1,604.4 57.8
2004-10 13 1,587.1 5,895.9 122.1 2006-07 1 10.2 70.9 10.2
2004-11 5 409.7 1,697.8 81.9 2006-08 1 95.3 396.1 95.3
2004-12 6 745.3 2,609.5 124.2 2006-09 5 558.7 2,335.4 111.7
2005-01 2 250.5 1,267.2 125.3 2006-10 6 427.8 1,903.8 71.3
2005-02 5 212.5 836.1 42.5 2006-11 5 393.7 1,368.0 78.8
2005-03 0 0.0 0.0 0.0 2006-12 8 731.6 3,233.7 91.5
2005-04 2 134.4 534.8 67.2 2007-01 1 24.2 95.2 24.2
2005-05 1 140.8 711.3 140.8 2007-02 9 992.4 3,662.0 110.3
2005-06 5 226.7 786.2 45.3 2007-03 7 1,075.3 5,847.3 153.6
2005-07 5 315.0 1,292.1 63.0 2007-04 5 1,446.4 9,094.9 289.3
2005-08 6 440.5 1,813.3 73.4 2007-05 11 1,633.0 5,863.0 148.5
2005-09 6 421.9 1,596.2 70.3
Source: Thomson Financial and National Venture Capital Association
*Includes all companies with at least one U.S. VC investor that trade on U.S. exchanges, regardless of domicile.
2. Mark Heesen, president of the NVCA was cautiously optimistic about the recent activity.
“The venture-backed IPO volume in May and the market performance of those companies that went public
thus far this year is very favorable compared to the last several years. These companies have successfully
run the gauntlet, having weathered the technology bubble burst and Sarbanes Oxley compliance costs.
They are likely the strongest batch of newly public companies in some time. However, we will need to see
consecutive double digit monthly IPO volume for the rest of 2007 to declare any sort of recovery.
Meaningful Sarbanes Oxley reform will go a long way towards helping other promising venture-backed
companies reach their IPO goals.”
May’s strong performance, coupled with a stable first quarter, boosted the number of venture-backed IPOs
for the first five months of 2007 to 33, the highest level since 2000. Furthermore, the average offer amount
from January through May broke all-time records to reach $156.7 million per issue. Adding to this trend,
the three month period from March-May 2007 marked the first consecutive stretch for $1 billion plus
monthly volume - the first time this has occurred since 2000’s nine month stretch.
YTD January-May
No of Offer Amt Post Offer Avg Offer
Year IPOs ($mil) Value ($mil) Amt ($mil)
2000 116 12,044 63,843 103.83
2001 12 878 4,801 73.18
2002 12 1,076 5,609 89.63
2003 2 157 375 78.60
2004 25 1,732 7,035 69.29
2005 10 738 3,349 73.82
2006 21 1,720 6,813 81.89
2007 33 5,171 24,562 156.70
The industry composition for the first five months of 2007 shows the majority of offerings occurring in the
Medical, Health, and Life Sciences industries followed closely by Information Technology issues. Some
notable IPOs included MetroPCS Communication’s $1.15 billion issue and AECOM Technology
Corporation’s $703 million issue, both of which occurred in the second quarter.
Average performance is strongest for offerings in the information technology sector which have realized a
13.9% increase from their offer price to closing price yesterday, which compares favorably to the 8.6%
change from offer to close price yesterday for all issues on US exchanges in the same time period.
Medical/Health/Life Science and Non-High Technology sectors lag behind the benchmark at 2.2% and
6.6%, respectively.
Industry Breakdown of IPOs January – May 2007
Average % Chg Offer
No of Offer Amt Avg Offer Price to Close Price
Industry IPOs ($mil) Amt ($mil) Yesterday
Information Technology 14 2,900.1 207.2 13.9
Medical/Health/Life Science 16 1,370.6 85.7 2.2
Non-High Technology 3 900.5 300.2 6.6
Total 33 5,171.3 156.7 7.6
Presently there are 45 venture-backed companies filed for an initial public offering with the SEC. This
compares to 44 companies in registration at the end of the first quarter of 2007, and 36 at the end of 2006.
Alex Tan, Global Private Equity Research Manager for Thomson Financial remarked, “The level of venture
capital-backed companies “in registration” represents a backlog that has been building for some time.
These companies are still weighing alternatives and could still choose other options besides an IPO.
3. However, the flurry of new issues during the first five months of 2007 and the notable performance of
venture-backed IPOs could send the right signals that the market is receptive to these companies and that an
IPO path is the right one.”
The regular second quarter Exit Poll data, which reports on venture backed IPOs and M&A’s will be
released the week of July 2, 2007.
About Thomson Financial
Thomson Financial, with 2006 revenues of US$2 billion, is a provider of information and technology
solutions to the worldwide financial community. Through the widest range of products and services in the
industry, Thomson Financial helps clients in more than 70 countries make better decisions, be more
productive and achieve superior results. Thomson Financial is part of The Thomson Corporation
(www.thomson.com), a global leader in providing essential electronic workflow solutions to business and
professional customers. With operational headquarters in Stamford, Conn., Thomson provides value-added
information, software tools and applications to professionals in the fields of law, tax, accounting, financial
services, scientific research and healthcare. The Corporation's common shares are listed on the New York
and Toronto stock exchanges (NYSE: TOC; TSX: TOC).
The National Venture Capital Association (NVCA) represents approximately 480 venture capital and
private equity firms. NVCA's mission is to foster greater understanding of the importance of venture capital
to the U.S. economy, and support entrepreneurial activity and innovation. According to a 2006 Global
Insight study, venture-backed companies accounted for 10.4 million jobs and $2.3 trillion in revenue in the
United States in 2006. The NVCA represents the public policy interests of the venture capital community,
strives to maintain high professional standards, provides reliable industry data, sponsors professional
development, and facilitates interaction among its members. For more information about the NVCA, please
visit www.nvca.org.