Adaptive Learner Profiling Provides the Optimal Sequence of Posed Basic Mathematical Problems
•
0 gefällt mir•1,428 views

Poster at EC-TEL conference 2014, Graz

Empfohlen
Weitere ähnliche Inhalte
Andere mochten auch
Andere mochten auch (9)
Ähnlich wie Adaptive Learner Profiling Provides the Optimal Sequence of Posed Basic Mathematical Problems
Ähnlich wie Adaptive Learner Profiling Provides the Optimal Sequence of Posed Basic Mathematical Problems (20)
Mehr von Martin Ebner
Mehr von Martin Ebner (20)
Kürzlich hochgeladen
Kürzlich hochgeladen (20)
Adaptive Learner Profiling Provides the Optimal Sequence of Posed Basic Mathematical Problems
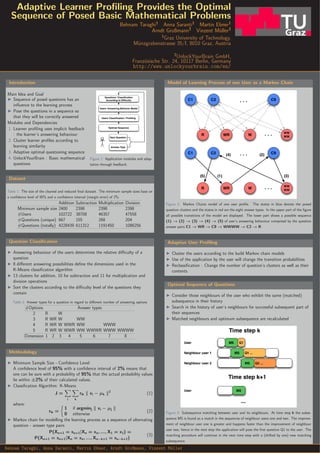
- 1. Adaptive Learner Profiling Provides the Optimal Sequence of Posed Basic Mathematical Problems Behnam Taraghi1 Anna Saranti1 Martin Ebner1 Arndt Großmann2 Vinzent M¨uller2 1Graz University of Technology, M¨unzgrabenstrasse 35/I, 8010 Graz, Austria 2UnlockYourBrain GmbH, Franz¨osische Str. 24, 10117 Berlin, Germany http://www.unlockyourbrain.com/en/ Introduction Main Idea and Goal I Sequence of posed questions has an influence to the learning process I Pose the questions in a sequence so that they will be correctly answered Modules and Dependencies 1. Learner profiling uses implicit feedback : the learner’s answering behaviour 2. Cluster learner profiles according to learning similarity 3. Adaptive optimal questioning sequence 4. UnlockYourBrain : Basic mathematical questions Figure 1: Application modules and adap-tation through feedback. Dataset Table 1: The size of the cleaned and reduced final dataset. The minimum sample sizes base on a confidence level of 95% and a confidence interval (margin error) of 2%. Addition Subtraction Multiplication Division Minimum sample size 2400 2398 2398 2398 #Users 102722 38708 46357 47558 #Questions (unique) 667 155 268 204 #Questions (totally) 4228439 611312 1191450 1086256 Question Classification I Answering behaviour of the users determines the relative difficulty of a question I 8 di↵erent answering possibilities define the dimensions used in the K-Means classification algorithm I 13 clusters for addition, 10 for subtraction and 11 for multiplication and division operations I Sort the clusters according to the difficulty level of the questions they contain Table 2: Answer types for a question in regard to di↵erent number of answering options #Options Answer types 2 R W 3 RWRW WW 4 RWRWWWRWW WWW 5 RWRWWWRWWWWWRWWWWWWW Dimension 1 2 3 4 5 6 7 8 Methodology I Minimum Sample Size - Confidence Level: A confidence level of 95% with a confidence interval of 2% means that one can be sure with a probability of 95% that the actual probability values lie within ±2% of their calculated values. I Classification Algorithm: K-Means J = X i X k rik k xi − μk k2 (1) where: rik = ⇢ 1 if argminj k xi − μj k 0 otherwise (2) I Markov chain for modelling the learning process as a sequence of alternating question - answer type pairs P(Xn+1 = xn+1|Xn = xn, ..., X1 = x1) = P(Xn+1 = xn+1|Xn = xn, ..., Xn−k+1 = xn−k+1) (3) Model of Learning Process of one User as a Markov Chain Figure 2: Markov Chains model of one user profile. The states in blue denote the posed question clusters and the states in red are the eight answer types. In the upper part of the figure all possible transitions of the model are displayed. The lower part shows a possible sequence (1) ! (2) ! (3) ! (4) ! (5) of user’s answering behaviour comprised by the question answer pairs C1 ! WR ! C9 ! WWWW ! C2 ! R. Adaptive User Profiling I Cluster the users according to the build Markov chain models I Use of the application by the user will change the transition probabilities I Reclassification : Change the number of question’s clusters as well as their contents Optimal Sequence of Questions I Consider those neighbours of the user who exhibit the same (matched) subsequence in their history I Search in the history of user’s neighbours for successful subsequent part of their sequences I Matched neighbours and optimum subsequence are recalculated Figure 3: Subsequence matching between user and its neighbours. At time step k the subse-quence MS is found as a match in the sequences of neighbour users one and two. The improve-ment of neighbour user one is greater and happens faster than the improvement of neighbour user two, hence in the next step the application will pose the first question Q1 to the user. The matching procedure will continue in the next time step with a (shifted by one) new matching subsequence. Behnam Taraghi, Anna Saranti, Martin Ebner, Arndt Großmann, Vinzent M¨uller