Webilea: The OpenWebGlobe Project
•
1 gefällt mir•760 views

November 27, 2013 @ Webilea in Basel, Switzerland

Empfohlen
Empfohlen
Weitere ähnliche Inhalte
Was ist angesagt?
Was ist angesagt? (20)
Andere mochten auch
Andere mochten auch (17)
Ähnlich wie Webilea: The OpenWebGlobe Project
Ähnlich wie Webilea: The OpenWebGlobe Project (20)
Mehr von Martin Christen
Mehr von Martin Christen (12)
Kürzlich hochgeladen
Kürzlich hochgeladen (20)
Webilea: The OpenWebGlobe Project
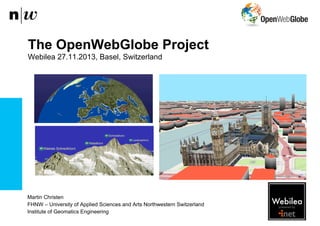
- 1. The OpenWebGlobe Project Webilea 27.11.2013, Basel, Switzerland Martin Christen FHNW – University of Applied Sciences and Arts Northwestern Switzerland Institute of Geomatics Engineering
- 2. WebGL • Web Graphics Library (based on OpenGL ES 2.0) • Rendering interactive 2D/3D graphics within the webbrowser • Optimized for JavaScript • Hardware acceleration using the Graphics Processing Unit (GPU) • WebGL programs consist of: • application code written in JavaScript (CPU) and • shader code (GLSL) for the GPU • No plugin for these (desktop) browsers: (11+) Institute of Geomatics Engineering 27 November 2013 2
- 3. • Virtual Globe without plugins for modern webbrowsers. • Open Source Project started in April 2011 (based on C++ version started in 2005) • Created by FHNW - University of Applied Sciences Northwestern Switzerland (Institute of Geomatics Engineering) • Uses HTML5 and WebGL • JavaScript Library for rapid development of web-based 3D geoinformation applications • Full integration into customer web sites • Runs on Windows, MacOS X, Linux • Targets Desktop and Mobile Devices* Institute of Geomatics Engineering 27 November 2013 3
- 4. Demo http://world.openwebglobe.org http://swiss3d.openwebglobe.org Institute of Geomatics Engineering 27 November 2013 4
- 5. Layers / Contents • Imagery / Elevation • POIs • 3D Models • HTML5 Canvas Element • Overlays • Point Clouds Institute of Geomatics Engineering 27 November 2013 5
- 6. Hello World http://jsbin.com/owg_layer_example/1/edit Institute of Geomatics Engineering 27 November 2013 6
- 7. Global Datasets in 2D First we need to understand how global 2D maps work. OpenStreetMap, Google Maps, Bing Maps, ... Theoretical example Earth: – Land area of around 148.9 Mio. km2 (~ 29%) – Water area of around 361.2 Mio. km2 (~ 71%) If we had a global dataset with 25cm2 / Pixel: – Land area (uncompressed) around 170 Petabytes Institute of Geomatics Engineering 27 November 2013 7
- 8. 2D Tiles - Always one zoom level visible - User zooms in/out (GUI / mouse wheel) - only required data ("visible data") is requested from the server (or cloud) Screenshots from Google Maps Institute of Geomatics Engineering 27 November 2013 8
- 9. 2D Maps – Quadtree structure 256 Institute of Geomatics Engineering (Image courtesy of Microsoft, Bing Maps) 27 November 2013 9
- 10. The Step to 3D Basically the same like 2D, however: 256 - The View Frustum contains different LOD 256 - Level of detail depends on camera position. - Elevation data can be displayed (change of perspective) 256 256 Institute of Geomatics Engineering 27 November 2013 10
- 11. OpenWebGlobe: 2.5D Elevation Tiles (Level of Detail) Institute of Geomatics Engineering 27 November 2013 11
- 12. Important Tile Types 2D Image Tile contents: 256x256 Pixels (in most cases) (May also contain rasterized vectors etc.) 2D Vector Tile contents: 2D Geometry (Number of Elements limited for LOD) 2D Elevation Tile (-> for creating 3D Tiles) contents: Elevation values (e.g. numbers) contents 17x17 values (or similar). Institute of Geomatics Engineering 27 November 2013 12
- 13. Other Data Sources Solution #1: Generating and storing tiles in the cloud download visible data fragments (tiles) - WMS, WMTS, TMS, ... - Postgres / PostGIS - 3DPS (in Future) Generate many many many many many many many many many many tiles (Web-) Viewer - HTML5 - JavaScript - WebGL for 3D Upload Raw data to Cloud (or web server) Raw: Image, Elevation, 3DModels, Point Clouds, ... Institute of Geomatics Engineering 27 November 2013 13
- 14. Solution #2: Generate tiles in the Cloud using On-The-Fly Tile Generation and caching Institute of Geomatics Engineering 27 November 2013 14
- 15. HPC: 120 TB Data (900GB/s), 4 Tesla GPUs, >50 CPU Cores Institute of Geomatics Engineering 27 November 2013 15
- 16. Showcase: 3D-Geometry Tiles (from OSM data & Buildings of Interest) Bachelor Thesis / Master Thesis @FHNW IVGI Image courtesy of BTh Hürbi/Daetwyler, MTh Lucas Oertli, 2013 MapData © OpenStreetMap contributors Institute of Geomatics Engineering 27 November 2013 16
- 17. ShowCase: Rapid 3D Mapping Institute of Geomatics Engineering 27 November 2013 17
- 18. ShowCase: SwizzQuiz – Interactive Geo Game Institute of Geomatics Engineering 27 November 2013 18
- 19. Conclusion • OpenWebGlobe • 2D & 3D Tiles... almost the same... but very different • Computer Graphics & Geo community need to work together when creating 3D Standards. • We need Standards for rendering efficiently. • Different approach for creating (3D-) Tiles using current standards. Institute of Geomatics Engineering 27 November 2013 19
- 20. Questions ? https://github.com/OpenWebGlobe @OpenWebGlobe @MartinChristen MapData © MapPuls, ASTER GDEMv2, Landsat Institute of Geomatics Engineering 27 November 2013 20
- 21. "Web Mercator" / "Popular Visualization Pseudo Mercator" - Min/Max Latitude at around +-85 degrees (-> square map...) - Projection: Sphere (!) with radius of 6378137m - Invented by Google, unfortunatly many web maps use it today (Reason was performance, but that is not really the case) - "almost conformal" projection. - EPSG:3857 (don't use EPSG: 900913) Projection Sphere (!!!) Institute of Geomatics Engineering Projection Ellipsoid (virtual Globe) 27 November 2013 21
- 22. 3D Tiles ? Institute of Geomatics Engineering 27 November 2013 22